
DECISION SUPPORT SYSTEM FOR CLASSIFICATION OF
NATURAL RISK IN MARITIME CONSTRUCTION
Marco Antonio García Tamargo, Alfredo S. Alguero García, Víctor Castro Amigo
Department of Information Technology, University of Oviedo, Campus de Viesques, 33204 Gijón, Spain
Amelia Bilbao Terol
Department of Quantitative Economics, University of Oviedo, Campus del Cristo, 33006 Oviedo, Spain
Andrés Alonso Quintanilla
Fomento de Construcciones y Contratas, (FCC), Oviedo, Spain
Keywords: Decision-making support, Artificial intelligence, Data mining, Risk prevention, Building of maritime works.
Abstract: The objective of this paper is the prevention of workplace hazards in maritime works – ports, drilling and
others – that may arise from the natural surroundings: tides, wind, visibility, rain and so on. On the basis of
both historical and predicted data in certain variables, a system has been designed that uses data mining
techniques to provide prior decision-making support as to whether to execute given work on a particular
day. The system also yields a numerical evaluation of the risk of performing the activity according to the
additional circumstances affecting it: the number of workers and the machinery involved, the estimated
monetary cost of an accident and so on.
1 INTRODUCTION
Prevention of workplace risks seeks to prevent
accidents that might entail injury or even loss of
human lives, or monetary losses. Assessment of risk
of a natural origin – wind, rain or tide – often tends
to be intuitive, and thus bears a substantial degree of
subjectivity.
The natural surroundings in construction works,
particular maritime works, entail a series of special
features that make it quite changeable in terms of the
risk they may suppose to the performance of certain
types of work (Inst. Seguridad e Higiene en el
Trabajo, 2003). This can be due to meteorological
conditions, the state of the sea and, in most cases,
the continuous change in the scenario caused by the
progress of work; hence, determination of risk must
have a predictive nature.
The company Fomento de Construcciones y
Contratas, Construcción (FCCC hereinafter), a
section of the parent company FCC, one of the
leading building companies in Spain with an
international projection, is carrying out a large
number of works in maritime settings where sea
conditions and climate determine the temporal and
physical progress of each work and the potential risk
to workers performing them. This paper constitutes
part of a pilot project in this line that is being carried
out in 2007-2008 in the framework of the Spanish
National Plan 2004-2007 for Scientific Research,
Development and Technological Research in the
section of Promotion of Technical Research. To
execute the project, FCCC contracted the research
group at the University of Oviedo, the authors of this
paper. The objective was to develop an intelligent
risk prevention system that operated semi-
autonomously. Based on forecasts of certain climate
variables and the accumulated experience of safety
experts in similar situations, the system would
induce prior classifications in times and days as to
whether the risk of performing a given activity was
acceptable or not; it would also provide a numerical
evaluation of the expected risk according to
seriousness of the risk and the number of people and
machines involved. The aim would be twofold: first,
138
Antonio García Tamargo M., S. Alguero García A., Castro Amigo V., Bilbao Terol A. and Alonso Quintanilla A. (2009).
DECISION SUPPORT SYSTEM FOR CLASSIFICATION OF NATURAL RISK IN MARITIME CONSTRUCTION.
In Proceedings of the 11th International Conference on Enterprise Information Systems - Artificial Intelligence and Decision Support Systems, pages
138-143
DOI: 10.5220/0001983201380143
Copyright
c
SciTePress

to protect the physical safety of workers and,
second, to minimize costs incurred in the under-use
of resources by means of a their preventive
relocation in tasks that are not dangerous on a given
date.
2 BACKGROUND
The firm FCCC has already developed a work
methodology, Metodología de Trabajo de Control
del Oleaje (FCCC, 2007) that can yield a daily
forecast of working conditions for a number of the
activities entailed in the building of a port:
anchoring of blocks, unloading of aggregates and so
on.
This methodology is based on a calculation of
the freeboard – or maximum level a wave could
reach above the working level, using the latter as the
zero – in an explicit way of meteorological
variables: significant wave, tide index and the type
of terrain: the slope, the working level and so on.
The methodology was implemented in a
rudimentary manner in a complex spreadsheet that
ultimately generates a recommendation as to
whether work can be performed in a certain working
area, with reference to each of the times of day
examined.
However, a series of known limitations have
been found in this methodology, which are
quantitatively summarized in the error percentages
in the period under study, from June to October
2007. In this period, it had an average error rate of
35.45%; with the lowest accuracy rates in the
months that were the fairest meteorological sense,
and thus the least hazardous.
In view of the criticisms and defects found in the
previous tool by the workplace safety expert who
was using it, the alternative system we present
herein, conceived as a decision-making support
system (Ríos Insua, S., Bielza Lozoya, C., 2002)
should meet the following requirements:
a) It should be risk classification system that
is more accurate than the present one, and, due to
the particularly subjective nature of risk
assessment, should be grounded in the
experience of the technical director in assessing
similar situations of risk.
b) It should assist experts in deciding whether
or not to perform a given activity sufficiently in
advance so as to allow for optimal use of human
and material resources.
c) It should provide a numerical quantification
of risk that encompasses both human and
material risks. Such quantification would be
provided with the prediction outlook allowed by
available prognoses.
d) It should automate to the extent possible
both the acquisition of the data required and the
generation of daily reports with the prediction.
3 METHODOLOGY USED
The maritime work is defined as a set of units. In
each unit, a series of activities such as block
anchoring or aggregate dumping are performed over
time.
The risk of performing an activity is determined
by a set of naturally generated variables that are
considered by expert user to be determinative for the
risk conditions of that activity: wind speed, the
height of the significant wave, rainfall and so forth
for maritime work; therefore, activity in a maritime
work at a given time is identifiable by a state vector
comprised of the values of all those variables at the
time.
Initially, the risk for a given moment is to be
determined with a Boolean method: true, which
entails a prognosis of don't work, and false (table 1),
which entails of recommendation of work.
Transferred to a state vector framework, the
problem might arise of making a prediction for a
state vector such as classifying the vector in one of
two values for risk: true or false. A simplified
geometric model of the solution to this problem
would be to obtain a hyperplane that separated the
two types of state vectors: those classified as true
and those classified as false. But the real world is
somewhat more complex.
Table 1: State vectors with the Boolean risk classification.
Date Time Hso Tp K … Risk
4/6/08 00:00 0.8 11 1.05 … TRUE
… … … … … … …
4/6/08 23:00 0.8 9 1.05 … FALSE
… … … … … … …
In the state vector space of an activity, nearly all
the variables have a maximum or minimum; the very
fact of exceeding them would be a determination of
extreme risk and, therefore, a decision to not work in
the given activity, regardless of the values of the
other variables. Thus, instead of a single hyperplane,
there is a series of hyperplanes perpendicular to the
axes of the n-dimensional space, which, as a whole,
would constitute a polyhedral frontier between the
vectors of the two categories we have mentioned,
DECISION SUPPORT SYSTEM FOR CLASSIFICATION OF NATURAL RISK IN MARITIME CONSTRUCTION
139
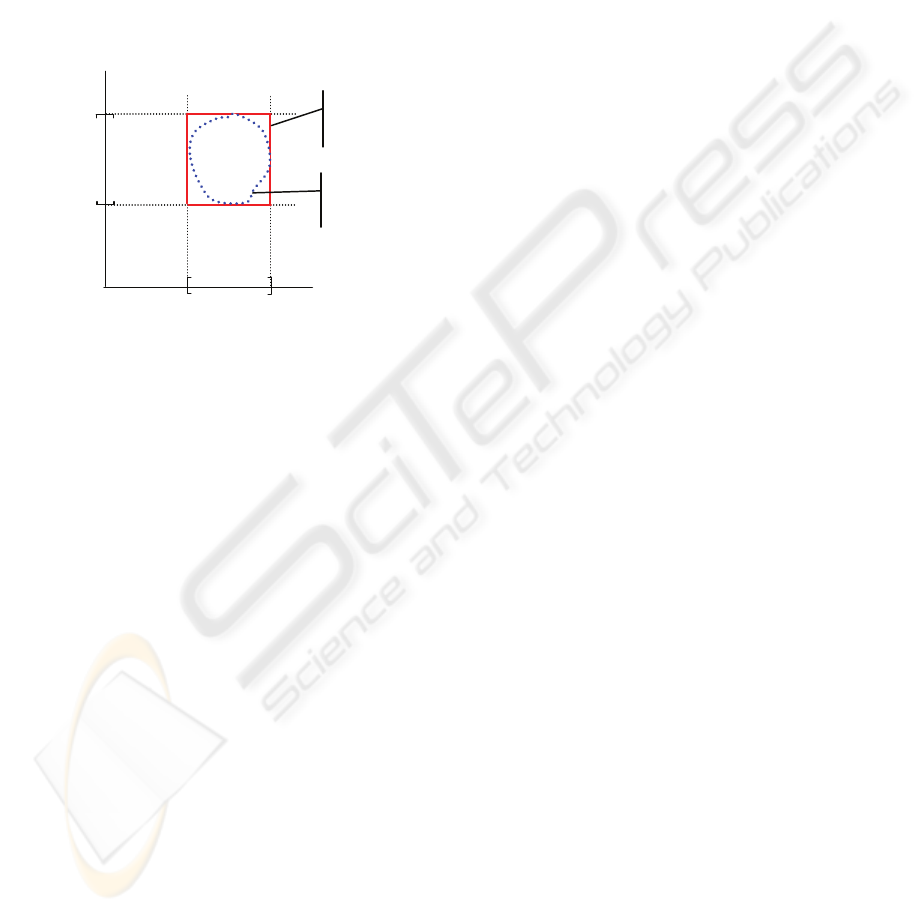
namely true and false. The inner zone adjacent to
that frontier, specifically that of the edges and
vertices of the polyhedral surface, is the risk
decision zone or the caution zone, and here is where
the frontier must be redefined. An accumulation in
single vector of several variables with values that do
not exceed the hazard maximums but which are near
them, as would be the case with state vectors in the
caution zone, may belong – in principle, at the
judgment of the expert – to a category other than the
one it would be found owing to its position with
respect to the polyhedral frontier (figure 1).
Figure 1: 2-dimensional depiction of natural frontier.
Having modelled the problem in this way,
consideration was given to the method that should
be used to solve it, and we decided to rule out
conventional models based on analytic mathematical
models – i.e., a formula to determine risk – due
mainly to the large degree of subjectivity used by
experts in assessing risk.
Consequently, we decided to use one of the
existing systems with the capacity for supervised
inductive learning. The system should learn from
state vectors that reflect past situations that have
been classified by an expert according to the risk
they entailed. The classification model provided by
the system would induce classification for state
vectors that were not necessarily included in the
learning process; that is, it would neatly trace the
new frontier in the caution zone based on the expert
decisions for the state vectors in the past.
An activity in a given instant in the maritime
work will be identified with a state vector to which a
Boolean class variable will be added with the
possible values of true or false. The new state vector
shall be n-dimensional, where n-1 is the number of
variables that have been defined to assess the risk in
that activity y la n-th the special class variable. An
example or case will be a specific state vector.
Measurements generated by examples are commonly
made at one-hour intervals. Examples that will be
used to train the system will have a special variable
value that classifies each as: true, a situation of high
risk, or false, when the risk is low or at least
acceptable. Classification of these examples will
have been performed – or at least supervised – by an
expert. With a database with this vector type as
entries, learning systems extract models that enable
subsequent classification of new cases. Models are
abstractions of structural patterns that present
vectors classified in one class against those
classified with another: that is, systems will learn to
distinguish high-risk situations from low-risk ones
by using the knowledge accumulated in the learning
process and retained as a model.
The abundance of learning systems means that
multiple solutions or models are possible; usually
more than one per system, as these offer parameters
that, according to their settings, make the system
produce different solutions. An important task shall
be to decide what system of learning and what set of
parameters to use, in addition to studying the
suitability of the variables used and perhaps
reducing or increasing the number of them; in short,
a good job of data mining is needed, (Wittten et al.,
2005).
Following these considerations, discussions and
the pertinent tests, we decided to pre-select two
systems of supervised inductive learning for trials
and a more thorough comparison in our problem:
these were C4.5 (Quinlan, 1993) and Support Vector
Machines (SVMs, hereinafter) (Cortés, Vapnik,
1995), (Cristianini, Shawe-Taylor, 2004).
Conceptually, these systems are quite different:
while the first is based on a heuristic approach, the
second is grounded in a whole mathematical theory
to explain its method. We will now provide a brief
description of each.
3.1 The C4.5 System
C4.5 is a traditional automatic learning system that,
however, remains fully valid (Jaudet et al., 2005),
and needs no introduction. For this paper, its main
feature is that it produces the knowledge learned in
an explicit form, by means of a decision tree or
classification rules; in both cases, these are
comparable to the experience of an expert in the
field, an aspect of the utmost interest to us. C4.5
works with both qualitative and quantitative
variables and is powerful when faced with noise.
C4.5 incrementally generates a decision tree; each
new level is originated by a variable that is selected
for its importance in determining class.
O
X-safety
margin
Polyhedral
frontier
Natural
frontier
Y-safety
margin
X
Y
ICEIS 2009 - International Conference on Enterprise Information Systems
140

3.2 SVMs
SVMS obtain an optimal separating hyperplane from
examples from each of the two classes, which are
usually transformed into a new space.
SVMs include, as a quite efficient strategy, the
transformation of the example space into another,
larger one, which is called a feature space, in which
examples transformed will likely prove to be linearly
separable. The scalar product between vectors of the
transformed space is achieved according to the
scalar product defined in the initial space and the
transformation between spaces or kernel function,
which makes calculation of the hyperplane in the
feature space computationally feasible.
One SVMs drawback lies in its sensitivity to
parameters that adjust its operations, and another,
the most important one for our purposes, is the
implicit form of knowledge they produce, as a
function, which corresponds to that of an optimal
separating hyperplane of the examples of each class.
Because of this weakness, which safety experts from
the contracting firm criticized, and the results the
SVMs yielded in the trials, they were ultimately
ruled out in our choice in favor of C4.5.
4 EXPERIMENTS PERFORMED
For experiments to evaluate the two systems, we
began with a set of 20 variables related to the risk of
performing an activity. For these variables we had
historical data accumulated since the start of the
maritime work. Each state vector consisted of the
values of these variables at a specific instant, plus
the class variable, which represents the decision
taken by the expert at that time on risk: true risk or
false risk; the risk value provided by the prediction
model used by FCCC was also available.
We thus had a set of 2296 entries similar to that
shown in table 1, comprised of state vectors in
instants that were all from the past; further, the risk
value provided by the prediction model presently
used by FCC was also available for each entry.
4.1 Experiments with SVMs
We performed work with the SVMs most commonly
used in classification problems: C-SVC and nu-SVC.
For each of these, tests were conducted for the most
commonly used general purpose kernel functions:
linear, polynomic, Gaussian (rbf), sigmoidal, inverse
multiquadratic.
A cross validation was performed on each type
of SVM and kernel function, with experiments with
different learning option values, and different
parameters of the kernel functions.
As shown in table 2, the best result of 86.80% of
accuracy, was achieved for the nu-SVC and the
Gaussian kernel (rbf) with parameters of nu=0.3 and
C=0.1. This result represents an improvement of
22.35% in risk prediction over the model presently
used by FCC.
Table 2: Results of cross validation with SVMs and
different parameters.
4.2 Experiments with C4.5
The C4.5 system was subjected to a size 10 cross
validation, with different sets of parameters for both
trees and rules.
The best mean accuracy percentage, 90.9%, was
obtained with rules, which was 3.6% better than the
best result achieved by the SVMs, and 25.95% better
than the average accuracy of the present analytical
model. The parameters used in this case, which
differed from the default values used by the system,
were those from the pruning, c= 35, compared to the
default c=25, which involved a larger pruning, and
the relative to the redundancy of attributes or
variables, r=1.5 compared to the default r=1, which
meant that there was a certain redundancy of
variables or attributes among those used. The
redundancy had been detected by the principal
components method, but given the fact that reducing
the number of variables failed to improve results, the
possibility was ruled out.
SVM Kernel Test
parameter
Best
performance
Precision
class
nu-SVC rbf
C C=0.03125
0.824
nu-SVC poly
Degree
C
degree=2.5
C=0.1
0.810
nu-SVC rbf
Nu
C
nu=0.3
C=0.1
0.868
nu-SVC rbf
Gamma
C
gamma=0.1
C=0.1
0.861
C-SVC linear
C C=2
0.801
C-SVC rbf
C C=2
0.854
C-SVC poly
Degree
C
degree=3.0
C=0.1
0.834
C-SVC rbf
Gamma
C
gamma=0.1
C=0.1
0.834
nu-SVC rbf
C
gamma
nu
C=0.5
gamma=0.01
nu=0.4
0.862
DECISION SUPPORT SYSTEM FOR CLASSIFICATION OF NATURAL RISK IN MARITIME CONSTRUCTION
141
In view of the excellent results yielded by this
system in the validation, we decided that the
classification model to be used to detect situations of
risk would be the rules produced by C4.5 with the
parameters seen.
5 RISK INDEX
C4.5 induces a classification model that can
subsequently classify state vectors not seen in that
phase, for which the value of the attribute class
(risk) is unknown. Values of the other attributes of
these vectors shall consist of the values predicted for
variables that influence the activity to be performed
up to the prediction horizon available, which can
range from one day to a week. By applying the
mining model to these vectors, we will obtain a
classification for each of them. If we have 24 state
vectors for every working day (1 day = 3 work shifts
of 8 hours per shift), the mining model will yield 24
values of risk class for each working day. These 24
values have to be summarized in a risk index (RI)
for each working day that will enable an expert to
decide whether or not to work in that activity on that
day. This RI will be calculated as a linear
combination that is adjusted by the user with the
weights (hrw+mrw=1) of two components: human
risk (HR) and machine risk (MR):
RI=HR*hrw+MR*mrw
HR is 0 if there is no potential affect to any
worker. In case a worker could potentially be
affected, we define HR as follows:
HR=(persistence+scope)/2*aif
where aif (aif∈(0.1]) is a weighting factor supplied
by the expert of the severity that might be involved
in an accident among workers.
Persistence is the proportion of the working day
in which the situation of risk persists, and this is
defined as follows:
Persistence=
HoursExistenceRisk/HoursWorkingday.
Calculating persistence involves predictions
obtained from the data mining model for the variable
risk class.
Scope includes the potential number of workers,
out of the total involved in the activity, which would
be directly exposed to the risk.
Scope= PotentialWorkersAffected/TotalWorkers
It remains to be defined how the term RM, or
risk to facilities and machinery, will be defined.
RM=DCPAM*ND/ATC*mif
Where, DCPAM is an estimate of the daily cost
of the machines potentially affected by the accident.
ND is an estimate of the number of days in which
machines may be out of service if affected by the
accident. ATC is the total cost of the activity
performed and mif (mif∈[0,1]) is a weighting factor
of the severity of an accident on working machinery.
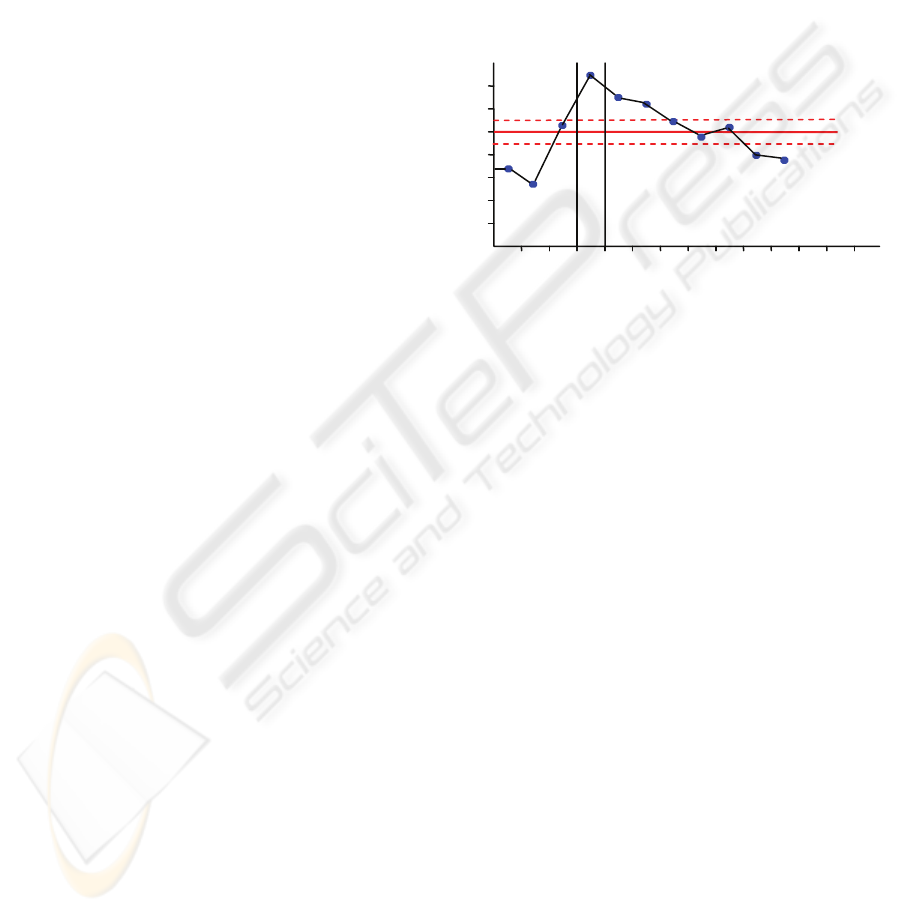
Figure 2: RI evolution chart from -3 day to +7 day.
The RI can be predicted for any activity as far in
advance as values are available for the state vector
variables. The chart trend of the RI variable will
enable an expert to make decisions sufficiently in
advance (figure 2).
6 CONCLUSIONS AND FUTURE
WORK
A system has been created for predicting risk of a
natural origin in a maritime environment.
Predictions are made with a classification model
obtained by C4.5 trained in the previous decisions of
a safety expert in past meteorological conditions of a
similar nature. The entire process is integrated into a
powerful and versatile software tool that automates
most tasks; everything from data capture to report
generation and including publication on a server
through an FTP protocol, in addition to training of
the automatic learning system. The tool is modular,
thus allowing the future addition of other automatic
learning systems or its extension, such as publication
of its reports on a website. We would highlight the
following:
• The capacity to simultaneously implement
nearly any analytical model of risk calculation
based on an explicit function.
RI
+7 +6
days
+5 +4 +3 +2
+1
-3 -2 -1 0
0,7
0,6
0,5
0,4
0,3
0,2
0,1
ICEIS 2009 - International Conference on Enterprise Information Systems
142
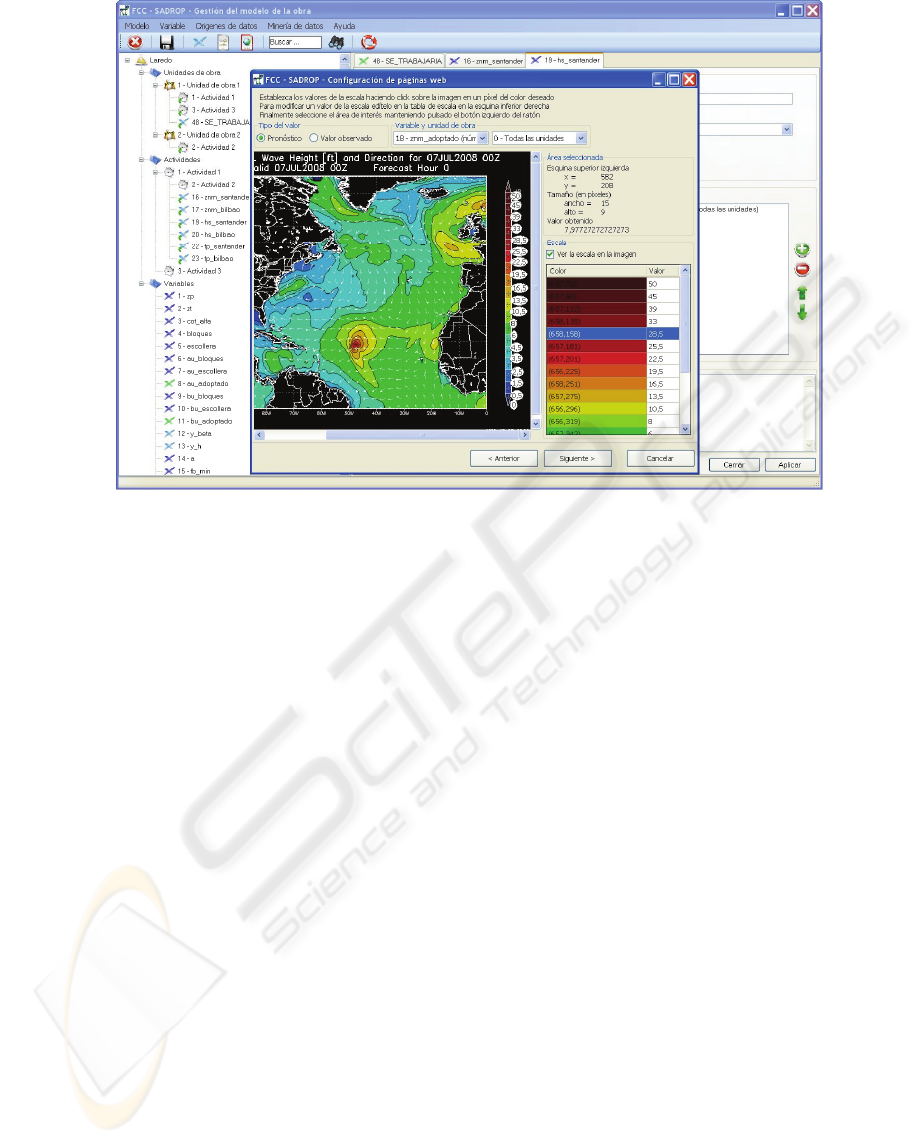
Figure 3: Configuration to retrieve data provide on the Internet by means of chromatic codes.
• The ability to retrieve data provided on the
Internet by means of chromatic codes (figure 3).
• The ability to functionally define new variables
that depend on others previously defined.
The tool has been in use on a trial basis in work on
the Laredo marina in Cantabria, Spain for a short
time. The results it is providing in classification of
state vectors, now with predicted data in their
components, is being evaluated, as their reliability
depend on the reliability of the predictions, and an
extensive period of testing is necessary in order to
reach a sound judgment; nevertheless, our
impression is quite positive, and consistent with the
results yielded with historical data in the laboratory.
At present, work is under way to redefine the state
vectors, with a view to integrating into a single
vector a concatenation of present vectors that
correspond to several consecutive hours both
beforehand and afterwards; thus, each new vector
will cover a time interval that contextualizes the
meteorological data. Therefore, a few specific hours
of meteorological bonanza on one or more rainy
days will not lead to mistakes. The initial trials with
these vectors are yielding encouraging results that
are superior to those of present state vectors.
REFERENCES
Cortés, C., Vapnik, V., 1995. Support Vector Networks.
In Machine Learning, 20: 237-297.
Cristianini, N., Shawe-Taylor, J., 2004. An Introduction to
Support Vector Machines and other kernel-based
learning methods. Cambridge University Press 2004,
2
st
edition.
FCCC, Fomento de Construcciones y Contratas,
Construcción 2007. Metodología de Trabajo de
Control del Oleaje. Informe técnico interno, Laredo
Spain.
Inst. Seguridad e Higiene en el Trabajo, 2003. Guía
Técnica, para la Evaluación y Prevención de los
Riesgos Relativos a las Obras de Construcción. 2003.
Madrid, Spain.
Jaudet, M., Iqbal, N., Hussain A., Sharif, K., 2005.
Temporal Classification for Fault-prediction in a real-
world Telecommunications Network. In ICET 2005,
IEEE-2005 International Conference on Emerging
Technologies.
Quinlan, J.R., 1993. Programs for Machine Learning.
Morgan Kaufmann Publishers, San Mateo, California
USA.
Ríos Insua, S., Bielza Lozoya, C., 2002. Mateos Caballero,
A. Fundamentos de los Sistemas de Ayuda a la
Decisión. Editorial Ra-Ma, Madrid.
Witten, I.H., Frank, E., 2005. Data Mining. Practical
Machine Learning Tools and Techniques. Elsevier,
Morgan Kaufman Publishers, San Francisco, USA, 2
nd
edition.
DECISION SUPPORT SYSTEM FOR CLASSIFICATION OF NATURAL RISK IN MARITIME CONSTRUCTION
143
