
AN ANALYSIS OF THE DIFFUSION OF INFORMATION
TECHNOLOGY IN EDUCATION
Towards Europe’s Information Society
Laura Asandului, Ciprian Ceobanu and Alina Ionescu
“Al. I. Cuza” University, Iasi, Romania
Keywords: Information society, Information technology, Education, e-Learning.
Abstract: The accelerated development of the information and communication technologies determined educational
institutions and companies to implement alternatives to the traditional teaching methods. The new literacy
determines the e-learning competencies. The paper concerns an analysis concerning the expenditure for
information technologies, the use of computer and of Internet, computer and Internet skills, and also e-
learning in the EU countries. The results showed that there are disparities among EU member states
regarding the extent and the perspectives for the developing of e-learning.
1 INTRODUCTION
In the last decade, the tremendous increase in the
amount of available information was possible
through the enhancement of the access to computers
and to Internet. The information era make possible
the enlargement of the information’ accessibility by
tools more sophisticated. Education is facing many
challenges to become more relevant for the
information society. In this society the citizens have
to be life-long learners, the workers are expected to
acquire independently knowledge and skills and to
be able to communicate in a variety of contexts. This
requires an important transformation of education
and ICT can be the means to realize this
transformation (Fredriksson, Jedeskog, Plomp,
2007).
Thus, one of the goals of the educational system
should be to prepare students for taking an
independent and responsible role in the information
society. Furthermore, this goal will be achieved only
if the students acquire the necessary skills for
working with large amounts of information from a
wide range of sources (Barzilai, Zohar, 2007; Land,
Greene, 2000; Salomon, 2000). ICT mediated
learning became an integral component of education
and training systems. Moreover, with the rise of ICT
era, new competencies became vital. Digital literacy,
the ability to use ICT, is one of the most important.
E-learning has emerged as an imperative tool to
deliver knowledge in the academic as well as
corporate sectors. Backed by several favourable
trends, the world e-learning market is projected to
exceed US$52.6 billion by 2010 (http://www.
strategyr.com/pressMCP-4107.asp
). The US retains
its dominance in the corporate e-learning market
with a share of over 60%. Europe is the second
largest market with a share of less than 15%.
Despite its obvious advantages in terms of
reduced costs, simplified training programs and
flexibility, the e-learning is not always the miracle
solution. Conceived as a powerful educational tool,
e-learning was destined to change the face of
learning. But unfortunately this change wasn’t
exactly the one it was intended. In Europe,
corporations face the problem of poor utilization of
the eLearning solution and the corporate e-learning
has real problems in all stages as follows:
a. Initial Design Issues (lack of identification of real
needs; poor strategic design decisions regarding: the
structure of the course, methods and media to be
used, course management and evaluation).
b. Instructional Design and Development Issues
(lack of detailed instructional design; failure to
develop instructional design elements-authoring or
graphic design; lack of evaluation and revision of
the instructional design).
c. Dissemination and Implementation Issues
(problems in production, reproduction and
distribution; poor implementation and use of the e-
186
Asandului L., Ceobanu C. and Ionescu A. (2009).
AN ANALYSIS OF THE DIFFUSION OF INFORMATION TECHNOLOGY IN EDUCATION - Towards Europe’s Information Society.
In Proceedings of the 11th International Conference on Enterprise Information Systems - Human-Computer Interaction, pages 186-189
DOI: 10.5220/0002001701860189
Copyright
c
SciTePress

learning; long term management and evaluation).
(Romiszowski, 2004).
If we take into account these problems we can
state that a lot of corporate e-learning initiatives are
failures; we mean that the intended learning did not
really take place. Technologies such as Learning
Management Systems (LMS) and Learning Content
Management Systems (LCMS) are widely spread
but these do not lead to the intended learning. All
the technologies without effective online instruction
will not produce any significant learning results.
There are some explanations for these (Woodill,
2004): (i) the rush to launch on the market the new
educational courseware and educational technology
without a proper testing; (ii) focus on new
technology, not on instructional design; (iii) lack of
understanding of learning and teaching and of the
unique teaching advantages of electronic media.
In these circumstances there are lessons to be
learned by the software providers. Both, the
technology-obsessed course developers who create
highly interactive, very spectacular and very
expensive multimedia courseware that are not very
efficient and the courseware creators that offers
numerous simple programs, a kind of page-turners
that are little more than PowerPoint presentations,
need to take into account solid quality standards for
e-learning and need to be based on sound
educational principles.
2 DATA AND METHOD
The information society can be characterized by
certain indicators, among which we used 15
variables regarding computer and Internet, clustered
in 5 groups as follows:
a. Information Technology Expenditure, which
contains Information Technology Expenditure as a
percentage of GDP (inf_techn_inGDP) and GDP per
capita, EU27=100 (GDP_capita)
b. Level of Internet access and Internet and
computer use with: percentage of individuals who
used a computer within the last year (i_clt12);
Percentage of households having access to the
Internet at home) (h_iacc); Percentage of individuals
regularly using the Internet (who accessed Internet,
on average, at least once a week) (i_iuse)
c. Individuals' level of computer skills: Percentage
of individuals who have carried out 1 or 2 of the
computer related activities ( i_csk_lo); Percentage of
individuals who have carried out 3 or 4 of the
computer related activities (i_csk_me); Percentage of
individuals who have carried out 5 or 6 of the
computer related activities (i_csk_hi)
d. Individuals' level of Internet skills: Percentage
of individuals who have carried out 1 or 2 of the
Internet related activities (i_isk_lo); Percentage of
individuals who have carried out 3 or 4 of the
Internet related activities (i_isk_me); Percentage of
individuals who have carried out 5 or 6 of the
Internet related activities (i_isk_hi)
e. Indicators regarding e-learning: Percentage of
individuals who used Internet, in the last 3 months,
for formalized educational activities (school,
university, etc) (i_iedu); Percentage of individuals
who used Internet, in the last 3 months, for other
educational courses related specifically to
employment opportunities (i_ieduot); Percentage of
individuals who used Internet, in the last 3 months,
for post educational courses (i_iedupt); Percentage
of enterprises using e-learning applications for
training and education of employees (e_iedu)
Data values are registered at country level for the
27 EU member states, the reference year being 2006.
We used data from Eurostat and also from E-
communications Household Survey carried out in
November-December 2007. The interviews were
conducted among over 26000 EU citizens in the 27
Member States of the European Union. Among the
topics addressed was one named Computers and
Internet.
In order to explore the data set and to identify
and characterize the EU countries e-learning
characteristics as well as the existent resources for
developing of e-learning, we used principal
components analysis (PCA). The value of Barlett’s
test of sphericity and the value of the indicator MSA
of KMO indicate that the considered variables are
adequate for a PCA. We also performed a cluster
analysis in order to identify the groups of
homogenous countries concerning certain ICT
indicators.
3 RESULTS
The results obtained from the analysis of the E-
communications Household Survey revealed that
57% of European households have at least one
computer. There is a significant difference in
household computer ownership between the
European Union’s old and new member states. The
lowest computer penetration rates are found in the
European Union’s newest Member States: Romania
– 35% and Bulgaria – 27%. Regarding the Internet
access, we notice that 49% of households within EU
AN ANALYSIS OF THE DIFFUSION OF INFORMATION TECHNOLOGY IN EDUCATION - Towards Europe's
Information Society
187
27 have Internet access (Special Eurobarometer
293). In 25 % of countries, the Internet penetration
rate is below 35%. The highest rates were registered
in the Netherlands, Denmark and Sweden, and less
than 25 % of households in Romania, Bulgaria and
Greece had Internet access. If we correlate these two
indicators, the computer rate and Internet rate, we
can say that the lack of a computer is an obstacle to
Internet access.
Factorial solution indicates variables’ grouping
in 4 principal components which have an explicative
power of 82.696% of the total variance. As the
variance the first two factorial axis account for is
64.799% of the total variance, we will analyze
below the characteristics of e-learning and e-
learning resources in EU countries according to the
positions of variables and of cases in the factorial
plane determined by this first two component.
It can be noticed that good economical results
create a basis for supporting the development of e-
learning, while the investments in information
technology are directly correlated with population
access to Internet and with individuals’ computer
skills and Internet skills.
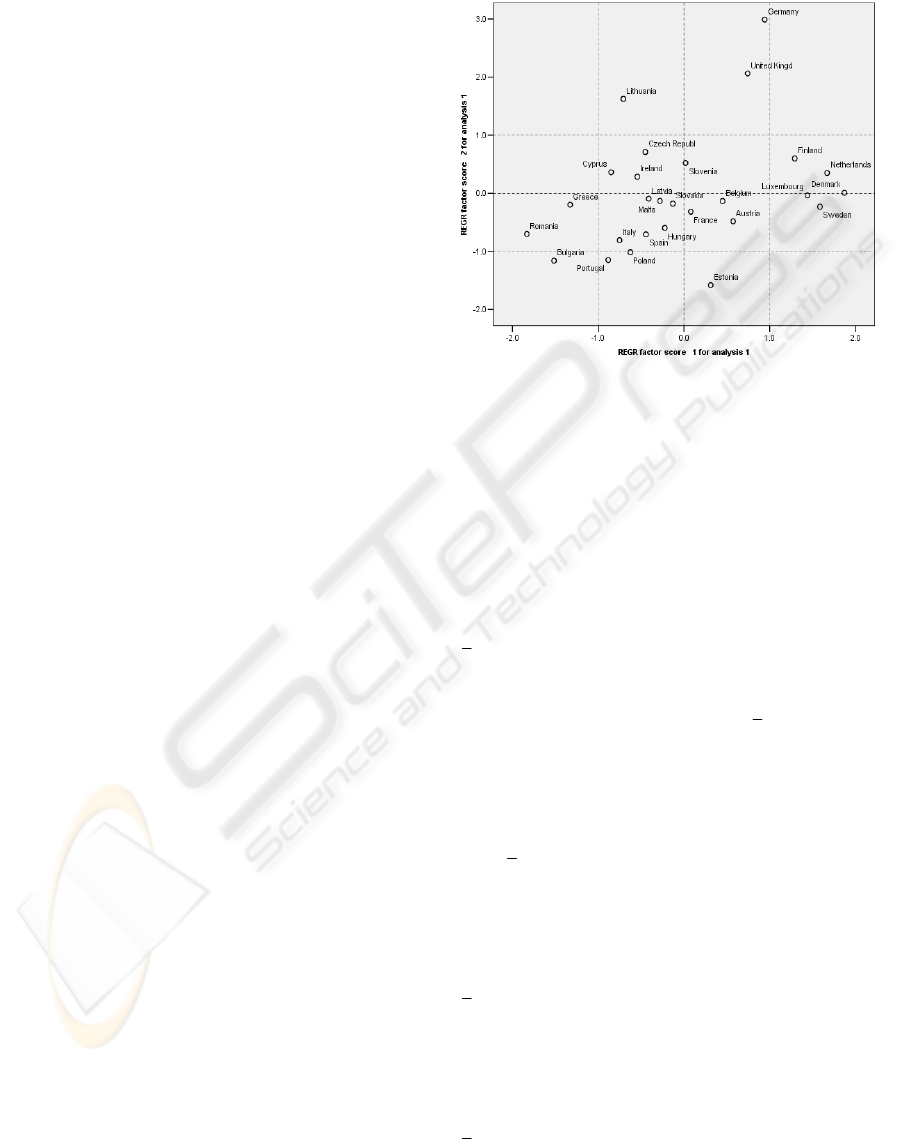
We can identify some characteristics of e-
learning in EU countries (Figure 1). Thus, it can be
noticed that countries that were integrated in the
latest wave (Romania and Bulgaria) lay on the left
side of the plane, being characterized through lack of
or low resources for e-learning development: low
access to Internet, reduced investments in
information technology and small percentages of
individuals with computer skills and Internet skills.
Greece, Italy and Ireland have similar characteristics
to these two groups of countries, while Slovenia and
Estonia are exceptions as the profiles of their e-
learning are closed to that of the most developed EU
states, although Estonia is the EU country with the
lowest interest in e-learning activities. The old EU
countries are characterized by significant resources
for e-learning development supported by good
economical results and important investments in
information technology and show a relatively high
interest in using Internet for educational purposes.
It can be seen that the e-learning is not very
developed in Spain and Portugal, the two countries
finding themselves in the quarter of the factorial
plane which express the lowest interest in e-learning
activities and the poorest basis for e-learning
development. Romania is also positioned in this area
of the factorial plane having e-learning
characteristics similar to Greece and Bulgaria. It
owns the poorest resources for e-learning
development as it presents the smallest score on the
first factorial axis. Individuals’ and enterprises’
interest in e-learning activities is still a reduced one
comparing with the other EU members.
Figure 1: Countries’ position on the first two factorial
axes.
Analysis of countries’ positions on the factorial
map allows us to identify the countries where the e-
learning has the greatest extent or the most
favourable environment for its development or those
that present the lowest interest in or the lesser
developed basis for e-learning activities, using the
rule of the 3σ on each factorial axis (Jaba 2007). The
axis of peoples’ and enterprises’ interest in e-
learning activities identifies Germany over the limit
σ
3
+
x , as having the highest percentages of
individuals and companies that are using Internet for
educational purposes. This country is followed by
UK and Lithuania near the limit of
σ
2+x interval,
all the three countries being positioned at a
significant distance from the other EU members
according to the second axis. The lowest interest in
educational services via Internet is met in Estonia,
Bulgaria, Portugal and Poland, which exceed the
limit
σ
−
x on the first axis. According to the first
axis, the most important resources, expressed in the
level of internet access, individuals’ computer and
Internet skills and economical support, are specific
to Denmark, Netherlands, Sweden, Luxembourg and
Finland, which are situated at the right side of
σ
±
x interval. They are followed by Germany and
UK, at the limit of interval. An explanation of this
pattern of diffusion is that in the education and
training systems in these countries the English
language is dominant. At the opposite side we find
Romania, Bulgaria and Greece, at the left side of
σ
±
x interval, where the poor resources limit the
ICEIS 2009 - International Conference on Enterprise Information Systems
188
perspectives for the development of e-learning. In
these countries people and enterprises confront
themselves in a greater extent with the lack of
Internet access or adequate skills together with a
poor economic support for developing educational
activities using Internet.
United Kingd
Sweden
Spain
Slovenia
Slovakia
Romania
Portugal
Poland
Netherlands
Malta
Luxembourg
Lithuania
Latvia
Italy
Ireland
Hungary
Greece
Germany
France
Finland
Estonia
Denmark
Czech Republ
Cyprus
Bulgaria
Belgium
Austria
country
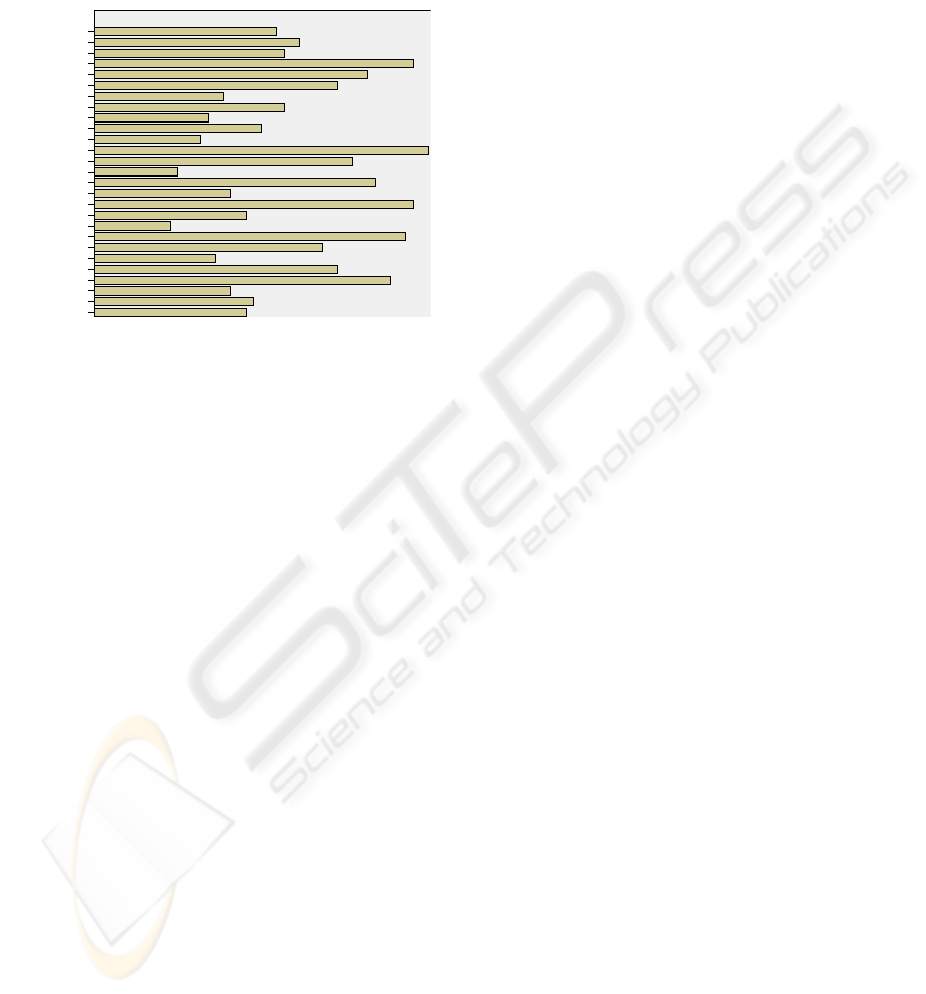
Figure 2: Percentage of enterprises using e-learning
applications for training and education of employees, by
country, in 2006.
Concerning corporate eLearning, the data from
Eurostat revealed that the highest percentages of
enterprises using e-learning applications for training
and education of employees are registered in
Lithuania, Slovenia, and Greece (Figure 2). This can
be explained by the size, the number and the profile
of the companies using e-learning tools for
employees training.
If we group the countries by the indicators
regarding Information Technology expenditure,
Internet access, and computer use one can notice 5
groups as follows: 1. Italy, Portugal, Czech
Republic, Poland, Lithuania; 2. Spain, Hungary,
Ireland, Slovenia, Latvia, Slovakia; 3. Bulgaria,
Romania, Greece; 4. Denmark, Sweden,
Netherlands, Finland; 5. Germany, United Kingdom,
Belgium, Austria, Estonia. The highest percentages
(averages) concerning the above indicators are
registered in group 4 and the lowest, in group 2.
4 CONCLUSIONS
Despite the similarities among the countries from
each cluster concerning the indicators on
Information Technology expenditure, Internet
access, and computer use, there are significant
differences among the 5 groups of countries. The
explanations are different from country to country.
E-learning was seen having a tremendous
potential to respond to the challenges of the
knowledge society, to improve the quality of
learning, to address special needs, and to bring about
more effective and efficient learning and training at
the workplace (Ruttenbur et al. 2000). But the reality
is pretty different from what, not long time ago, the
enthusiasts foreseen. E-learning, in generally and
corporate e-learning, in particularly, does not
represent the revolution within corporate training
(Cross, 2007) and the direction of e-learning’s
evolution does not prove to be the appropriate one.
In these circumstances, the differences among
European countries regarding the use of corporate e-
learning may turn out into an advantage for the
group of “ITC underdeveloped”. Bridging the ITC
gap does not mean for these countries to embrace in
a non-critical manner e-learning strategies and tools.
Starting from the positive and negative experiences
within this field, following the instructional design
principles, general e-learning strategies and
corporate training must be reconsidered within the
new global realities.
REFERENCES
Barzilai, S., Zohar, A., 2007. Is information acquisition
still important in the information age?, in Education
and Information Technologies, vol. 13, no.1, Springer.
Cross, J., (2007) Informal Learning - Rediscovering the
Natural Pathways that Inspire Innovation and
Performance, Pfeiffer, John Wiley & Sons, Inc., San
Francisco, CA.
Fredriksson, U., Jedeskog, G., Plomp, T., 2008. Innovative
use of ITC in schools based on the findings in ELFE
project, in Education and Information Technologies,
vol. 13, no.2, Springer.
Jaba, E., Balan, C., Iatu, C., 2008. Statistical analysis of
the Regional Disparities concerning the Economic
Growth, in Proceedings of the First Joint Meeting of
the Societe Francophone de Classification and the
Classification and Data Analysis Group of the SIS,
Caserta, Italy
Romiszowski, A., 2004. How’s the E-learning Baby?
Factors Leading to Success or Failure of an
Educational Technology Innovation Educational
Technology, 44(1) January-February 5-27.
Ruttenbur, B.W. et al., 2000. Elearning - the Engine of the
Knowledge Economy, Morgan Keegan.
Woodill, G., 2004. “Where is the Learning in E-
learning?”, Operitel Corporation.
AN ANALYSIS OF THE DIFFUSION OF INFORMATION TECHNOLOGY IN EDUCATION - Towards Europe's
Information Society
189
