
GISEIEL: AN OPEN SOURCE GIS FOR TERRITORIAL
MANAGEMENT
∗
Pedro A. Gonz
´
alez
Servicio de Asistencia T
´
ecnica a Municipios. Diputaci
´
on Provincial de A Coru
˜
na. 15006 A Coru
˜
na, Spain
Miguel Lorenzo
Servicio de Organizaci
´
on e Innovaci
´
o”n Tecnol”
´
ogica. Diputaci
´
on Provincial de A Coru
˜
na. 15006 A Coru
˜
na, Spain
Miguel R. Luaces, David Trillo and Jos
´
e Ignacio Lamas Fonte
Database Laboratory. University of A Coru
˜
na. 15071 A Coru
˜
na, Spain
Keywords:
Geographic information system, Spatial data infrastructure, Territorial management, Open source.
Abstract:
The provincial government A Coru
˜
na, in Spain, has been working on the last years in the construction of a
geographic information system for the management of its territory. The result of this work are three software
products: WebEIEL, gisEIEL and the ideAC node. WebEIEL is the web application that publishes the infor-
mation on the Internet. gisEIEL is the desktop application that is used by the provincial government and the
municipalities to create, query, visualize, analyze and update the information in the system. Finally, the ideAC
node is a spatial data infrastructure that uses international standards to publish the information as a part of the
Spanish spatial data infrastructure. In this paper, we describe the functionality and the architecture of the sys-
tem and we present the problems that we had to face during the development of the system and the solutions
that we applied.
1 INTRODUCTION
The Spanish government requires every provincial
government to conduct each year a survey on the situ-
ation and condition of the infrastructure and facilities
in each municipality (named EIEL from the Spanish
Encuesta sobre Infraestructura y Equipamientos Lo-
cales). This information is used by the Spanish and
the provincial governments to discover the funding
needs of each municipality and to propose actions to
balance the living conditions in the different munici-
palities
The province of A Coru
˜
na is located in northwest-
ern Spain. With more than one million inhabitants and
almost eight thousand square kilometers, it is densely
populated with more than a hundred and twenty-five
inhabitants per square kilometer. In the year 2000,
∗
This work has been partially supported by “Ministerio
de Educaci
´
on y Ciencia”(PGE y FEDER) ref. TIN2006-
16071-C03-03, and by “Xunta de Galicia” ref. 2006/4 and
ref. 08SIN008E.
the provincial government of A Coru
˜
na decided to
broaden the goals of the EIEL with these new tasks:
(i) to extend the information to be collected, both in
terms of the different kinds of elements to be sur-
veyed, and the amount of information for each par-
ticular item, (ii) to reference the items surveyed to
its geographical location or extent, and to construct
a geographic database and applications for its man-
agement, and (iii) to publish the data through a user-
friendly GIS web application and through a spatial
data infrastructure to make it available to all the citi-
zens of the province.
These goals were achieved through a collabora-
tion with the University of A Coru
˜
na. The work
was carried out in several phases. In the first phase,
from the year to 2000 to the year 2003, the geo-
graphic location and/or shape of more than 100 dif-
ferent types of entities were surveyed to construct a
database of about seven gigabytes of alphanumeric
and geographic information. A large group of stu-
dents from the Civil Engineering school and the Ar-
177
A. González P., Lorenzo M., R. Luaces M., Trillo D. and Ignacio Lamas Fonte J. (2009).
GISEIEL: AN OPEN SOURCE GIS FOR TERRITORIAL MANAGEMENT.
In Proceedings of the 11th International Conference on Enterprise Information Systems - Databases and Information Systems Integration, pages
177-182
DOI: 10.5220/0002004501770182
Copyright
c
SciTePress

chitecture school (about a hundred people) collected
the data by direct observation or interviewing the re-
sponsible staff in each municipality. All the soft-
ware engineering issues in the project were the re-
sponsibility of the Database Laboratory of the Uni-
versity of A Coru
˜
na. Their task was to develop all the
GIS applications required to insert, maintain, manage
and publish all the collected data. The problems that
appeared during this task are described in (Brisaboa
et al., 2007).
Once the database was created and populated, the
second phase was the development of applications to
exploit the data. This was done between the years
2004 and 2006. The first application (called gisEIEL)
was a desktop application deployed at the provin-
cial government and used by its staff to visualize,
analyze and keep the alphanumeric and geographic
data updated. The second one was a web-based GIS
(called WebEIEL) that can be accessed over the Inter-
net (Deputaci
´
on Provincial da Coru
˜
na, 2008).
During the third phase, from the year 2006 to the
present day, the provincial government decided to mi-
grate the application to open source software and to
implement a spatial data infrastructure (named ideAC
node) that publishes the information using standards
as a part of the Spanish spatial data infrastructure. In
this paper, we describe this migration process, the
functionality and the architecture of these applica-
tions and the problems that had to be faced during
their development process. The rest of the paper is
structured as follows: first, we describe in Section 2
the migration process from the first version of the
applications developed using proprietary software to
the current version developed using open source soft-
ware. Then, we describe in Section 3 the function-
ality and the architecture of WebEIEL and the ideAC
node. After that, Section 4 describes the application
gisEIEL paying special attention to the functionality
and the methodology for the survey. Finally, we end
the paper with conclusions and future work in Sec-
tion 5.
2 MIGRATION TO OPEN
SOURCE SOFTWARE
When the project started in the year 2000, all the ap-
plications were implemented using the GIS develop-
ment tools provided by Intergraph, particularly Geo-
media Professional and Geomedia Web Map (Inter-
graph Corporation, 2008). There were two main rea-
sons for this decision. First, time and cost require-
ments for the project forced us to use existing GIS de-
velopment tools instead of implementing the applica-
tions from scratch using custom-developed modules.
And second, when the analysis and design of the sys-
tem started in the year 2000 the relevant international
standards were not mature. The first consequence of
this decision was that the applications only worked on
a Microsoft operating system. Given that the provin-
cial government uses Linux on their servers, the ap-
plications had to run in a virtual machine with the
consequent loss of efficiency. Another consequence
was that the web publishing service (Geomedia Web
Map) was only compatible with Microsoft Internet
Explorer. Therefore, the users were forced to use
this web browser. The third consequence was that the
data had to be stored using a read-only proprietary
format (Geomedia SmartStore) in order to achieve
an acceptable efficiency rate in the web publication.
This implied that the information was duplicated with
all the problems associated to this fact (e.g.: com-
plex publication process and incoherency problems).
A final consequence was that Geomedia Web Map
did not conform to the Open Geospatial Consortium
(OGC) standards when the applications were devel-
oped, therefore, the applications could not be used as
a spatial data infrastructure.
These problems, along with the publication of the
INSPIRE directive (INfrastructure for Spatial InfoR-
mation in Europe (European Commission, 2008)),
determined a deep change in the philosophy of the
project and in the selection of technologies that are
the foundation of the system. In the year 2006, the
provincial government and the Database Laboratory
started a new project to migrate all the system to open
source software and to create a node of the Span-
ish spatial data infrastructure for the province of A
Coru
˜
na (Pedro A. Gonz
´
alez, 2004). Figure 1 shows
the evolution of the system. The architecture of the
system using proprietary software is depicted on the
left side of the figure. The new architecture using
open source software is shown on the right side of the
figure. The equivalent components on each architec-
ture are depicted with boxes and arrows joining them.
The first task of the process was the migration
from Microsoft SQL Server (Microsoft Corporation,
2008) to PostgreSQL (PostgreSQL Global Develop-
ment Group, 2008) and PostGIS (Refractions Re-
search, 2008). This implied a migration from a GIS
architecture using opaque binary large objects for the
representation of geographic features to a GIS archi-
tecture using an extensible database system following
the Simple Features for SQL standard (OGC, 2006a).
The migration of the data was performed by a custom
application that used the Geomedia Professional API
to read the information from the source database and
created the SQL scripts used to restore the database in
ICEIS 2009 - International Conference on Enterprise Information Systems
178
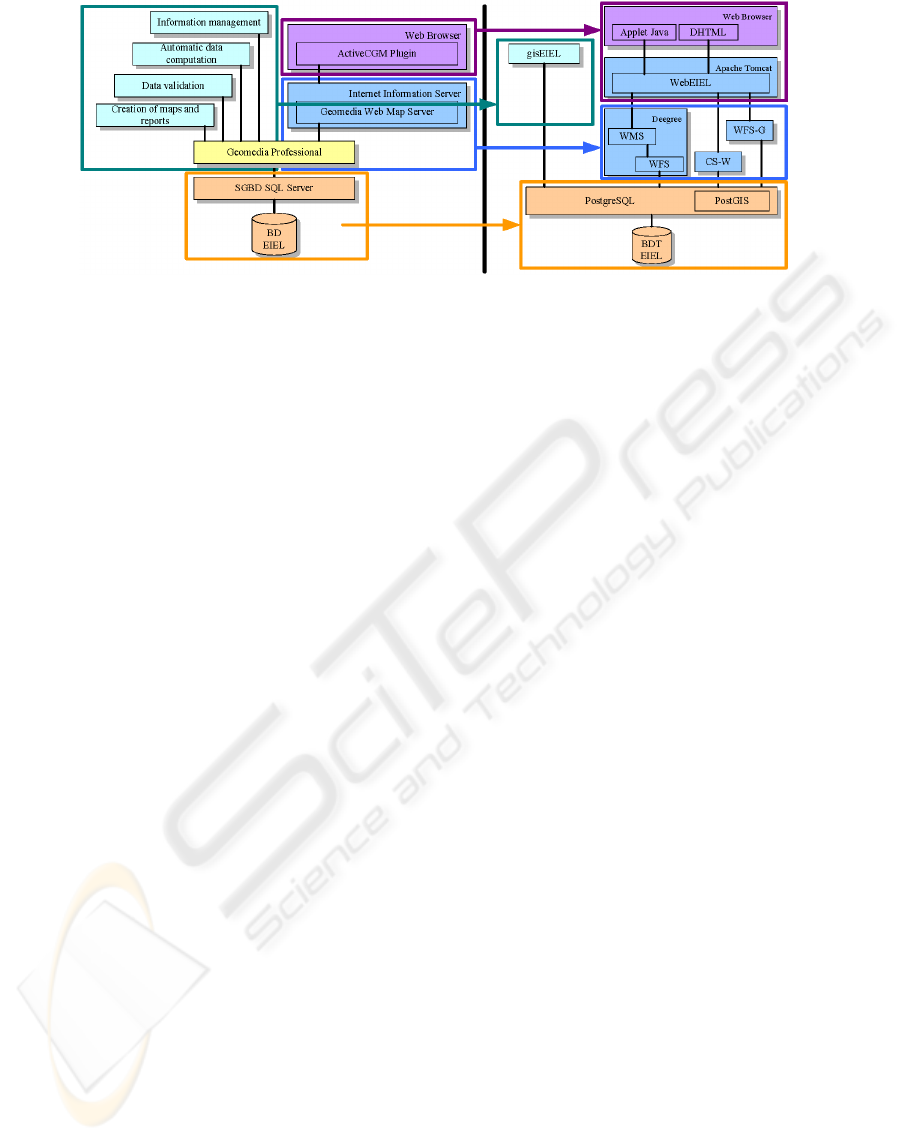
Figure 1: Migration of the architecture from proprietary software to open source software.
PostGIS.
The second task of the process was the migration
of the web application (WebEIEL) and the construc-
tion of the ideAC node. The ideAC node includes a
Web Feature Service (OGC, 2005), a Web Map Ser-
vice (OGC, 2006b), a catalog service (OGC, 2007a)
following the ISO19115 standard (ISO/IEC, 2003)
and the Spanish metadata profile (Consejo Superior
Geogr
´
afico, 2005b), and a gazetteer service (OGC,
2008; Consejo Superior Geogr
´
afico, 2005a). Fur-
thermore, the web application was redesigned to use
J2SE technologies in the implementation of the server
side. Finally, the client side user interface was also
redesigned. Instead of displaying the geographic in-
formation using an ActiveX plugin provided by In-
tergraph (Active CGM Plugin), two different user in-
terfaces were developed using a Java applet and dy-
namic HTML. This improves the accessibility of the
application because it does not require an specific web
browser from the user.
The last task of the process was the migration of
the desktop applications for the management of the
information in the system. We left this task for the end
of the process because there was no software com-
ponent fulfilling our requirements at the beginning
of the project. The migration process also allowed
us to integrate in a single application several appli-
cations that were developed in the first phase of the
project, namely: (i) the desktop application for the
management of the information, (ii) the applications
that computed in an automatic way some information,
(iii) the applications for the validation of the informa-
tion in the database, and (iv) the applications to gen-
erate printable maps and reports.
3 WebEIEL AND THE ideAC NODE
The right side of figure 1 shows the architecture of the
ideAC node and the WebEIEL application. The bot-
tom part of the figure shows the database of the EIEL
of A Coru
˜
na. The information collected consists only
of vector-based geographic features, that is, no cover-
ages are needed for the information in the data model.
Therefore, the only requirement on the database man-
agement system (DBMS) is to conform to the Sim-
ple Features Specification for SQL standard (OGC,
2006a) proposed by the OGC and ISO. In our case,
we have chosen PostgreSQL (PostgreSQL Global De-
velopment Group, 2008) with the extension module
PostGIS (Refractions Research, 2008) for the repre-
sentation of the geographic information. The main
reason for this decision is that PostGIS is more mature
in terms of the implementation of the SFS standard.
For instance, all the spatial operators proposed by
the standard are completely implemented in PostGIS
whereas other database management systems, such as
MySQL (MySQL AB, 2008), implement these oper-
ations using the bounding box of the geographic fea-
tures. This functionality was considered more impor-
tant than the fact that PostGIS is slightly slower than
other alternatives.
The following level of the architecture is com-
posed by the services of the ideAC node: the Web
Feature Service (WFS), the catalog and metadata ser-
vice (CS-W), the gazetteer service (WFS-G) and the
Web Map Service (WMS). The Web Feature Ser-
vice (OGC, 2005) is in charge of serving the geo-
graphic information in the database encoded using
GML (OGC, 2007b). This file format is an XML
application for the representation of geographic in-
formation. By using this service, any client appli-
cation can retrieve the information in the database in
a format that preserves the identity and the alphanu-
meric information associated to each geographic fea-
GISEIEL: AN OPEN SOURCE GIS FOR TERRITORIAL MANAGEMENT
179

ture. Deegree (lat/lon GmbH, 2008) was used for
the implementation of this service because of its ef-
ficiency even though the configuration of Deegree is
very complex.
The catalog and metadata service allows the users
to query and discover the information that is available
in the node, the way in which the information in the
node is related to each other, and all the additional
information that can be assigned to each information
element following the ISO 19115 standard (ISO/IEC,
2003). We implemented this service from scratch
because no existing implementation fulfilled our re-
quirements.
Regarding the gazetteer, we also had to ana-
lyze, design and implement a service following the
Gazetteer Service for WFS specification (OGC, 2008)
defined by the OGC and the definition of the Span-
ish Gazetteer Model (Consejo Superior Geogr
´
afico,
2005a) proposed by the Spanish National Geographic
Institute. The service was designed as a set of inde-
pendent modules that enable reusability.
The last service of the ideAC node is a Web Map
Service (OGC, 2006b). This service is used to pro-
duce cartography from the geographic information
stored in the system. In this case, the result of a query
is a map with the information requested encoded us-
ing an image format using the visualization styles re-
quested. The identity of each individual element and
the alphanumeric information is lost in the process.
Therefore, the result of this service can only be used
to display cartography but not to retrieve the original
information. We also used Deegree (lat/lon GmbH,
2008) as a basis for the implementation of this ser-
vice.
The topmost layer of the architecture is formed
by the application WebEIEL. This application is in
charge of providing a user-friendly interface to query
and visualize the geographic information, the meta-
data catalog, and the gazetteer. We decided to offer
two different versions of the user interface targeted at
two different user types. The first type of user inter-
face was designed for advanced users. Its main char-
acteristic is that it works in a very similar way to a
desktop GIS visualization tool. This user interface
uses active vectorial maps encoded using the SVG file
format (World Wide Web Consortium (W3C), 2003)
and the visualization is performed by a Java applet.
The main advantage of this user interface is that it can
provide many more functionality than a pure web ap-
plication. Moreover, the user interaction is bigger and
the quality of the maps is higher because they are in a
vector-based format. The main drawback is that this
user interface requires a higher knowledge level from
the user because the Java virtual machine must be in-
stalled in the computer and its learning curve is more
steep. Furthermore, the application needs more time
to start and the information requires a longer time to
load.
The second type of user interface was designed for
common users whose only interest is visualizing the
geographic information. This user interface is more
simple because it uses images to display the cartogra-
phy and it is implemented using only dynamic HTML
and JavaScript. Therefore, it can be used in any web
browser without having to install any additional soft-
ware. Hence, it is the most suitable for non-expert
users in GIS applications.
We designed and implemented most of WebEIEL
from scratch. The only third-party component that we
used is MapBuilder (Community MapBuilder, 2008)
as a basis for the user interface based on dynamic
HTML and JavaScript.
4 gisEIEL
gisEIEL is the desktop application used by the staff at
the provincial government for querying, visualizing
and correcting the information in the database. Fur-
thermore, it is also used by the surveying teams to up-
date the information of the survey every year. There-
fore, the application is used by around ten people in
the provincial government and around twenty simul-
taneous users in the university. Figure 2 shows the
methodology that is followed by the surveying teams
and the provincial government when the survey is per-
formed using gisEIEL. The first step consists in creat-
ing and updating the information in the database us-
ing the digitalization tools. Then, the modules that
perform the automatic computation of the informa-
tion are used. After that, the validation task is per-
formed and, depending on the result, the surveying
teams may have to update or create new information
(if there were errors), or the workflow may advance
and proceed to the task of creating the database that
will be sent to the Spanish government. This modules
are described in more detail below.
gisEIEL allows the user to visualize the informa-
tion in the database by means of map windows where
the user can also edit the geographic and alphanu-
meric information of the different data layers. The
application provides tools for the visualization, local-
ization and edition of the geographic features as well
as tools for printing maps and reports. gisEIEL also
provides functionality for the analysis of the informa-
tion, the validation of the data and the generation of
the database format required by the Spanish govern-
ment.
ICEIS 2009 - International Conference on Enterprise Information Systems
180
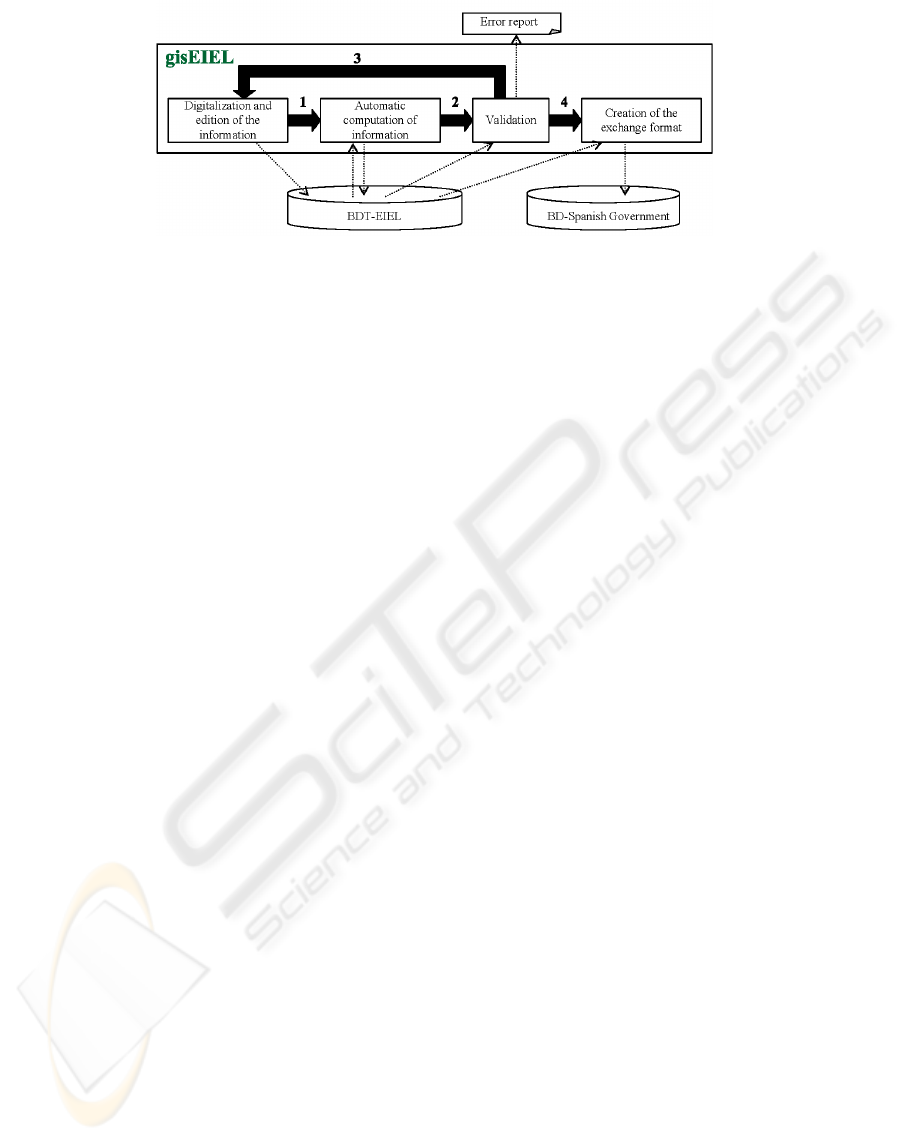
Figure 2: Survey methodology using gisEIEL.
The basis of the application is gvSIG 1.0 (Gen-
eralitat Valenciana, 2008), which is an open source
GIS application developed by the regional govern-
ment of Valencia, in Spain. The reason for choos-
ing this software is that it was the only one in 2007
that fulfilled the requirements of gisEIEL, namely: (i)
reading and writing from database management sys-
tems using the Simple Features Specification for SQL
standard (SFS), (ii) visualizing geographic informa-
tion using different coordinate systems, (iii) support-
ing the edition of geographic information and (iv) in-
cluding a Web Feature Service (WFS) and a Web Map
Service (WMS) client.
The functionality provided by gvSIG was ex-
tended to adapt it to the specific requirements of the
users of gisEIEL. First, a user authentication mod-
ule was implemented that defines roles, permissions
for each role and users associated to each role. This
allows to control the operations that each individual
user can perform on the system. Another improve-
ment is that the data catalog was used to ease the way
the users load the information. The usual way of load-
ing information in gvSIG implies that the user has to
set up the connection, to choose the source table and
to select the columns in the table. However, in gi-
sEIEL, the information in the catalog (maps and lay-
ers) is presented to the user who can load a complex
map with a single mouse click. Furthermore, gisEIEL
controls the amount of information that the user re-
quests from the database. The application forces the
user to work at a municipality level, that is, when
the user starts the application, he/she selects a mu-
nicipality to work with. Later on, gisEIEL filters all
the information and displays only the information re-
lated to that municipality. This makes the applica-
tion faster because the amount of information that is
loaded is limited and, furthermore, it does not over-
load the database server nor the network. However,
if the user wants to work with more than one munic-
ipality at the time, he/she can choose more than one
municipality. This eases the task of connecting the ge-
ographic information in the municipality boundaries.
Regarding the digitalization of geographic infor-
mation, we have developed several tools in addition to
those provided by gvSIG. gisEIEL supports two types
of digitalization according to the type of geographic
feature: simple and complex digitalization. In the case
of simple digitalization, the user only has to draw a
single geometry of a specific geometry type (point,
line or polygon). In the case of complex digitaliza-
tion, the user has to draw a set of geometries for a sin-
gle feature. For instance, for a road section, the user
has to draw a polygon for the surface of the road and
a line for the middle line. In both cases, gisEIEL con-
trols the workflow and ensures that the correct type of
geometry is provided by the user. gisEIEL also pro-
vides many new tools to modify the geographic infor-
mation stored in the database. For instance, there is a
tool in gisEIEL to digitalize a small portion of a given
geographic feature, a tool for moving and inserting
vertices in a geographic feature, and a tool for split-
ting geographic features. With respect to geographic
feature validation, gisEIEL can also check whether
the geographic feature drawn by the user fulfils cer-
tain restrictions in order to ensure the quality of the
information. These checks are used, for instance, to
ensure that a given equipment (e.g: a school) is drawn
within the correspondent municipality and not outside
the limits, or to ensure that the water network or the
road network are connected and there are no dangling
nodes or surfaces. Finally, we have also improved the
snapping tools of gvSIG. We have defined three new
types of snapping: snap to a vertex, snap to a line seg-
ment, and snap to a polyline.
Finally, considering that some of the information
in the survey can be derived from the raw data in-
serted by the surveying teams, gisEIEL provides func-
tionality to automatically compute this information.
For instance, the survey requires the teams to spec-
ify the elements of the water network that give ser-
vice to each population entity. That is, for each pop-
ulation entity the user has to specify the water pipes,
GISEIEL: AN OPEN SOURCE GIS FOR TERRITORIAL MANAGEMENT
181

water tanks, treatment plants, water catchments and
all the other elements that provide a service to the
entity. Instead of associating manually this informa-
tion, gisEIEL provides functionality to perform this
task automatically creating a graph for the water net-
work and using graph exploring algorithms. Another
automatic computation that gisEIEL includes are al-
gorithms to compute information from the data stored
in the database using spatial analysis. For example,
it includes algorithms to compute the populated areas
with deficit of street lights, estimations of waste pro-
duction, or milestones.
5 CONCLUSIONS AND FUTURE
WORK
We have described in this paper the open source geo-
graphic information system developed by the provin-
cial geovernment of a Coru
˜
na and the Database Lab-
oratory of the University of A Coru
˜
na. We have de-
scribed the migration process from the previous GIS
based on proprietary software to the current system
based on open source software. We have also de-
scribed the main applications of the system: WebEIEL
and the ideAC node, the web applications for publish-
ing the information in the Internet, and gisEIEL, the
desktop application for querying and updating the in-
formation in the database. We have also presented the
current effort to distribute the software and the infor-
mation between the municipalities of the province.
Our work is not finished yet. We have a plan
for the following years that includes the following
tasks. First, we plan on including the information
from previous surveys. There is historical data start-
ing in 1988. The database includes only the current
state of the survey. We plan on importing the histori-
cal data and providing tools for querying and analyz-
ing this information. Furthermore, we must design
and implement a method to store the future modifi-
cations to the database. This implies storing historic
versions of the geographic features when the user up-
dates and commits the change. Moreover, the current
version of gisEIEL distributes the information but it
is not prepared to recover the information updated by
the municipalities. We plan on designing a method-
ology to include the information modified by the mu-
nicipalities in the survey, and thus, decentralize the
task of surveying. Finally, gisEIEL is a great tool for
the municipalities to query the information in the sur-
vey, but it does not provide any tool to perform their
daily tasks. We plan on including tool to manage the
processes of urban planning, licenses, demography,
taxes, and many other municipal management tasks.
REFERENCES
Brisaboa, N. R., Cotelo, J. A., Fari
˜
na, A., Luaces, M. R.,
Param
´
a, J. R., and Viqueira, J. R. (2007). Collecting
and publishing massive geographic data. Software -
Practice and Experience, 37(12):1319–1348.
Community MapBuilder (2008). Web Portal. http://com
munitymapbuilder.org/.
Consejo Superior Geogr
´
afico (2005a). Mod-
elo de nomencl
´
ator de espa
˜
na v1.0.
http://www.idee.es/resources/ recomenda-
cionesCSG/Propuesta MNE v1.0.pdf.
Consejo Superior Geogr
´
afico (2005b). Ncleo Espa
˜
nol de
Metadatos. http://www.idee.es/resources/recomenda-
cionesCSG/NEM.pdf.
Deputaci
´
on Provincial da Coru
˜
na (2008). WebEIEL.
http://www.dicoruna.es/webeiel/.
European Commission (2008). INSPIRE Directive.
http://inspire.jrc.ec.europa.eu/.
Generalitat Valenciana (2008). gvSIG. http://www.gvsig.
gva.es/.
Intergraph Corporation (2008). Web Portal. http://www.in-
tergraph.com.
ISO/IEC (2003). Geographic Information - Metadata. In-
ternational Standard 19115.
lat/lon GmbH (2008). Deegree Web Portal.
http://www.deegree.org/.
Microsoft Corporation (2008). Microsoft SQL Server.
http://www.microsoft.com/SQL/.
MySQL AB (2008). Web Portal. http://www.mysql.com/.
OGC (2005). Open Geospatial Consortium. Web
Feature Service (WFS). http://www.opengeospa-
tial.org/standards/wfs.
OGC (2006a). Open Geospatial Consortium. Sim-
ple Features Specification For SQL. Revision 1.1.
http://www.opengeospatial.org/standards/sfs.
OGC (2006b). Open Geospatial Consortium. Web Map
Service (WMS). http://www.opengeospatial.org/stan
dards/wms.
OGC (2007a). Open Geospatial Consortium.
Catalogue Service for the Web (CS-W).
http://www.opengeospatial.org/standards/csw.
OGC (2007b). Open Geospatial Consortium. Geography
Markup Language (GML). http://www.opengeospa-
tial.org/standards/gml.
OGC (2008). Open Geospatial Consortium.
Gazetteer Profile of Web Feafure Service.
http://www.opengeospatial.org/standards/requests/36.
Pedro A. Gonz
´
alez (2004). A Coru
˜
na Province SDI de-
sign. MSc in Geographic Information Dissertation,
City University, London.
PostgreSQL Global Development Group (2008). Post-
greSQL Web Portal. http://www.postgresql.org.
Refractions Research (2008). PostGIS Web Portal.
http://postgis.refractions.net.
World Wide Web Consortium (W3C) (2003). Scalable Vec-
tor Graphics (SVG). http://www.w3.org/TR/SVG11/.
ICEIS 2009 - International Conference on Enterprise Information Systems
182
