
ESTIMATING GREENHOUSE GAS EMISSIONS USING
COMPUTATIONAL INTELLIGENCE
Joaquim Augusto Pinto Rodrigues, Luiz Biondi Neto, Pedro Henrique Gouvêa Coelho
State University of Rio de Janeiro, FEN/DETEL, R. S. Francisco Xavier, 524/Sala 5006E, Maracanã, RJ, 20550-900, Brazil
João Carlos Correia Baptista Soares de Mello
Fluminense Federal University,Production Eng. Dep., R. Passo da Pátria, 156, S. Domingos, Niteroi, RJ, 24210-240, Brazil
Keywords: Computational Intelligence, Neuro-Fuzzy Systems, Greenhouse Gas Emissions.
Abstract: This work proposes a Neuro-Fuzzy Intelligent System – ANFIS (Adaptive Network based Fuzzy Inference
System) for the annual forecast of greenhouse gases emissions (GHG) into the atmosphere. The purpose of
this work is to apply a Neuro-Fuzzy System for annual GHG forecasting based on existing emissions data
including the last 37 years in Brazil. Such emissions concern tCO
2
(tons of carbon dioxide) resulting from
fossil fuels consumption for energetic purposes, as well as those related to changes in the use of land,
obtained from deforestation indexes. Economical and population growth index have been considered too.
The system modeling took into account the definition of the input parameters for the forecast of the GHG
measured in terms of tons of CO
2
. Three input variables have been used to estimate the total tCO
2
one year
ahead emissions. The ANFIS Neuro-Fuzzy Intelligent System is a hybrid system that enables learning
capability in a Fuzzy inference system to model non-linear and complex processes in a vague information
environment. The results indicate the Neural-Fuzzy System produces consistent estimates validated by
actual test data.
1 INTRODUCTION
Human activities have produced inadvertent effects
on weather and climate. Adding gases such as
carbon dioxide and methane into the atmosphere has
increased the greenhouse effect and contributed to
global warming by raising the mean temperature of
the Earth by about 0.5°C since the beginning of the
20th century.
More recently, chlorofluorocarbons (CFCs),
which are used as refrigerants and in aerosol
propellants, have been released into the atmosphere,
reducing the amount of ozone worldwide and
causing a thinning of the ozone layer over Antarctica
around October. The potential consequences of these
changes are vast. Global warming may cause sea
level to rise, and the incidence of skin cancer may
increase as a result of the reduction of ozone. In an
effort to prevent such consequences, production of
CFCs has been curtailed and many measures have
been suggested to control emission of greenhouse
gases, including the development of more efficient
engines and the use of alternative energy sources
such as solar energy and wind energy. The purpose
of this paper is to apply Neuro-Fuzzy Systems for
annual greenhouse gases emissions (GHG)
forecasting. GHG estimates in other contexts have
been considered by researchers using statistical
regression and modeling (Ghorbani et alli, 2008),
(Searchinger and Heimlich, 2007). Time series
applications using computational intelligence have
also been considered by the authors ( Biondi et. Alli,
2004). This paper is organized in four sections. The
first section is the present introduction. The second
section describes the used Neuro-Fuzzy Model.
Section three shows results and discussions and the
paper ends with section four depicting results and
future work.
2 ANFIS STRUCTURE
The ANFIS (Adaptive Network Based Fuzzy
Inference System) structure is a Fuzzy inference
248
Augusto Pinto Rodrigues J., Biondi Neto L., Henrique Gouvêa Coelho P. and Correia Baptista Soares de Mello J. (2009).
ESTIMATING GREENHOUSE GAS EMISSIONS USING COMPUTATIONAL INTELLIGENCE.
In Proceedings of the 11th International Conference on Enterprise Information Systems - Artificial Intelligence and Decision Support Systems, pages
248-250
DOI: 10.5220/0002014402480250
Copyright
c
SciTePress
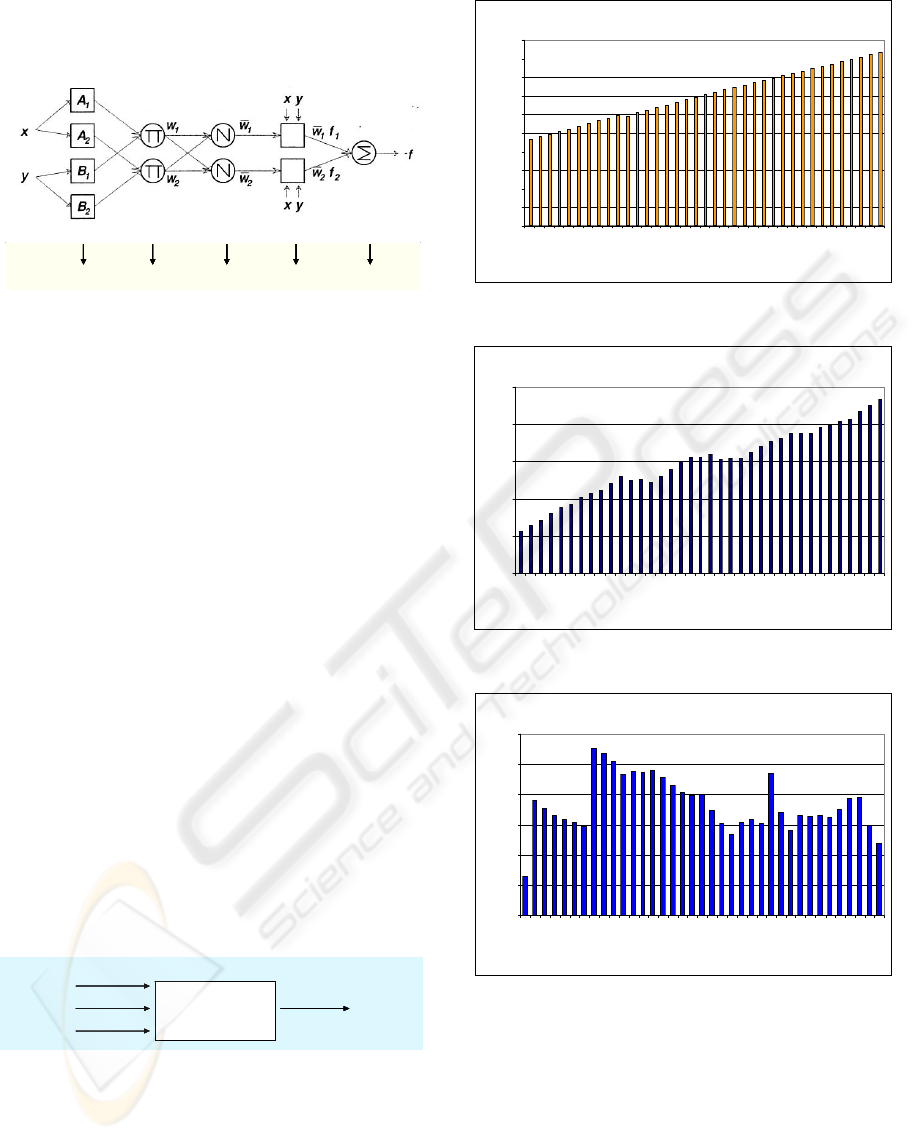
system (Jang et alli, 1997), (Rutkowski,2004) . The
ANFI structure is depicted in Figure 1.
Camada 1 Camada 3 Camada 4 Camada 5Camada 2Camada 1 Camada 3 Camada 4 Camada 5Camada 2Camada 1 Camada 3 Camada 4 Camada 5Camada 2
Layer 1 Layer 3 Layer 4 Layer 5Layer 2
Camada 1 Camada 3 Camada 4 Camada 5Camada 2Camada 1 Camada 3 Camada 4 Camada 5Camada 2Camada 1 Camada 3 Camada 4 Camada 5Camada 2Camada 1 Camada 3 Camada 4 Camada 5Camada 2Camada 1 Camada 3 Camada 4 Camada 5Camada 2Camada 1 Camada 3 Camada 4 Camada 5Camada 2
Layer 1 Layer 3 Layer 4 Layer 5Layer 2
Figure 1: ANFI Structure.
The ANFI structure comprises five layers where
layer one and four include adaptive nodes. The first
layer nodes concern fuzzy sets related to the input
variables whose outputs are membership functions.
Layer two nodes are not adaptive and their task is to
perform a normalization process which is part of a
defuzzification procedure. Layer four leads to layer
five that evaluates the system output including the
final defuzzification in connection with layers 3 and
4. Details of the ANSI system can be found in (Jang
et alli, 1997).
Learning procedures for the ANFI structure
involve the parameters optimization of the adaptive
nodes in layers one and four. The optimization
procedure uses usually deepest descent gradient
techniques (in connection with backpropagation
techniques Jang et alli, 1997). Figure 2 depicts the
ANFI structure used in this paper where the inputs
are Var_1 : total emission at time t-1; Var_2 : GDP
(Gross Domestic Product) at time t; Var_3 :
Population at time t. The output is variable is the
total emission at time t. For validation purposes,
20% of the available data was set apart for testing. In
other words the system was trained with 80 % of the
available data.
Sistema
Neuro-Fuzzy
Var_1
Var_2
Var_3
Saída
Sistema
Neuro-Fuzzy
Var_1
Var_2
Var_3
Saída
Sistema
Neuro-Fuzzy
Var_1
Var_2
Var_3
Output
Neuro - Fuzzy
Var_1
Var_2
Var_3
ANFIS
Sistema
Neuro-Fuzzy
Var_1
Var_2
Var_3
Saída
Sistema
Neuro-Fuzzy
Var_1
Var_2
Var_3
Saída
Sistema
Neuro-Fuzzy
Var_1
Var_2
Var_3
Saída
Sistema
Neuro-Fuzzy
Var_1
Var_2
Var_3
Saída
Sistema
Neuro-Fuzzy
Var_1
Var_2
Var_3
Output
Neuro - Fuzzy
Var_1
Var_2
Var_3
ANFIS
Figure 2: ANFI Structure Configuration.
Figure 3, 4 and 5 shows Population data, GDP data,
and total emission data used in the ANSI prediction
scheme. (Rodrigues, 2008).
Population Evolution
0
20000000
40000000
60000000
80000000
100000000
120000000
140000000
160000000
180000000
200000000
1970
1972
1974
1976
1978
1980
1982
1984
1986
1988
1990
1992
1994
1996
1998
2000
2002
2004
2006
Year
People
Figure 3: Population Evolution Data.
GDP Evolution
0
500000
1000000
1500000
2000000
2500000
1970
1972
1974
1976
1978
1980
1982
1984
1986
1988
1990
1992
1994
1996
1998
2000
2002
2004
2006
Year
R$
Figure 4: GDP Evolution Data.
Emission/R$ Evolution Data
0,00
100,00
200,00
300,00
400,00
500,00
600,00
1970
1972
1974
1976
1978
1980
1982
1984
1986
1988
1990
1992
1994
1996
1998
2000
2002
2004
2006
Yea r
tCO2/R$
Figure 5: Emission/R$ Evolution Data.
3 RESULTS
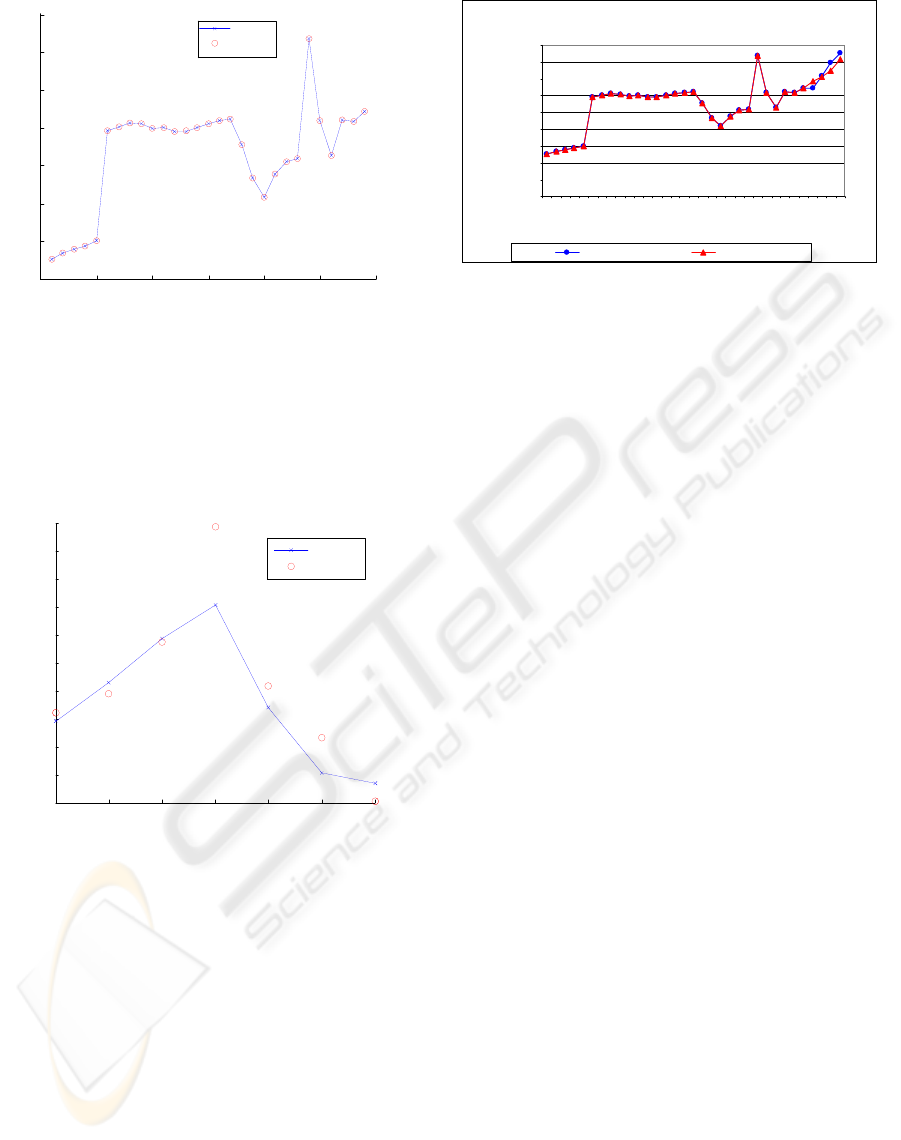
Figure 6 shows the results comparing the trained
data with ANFI estimated data.
ESTIMATING GREENHOUSE GAS EMISSIONS USING COMPUTATIONAL INTELLIGENCE
249
0 5 10 15 20 25 30
2
3
4
5
6
7
8
9
x 10
8
Real x Estimated - Training
Value
Real
Estimated
0 5 10 15 20 25 30
2
3
4
5
6
7
8
9
x 10
8
Real x Estimated - Training
Value
Real
Estimated
Figure 6: Trained x Estimated Data.
Figure 7 compares the ANFI estimates with the
actual data for the validation set. Remember that the
validation set is composed of data not used in the
training of the ANSI structure. One can see an
agreement concerning estimates and data.
1 2 3 4 5 6 7
5
5.5
6
6.5
7
7.5
8
8.5
9
9.5
10
x 10
8
Real x Estimated – Validation Set
Value
Real
Estimated
1 2 3 4 5 6 7
5
5.5
6
6.5
7
7.5
8
8.5
9
9.5
10
x 10
8
Real x Estimated – Validation Set
Value
Real
Estimated
Figure 7: Validation Set x Estimated Data.
The average error for the validation set was about
7%. Figure 8 shows estimates comparison with data
for all data i.e. training and validating set in order to
give a better perspective of the whole estimation
process.
Train and Validation Data x Estimated Data
0,00
100000000,00
200000000,00
300000000,00
400000000,00
500000000,00
600000000,00
700000000,00
800000000,00
900000000,00
1 3 5 7 9 1113 15 171921232527293133
Yae r
tCO2
Real Estimated
Figure 8: Trained and Validation Data x Estimated Data.
4 CONCLUSIONS
This paper applied a Neuro-Fuzzy approach for the
estimation of greenhouse gas emissions. An ANFI
structure was used whose inputs were GNP,
Population and one step back emissions. Average
errors were around 7 % for untrained data and the
estimated emissions agreed with the used trained
data. Future work concerns using data relating other
type of emissions not considered in the present
work.
REFERENCES
Ghorbani, M., Koochecki, A. R., 2008. Estimating the
Greenhouse Gases Emission and the Most Important
Factors in Dairy Farms (Case Study Iran). In Journal
of Applied Sciences 8 (23):4468-4471.
Searchinger, T. D., Heimlich, R., 2007. Estimating
Greenhouse Gas Emissions From Soy-Based Biodiesel
When Factoring in Emissions From Land Use Change.
In Technical Report, Center for Transportation
Research, Illinois.
Biondi Neto, L., Coelho, P. H. G., Velloso, M. L. F.,
Mello, J. C. C. B. S. de, Angulo Meza, L., 2004.
Monthly Flow Estimation using Elman Neural
Networks. In 6th International Conference on
Enterprise Information Systems, 2004, Porto, Portugal.
INSTICC Press.
Jang, J. S. R., Sun, C. T., Mizutani, E., 1997. Neuro-Fuzzy
and Soft Computing. Prentice Hall.
Rodrigues, J. A. P., 2008. Intelligent System for Annual
Greenhouse Gas Emissions Forecast. In M.Sc.
Dissertation, State University of Rio de Janeiro-
Brazil, in Portuguese.
Rutkowski, L., 2004. Flexible Neuro-Fuzzy Systems:
Structures, Learning and Performance Evaluation.
Springer.
ICEIS 2009 - International Conference on Enterprise Information Systems
250
