
AN EFFECTIVE PROCESS MODELLING TECHNIQUE
Nadja Damij
Faculty of Information Studies, Sevno 13, pp 299, 8000 Novo Mesto, Slovenia
Keywords: Modelling technique, Activity Table, Property Table.
Abstract: This paper discusses the problem of process modelling and aims to introduce a simple technique called the
activity table to find a better solution for the problem mentioned. The activity table is a technique used in
the field of process modelling and improvement. Business process modelling is done by identifying the
business processes and is continued by defining work processes and activities of each chosen business
process. This technique is independent on the analyst ans his/her experience. It requires that each identified
must be connected to its resource and its successor activity and in this manner contribute a great deal in
developing a process model, which represents a true reflection to actual business process. The problem of
conducting a surgery is used as an example to test the technique.
1 INTRODUCTION
Business process modelling is a complex and
difficult problem. A process model, which
represents a true reflection of the business process
discussed, is essential for carrying out business
process improvement and information system
development successfully.
There are many methods and techniques which
cover the field of business process modelling. We
are looking for a technique, which is independent
from the analyst and his/her experience.
The aim of this work is to represent a new
modelling technique called activity table to develop
a process model which truly represents the original
business process.
In Section 2, the problem of business process
modelling is discussed, different techniques and
approaches which deal with this field are mentioned,
and the studies of a number of researchers are
addressed.
In Section 3, activity table technique is
introduced. The activity table enable us to model a
process by linking its activities to their resources
(performers), which contribute a great deal in
identifying them as they occur in the reality and
defining their sequence order.
In Section 4, property table is presented, which
enables us to describe the activities in detail.
The last section contains some useful remarks
and conclusions. The process is used to illustrate the
implementation of the technique.
2 BUSINESS PROCESS
MODELLING
The recent literature offers various definitions of and
the extent of a process or process modelling.
Throughout the last decades, the fields of business
process modelling and consequently business
process renovation have been gaining recognition
and acceptance. The reasons for such evolution are
found in the literature, academic publications and
research studies that deal with the theme, as well as
in the increasing involvement of consultancy and
software development companies. A comparative
study that closely examined 25 methodologies, 72
techniques and 102 tools was conducted (Kettinger
et al., 1997).
Business processes come within our scope in that
they potentially add value to the organisation and as
such are attracting attention (examples given in
Martinez et al. (2001); Aguilar-Saven (2001); Chan
(2002); Hammer (1990); Hammer and Champy
(1993); Davenport and Short (1990) and so forth).
Consequently, business process modelling is on the
increase as only a thorough comprehension of the
business processes within the organisations can lead
to effective, efficient and value-adding systems. It is
the business processes that are the key element when
integrating an enterprise (Aguilar-Saven and
Olhager, 2002). Furthermore, conceptual modelling
of business processes is deployed on a large scale to
facilitate the development of software that supports
298
Damij N. (2009).
AN EFFECTIVE PROCESS MODELLING TECHNIQUE.
In Proceedings of the 11th International Conference on Enterprise Information Systems - Information Systems Analysis and Specification, pages
298-304
DOI: 10.5220/0002154402980304
Copyright
c
SciTePress

the business processes, and to permit the analysis
and re-engineering or improvement of them
(Aguilar-Saven, 2003).
To elaborate on definition of a process referred
to above, the following one is added. A process is
defined as structured, measured sets of activities
designed to produce a specified output for a
particular customer or market (Davenport, 1993).
Hence, a process converts inputs by summing their
value through various activities into outputs. A
business process is a collection of activities that
takes one or more kinds of input and creates an
output that is of a value to the customer (Hammer,
1990). However, other stressed that a business
process is related to the enterprise, as it defines the
way in which the goals of the enterprise are
achieved (Aguilar-Saven, 2003).
The input and output, and the entry and exit
points determine the process boundaries within
which the relationship between the process and its
environment is created through the inputs and
outputs. Besides the inputs and outputs, the process
architecture also includes four other main features:
the flow units, the network of activities and buffers,
the resources, and the information structure
(Anapindi et al., 1999). The flow units are the
temporary entities that flow through diverse
activities in order to exit as a completed output. A
process is described as a network of activities and
buffers through which the flow units have to pass in
order to be transformed from inputs to outputs
(Laguna and Marklund, 2005).
There are many reasons that the field of business
process modelling is still evolving (Armistead and
Rowland (1996); Ackerman et al. (1999)):
Business processes enable a whole and
dynamic overview of an organisation, which is in
contrast to the broken down and static view of
business-functional organisational structure. To
acquire such an overview, groups of dependent
activities are identified, which overlap the borders of
traditional functional organisation, evolve through
time and consequently add value to consumers. This
is opposition to the traditional approach, where
hierarchical and functional departments are
responsible for the execution of a number of small
tasks that may cause delays and interruptions of
process completion (Armistead and Rowland, 1996).
By observing the working of organisation’s
operations through its business processes, the
organisation acquires a better ability to concentrate
on its customers. Such an approach enables
organisations to discover the true demands and
desires of the consumers rather than spending time
dealing with internal matters such as organisational
structure or business rules (Ackerman et al., 1999).
Also, the approach points out the needs for flexible
and responsive mechanisms to efficiently meet the
requirements of ever-changing consumers needs.
As stated earlier, successful business process
modelling depends on the appropriate selection of
available modelling methods, techniques or process
flow analyses. There are many techniques or
analyses used in this field, such as general process
charts, process activity charts, flowcharts, dataflow
diagrams, quality function deployment, the
integrated definition of function modelling, coloured
Petri-nets, object-oriented methods, seven
management and planning tools and so forth.
In this paper, we introduced a simple technique,
which enables the analyst to produce a process
model that represents the reality of the business
process discussed.
3 ACTIVITY TABLE
Business process modelling is a complex and
difficult task. Many times the process model
developed depends on the analyst and his/her
experience. For this reason, we are looking for a
technique, which could produce a process model that
represents a true reflection of reality of the actual
business process and is independent on the analyst
his/her experience.
The activity table is a unique technique for
process modelling and improvement. This is
achieved by identifying business processes of the
organisation and is continued by defining their work
processes and activities. To do that, we have to
conduct interviews with the management at different
levels. The purpose of these interviews is to identify
the organization’s business processes, the work
processes related to each business process, and the
activities related to every work process identified.
The activity table uses the term “entity” to define
a user, group of users or other system of importance
in the organization’s functioning. An entity is any
source of information that is part of the system or is
connected with the system by some interaction.
Therefore, an entity may be internal or external. An
internal entity is inside the system and takes part in
the system’s operation. An external entity is not part
of the system, but it has one or more interactions
with the system (Damij, 2000).
A work process is the lowest-level group activity
within the organisation (Watson, 1994). A work
process is a collection of activities followed in a
AN EFFECTIVE PROCESS MODELLING TECHNIQUE
299

determined order in carrying out distinguishable
work to produce a certain output.
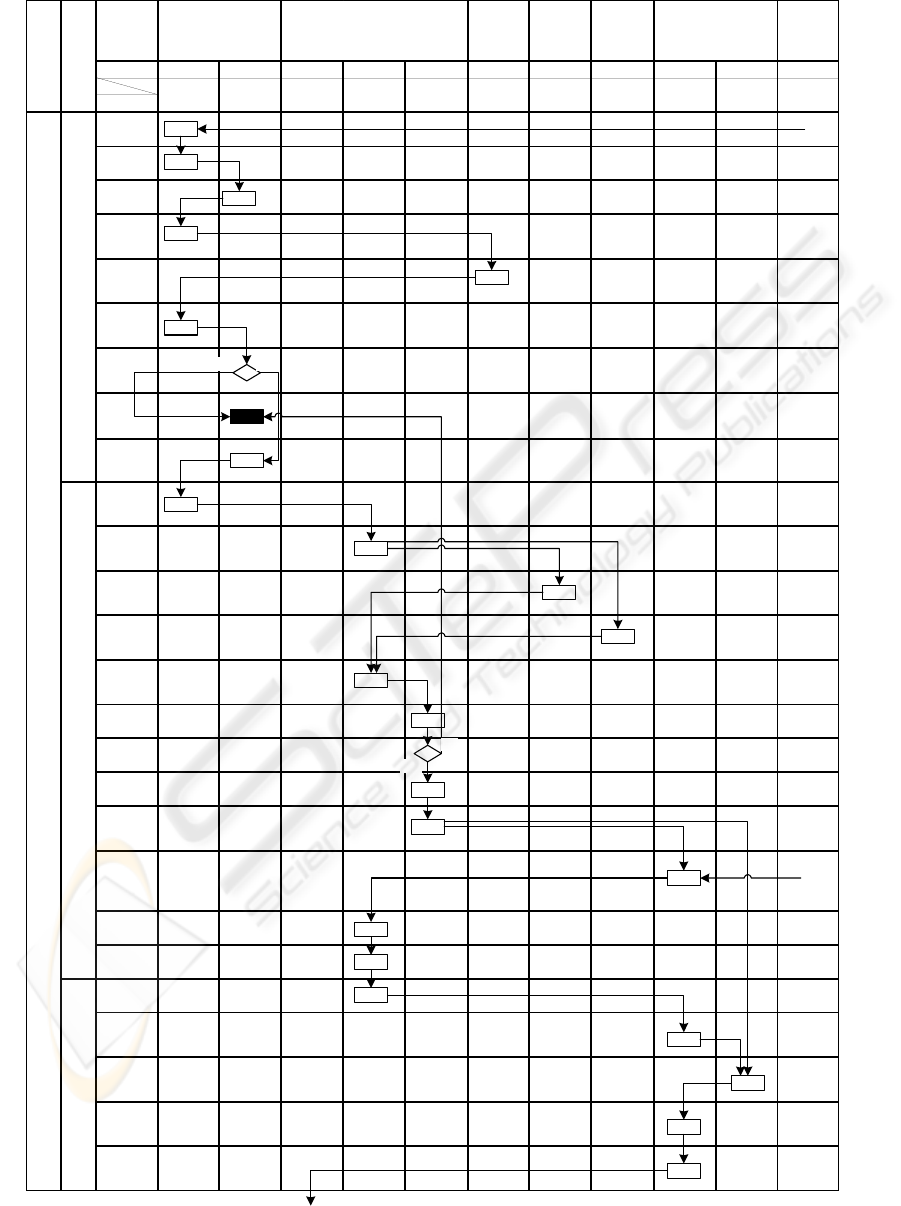
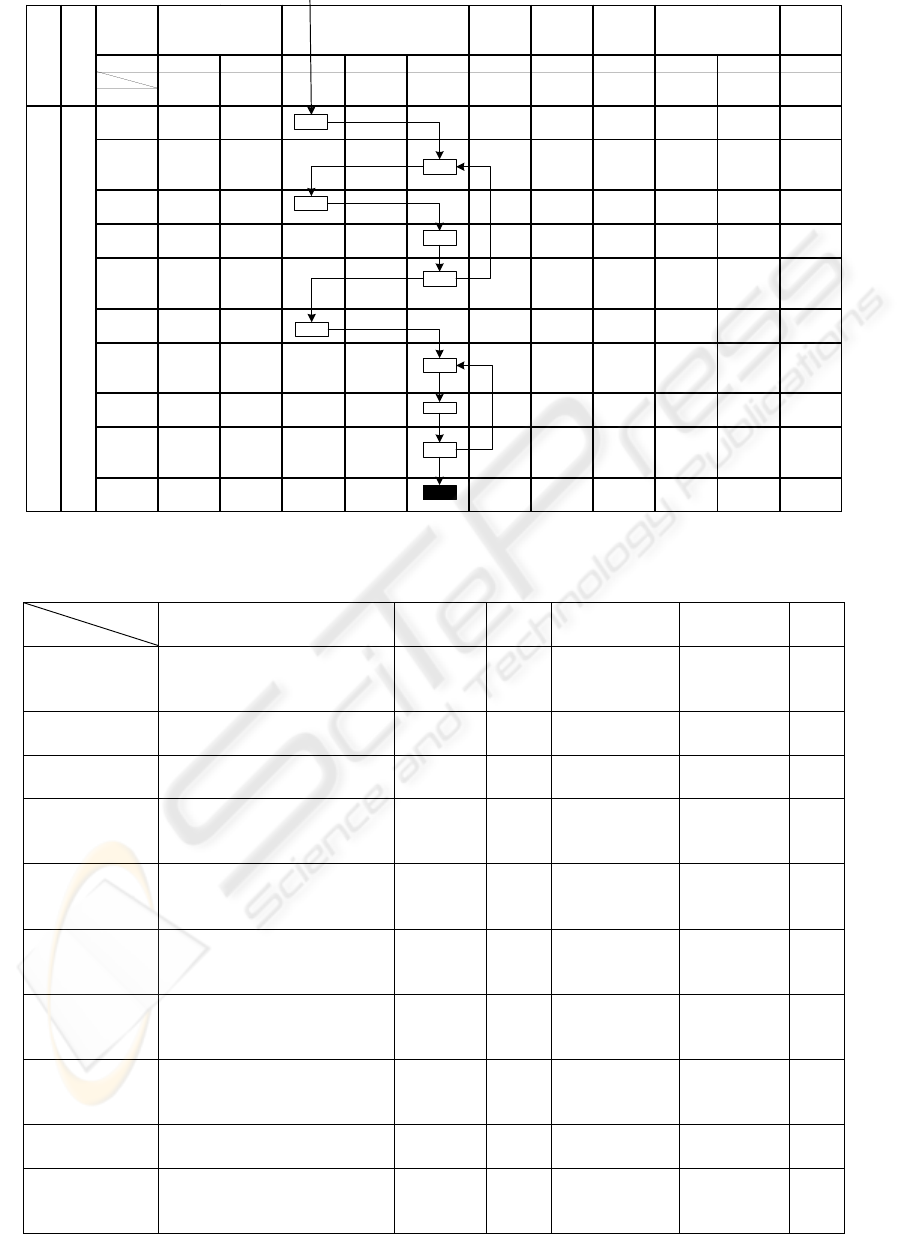
The activity table is organised as follows: the
first column represents business process, the second
column shows work processes, the activities are
listed in the rows of the third column, and the
entities are introduced in the remaining columns of
the table grouped by the departments to which they
belong. Such organisation of the activity table
enables us to create a clear and visible picture of
every business process and its work processes, and
also of each work process and its activities (see
Figure 1).
Each activity occupies one row of the table. A
non-empty square(i,j) links the activity defined in
row i with its source, this is an entity defined in
column j. Developing the activity table is a result of
interviews organised with the internal entities
defined in the columns of the table. In the rows of
the activity table we first register each activity
identified during an interview and then link this
activity with the entities in the columns, which
cooperate in carrying it out. To make the activity
table represent the real world, we link the activities
horizontally and vertically. The purpose of defining
horizontal and vertical connections is to define their
similarity to the real world in which they occur.
Horizontal linkage means that each activity must
be connected with those entities in the columns
which are involved in it. To indicate this, symbols □,
◊, → and ← are used. Symbol □ or ◊ in square(i,j)
indicate that entity(j) is a resource of activity(i),
where j ranges from 1 to the number of internal
entities and i ranges from 1 to the number of
activities. An arrow drawn from square(i,j) to
square(i,k) indicates an input enters activity(i) from
another activity performed by entity(j), where i
ranges from 1 to the number of activities, j and k
rang from 1 to the number of entities, and j≠k.
Vertical linkage is used to define the order in
which the activities are performed. Vertical linkage
is used only in connection with the internal entities.
This is achieved by using arrows ↑ or ↓ to connect
the activities.
An arrow ↑ or ↓ from square(i,j) to square(m,j)
means that activity(i) is a predecessor to activity(m).
Two activities, which are not indicated in the same
column, may be connected by horizontal and vertical
arrows. For example, to connect square(i,j) to
square(i,k), we use two arrows. A horiyontal arrow
to connect square(i,j) to square(i,k) and then a
vertical arrow ↓ to continue from square(i,k) to
square(m,k). This means that activity(i)is a
predecessor to activity(m), which is performed by
entity(k). Of course, these two horizontal and
vertical arrows can be replaced by a diagonal arrow
from square(i,j) to square(m,k).
The main difference between the introduced
technique and others is that this technique requires
linking each activity defined in the rows of the
activity table with its resource (an internal entity)
defined in the columns.
Linking the activities with their resources in a
visual manner cooperates a great deal in identifying
the activities and tracing their order, which leads to
discover the process as it occurs in the reality and
enables us to develop a model that is a true
reflection of the original process.
Surgery: The management of a clinic wished to
improve this process by making it more efficient and
less time consuming.
The process Surgery leads the patient, who needs
to have surgery, through a number of activities in
different departments of the hospital such as
Reception Office, Clinic, Laboratory, X-Ray,
Anesthesia and Surgery Block.
The process “Surgery” was modelled using the
activity table technique, see Figure 1. This shows
that process Surgery consists of 4 work process,
which contain 36 activities.
4 PROPERTY TABLE
As we develop the activity table we simultaneously
develop another table, the property table, which is
very important in describing activities in detail. So,
for each activity inserted in the activity table, we
open a new row in the property table, which shows
detailed information about this activity.
The property table is organized as follows: the
activities are represented in the rows of the table and
the characteristics of the activities are defined in the
columns.
Description.
This column is used to write a short
description of the activity defined in the current row
of the table.
Resource.
This column is used to determine the
entity, which performs of the activity defined in the
current row of the table.
Time.
This column is used to denote that the
activity discussed needs a determined time to be
accomplished. Time may become a very useful
parameter should we wish to use it to improve
business processes.
ICEIS 2009 - International Conference on Enterprise Information Systems
300
Entity 1. 2. 3. 4. 5. 6. 7. 8. 9. 10. 11.
Activity
Reception Office Clinic X-Ray Surgery Block
Surgery
Registration
1. Register
patient
2. Forward
patient
HospitalizationCarrying out Surgery
Business Process
Work Process
Lab Anaesthesia
Nurse Doctor Nurse-In Doctor Doctor
Department
Anaesthetist Surgeon Patient
4. Send
blood
3. Examine
patient
Nurse-Cl Surgeon Technician
5. Test
blood
6. Forward
blood
findings
7. Decide
type of
treatment
8. Issue a
release
report
9. Order
hospitali-
zation
10.Accept
hospitali-
zation order
11. Prepare
examination
order
12.Make x-
ray
examination
13. Create
anaesthetic
report
14. Forward
medical
findings
15. Analyze
findings
16. Decide
on surgery
17. Explain
surgery
18.
Schedule
surgery
19. Get
information
for
an aesthesia
20. Sign
documents
25. Wake
up patient
26. Post-
surgery
recovery
21. Wait for
surgery
22. Prepare
patient
23. Carry
out
an aesthesia
24. Carry
out surgery
YES
NO
YES
NO
Figure 1: Activity table of process Surgery.
AN EFFECTIVE PROCESS MODELLING TECHNIQUE
301
Entity 1. 2. 3. 4. 5. 6. 7. 8. 9. 10. 11.
Activity
36. Issue a
release form
35. Check
recovery
34. Resting
33. Treat
patient
32. Place in
Clinic
31. Check
recovery_IN
30.
Resting_IN
29. Observe
patient
Recov ery
27. Place in
intensive
28. Treat
patient_IN
Anaesthetist Surgeon PatientDoctor
Surgery
Surgery Block
Nurse Doctor Nurse-In Nurse-Cl Surgeon Technician Doctor
Clinic Lab X-Ray Anaesthesia
Business Pro cess
Work Process
Department Reception Office
Figure 1: Activity table of process Surgery (cont.).
Table 1: Property table of process Surgery.
Characteristic
Activity
Description Resource Time Rule
Input/
Output
Cost
1. Register patient
Nurse in Reception Office accepts
patient’s medical card, Doctor’s order,
registers her/him
Nurse
10 min
Check medical
card validity
Doctor’s
order, Medical
card
2. Forward patient Forward the patient and patient’s
documents to the doctor
Nurse 5 min
Medical card
3. Examine patient Doctor in Reception Office examines
the Patient
Doctor 10-20
min
Check patient
medical record
Medical
record
4. Send blood
Nurse in Reception Office takes
patient’s blood sample and send it to
Laboratory
Nurse
10 min
Indicate needed
Blood examina-
tion order
Blood
examination
order
5. Test blood
Technician in Laboratory tests blood
example and sends results back to
reception office
Technician
30 min
Check blood
examination order
Blood exam.
order, Blood
findings
6. Forward blood
Findings
Nurse in Reception Office prints
patient’s blood findings and gives it to
Doctor
Nurse
5 min
Blood
findings
7. Decide type of
treatment
Doctor in Reception Office decides for
a conservative treatment or for surgery
after analyzing blood findings
Doctor
10 min
Check blood
findings
Medical
record, Blood
findings
8. Issue a release
Report
Doctor in Reception Office issues a
release report and prescribes needed
medications
Doctor 20-40
min
Prescribe
medications
Medical
report
9. Order
hospitalization
Doctor in Reception Office asks Nurse
to prepare hospitalization order
Doctor
30 min
Hospitalization
order
10. Accept
hospitalization
Order
Nurse in Clinic accepts hospitalization
order from Nurse in Reception office
to hospitalize the patient
Nurse
30-60
min
Check hospit.
orders & register
the patient
Hospitalization
order
ICEIS 2009 - International Conference on Enterprise Information Systems
302

Rule. This column is used to define when
performance of the activity requires that one or more
rules must be fulfilled. Rule is a precise statement
that defines a constraint, which must be satisfied in
order for a certain activity to be executed.
Input/Output.
This column is used to indicate
which inputs or outputs are connected with the
activity described.
Cost
. This column is the sum of the costs of the
resources needed to accomplish an activity. This
parameter is used to calculate the cost of work and
business processes and therefore is important in
improving business processes.
Developing the activity and property tables is an
iterative process. Some of the interviews have to be
repeated to arrive at a precise understanding of the
user’s work. If anything is misunderstood, then we
have to organize new interviews with the responsible
users until everything is clear.
Surgery. Because of space limitations, only ten
activities defined in the activity table are described
in detail in the property table, Table 1. The values
shown in the column Time in Table 1 are
approximate values obtained from the medical staff.
Unfortunately, we could not get any information
concerning the costs of the listed activities from the
management of the hospital.
5 CONCLUSIONS
The aim of this paper was to introduce a technique,
which enables the analyst to overcome problems of
business process modelling.
Business process modelling is solved
successfully by developing the activity table
technique, which requires that each activity,
identified in the framework of the process, has to be
linked with its resource and its successor activity.
This is achieved by using horizontal and vertical
linkages. Connecting the activities to their
performers (resources) represents a new dimension
in process modelling, which contribute a great deal
in leading the modeller to identify the activities as
the occur in the real world and to develop a process
model that represents a true reflection of reality of
the business process discussed.
Such a model enables us to continue with
business process improvement, which is carried on
by analyzing the activity table. This table could be
divided the table into clear, manageable, and easy to
understand subtables. Analysing is essential in
discovering improvements, removing obstacles,
shortening time, reducing cost, and solving other
problems of the business process discussed.
REFERENCES
Ackerman, F., Walls, L., Meer, R., Boorman, M. (1999).
Taking a Strategic View of BPR to Develop a
Multidisciplinary Framework. Journal of Operational
Research Society, 195-204.
Aguilar-Saven, R. (2001). Business Process Modelling
techniques and tools. Department of Production
Economics, WP291 Linkoping Sweden.
Aguilar-Saven, R. (2003). Business Process Modeling.
Review and Framework. International Journal of
Production Economics, Vol. 90, No. 2, 129–149.
Aguilar-Saven, R., Olhager, J. (2002). Integration of
Product, Process and Functional Orientations.
Principles and a Case Study. Preprints of the
International Conference on Advanced Production
Management Systems, APMS 2002 IFIP The
Netherlands September.
Anapindi, R., Chopra, S., Deshmukh, S. D., van Mieghem,
J.A., Zemel, E. (1999). Managing Business Process
Flows. Upper Saddle River NJ: Pretence Hall.
Armistead, C.G., Rowland, P. (1996). Managing Business
Processes: BPR and Beyond. Chichester John Wiley &
Sons.
Chan, M. (2002). A Framework to Develop an Enterprise
Information Portal for Contract Manufacturing.
International Journal of Production Economics, 75
(1–2), 113–126.
Damij, T. (2000). An Object-Oriented Methodology for
Information Systems Development and Business
Process Reengineering. Journal of Object-Oriented
Programming, Vol. 13, No. 4, 23-34.
Davenport, T.H. (1993). Process Innovation:
Reengineering Work through Information Technology,
Harvard Business School Press, Boston.
Davenport, T.H., Short, J. (1990). The New Industrial
Engineering: Information Technology and Business
Process Redesign. Sloan Management Review, Vol. 31
No. 4, 11–27.
Hammer, M. (1990). Reengineering work: Don’t
automate. Obliterate. Harvard Business Review, Vol.
68 No. 4, 104–112.
Hammer, M., Champy, J. (1993). Reengineering the
Corporation, A Manifesto for Business Revolution.
New York, USA.
Kettinger, W.J., Teng, J.TC., Guha, S. (1997). Business
Process Change: A Study of Methodologies,
Techniques and Tools. MIS Quarterly, Vol. 21, 55-80.
Martinez, M., et al. (2001). Virtual Enterprise –
Organisation, Evolution and Control. International
Journal of Production Economics, 74 (1 – 3), 225–
238.
Laguna, M, Marklund, J. (2005). Business Process
Modeling, Simulation, and Design. Pearson Education
Inc., New Jersey.
Watson H.G. (1994). Business Systems Engineering.
Managing Breakthrough Changes for Productivity and
Profit. John Wiley & Sons, New York.
AN EFFECTIVE PROCESS MODELLING TECHNIQUE
303
