
Reporting Repository: Using Standard Office Software to
Manage Semantic Multidimensional Data Models
Christian Kurze and Peter Gluchowski
Chemnitz University of Technology, Thueringer Weg 7, D-09126 Chemnitz, Germany
Abstract. Implementing a business intelligence solution requires the
appropriate integration of numerous tasks and components. The so-called Data
Track requires three main steps: Dimensional Modeling, Physical Design, and
ETL Design & Development. This paper focuses on the Dimensional Modeling
step and provides a solution for managing multidimensional data models with
standard office tools, namely Microsoft Visio and Access. A real-world project
in the telecommunications industry provides business requirements and is used
in order to prove the solution. We outline the lessons learned and give hints for
further development.
1 Introduction
This paper has been inspired by an industry partner from the telecommunications
industry. They are presently faced with the technical redesign of their data warehouse
solution. One of the main problems is a current implementation of more than 400 data
cubes. Several strategic consulting partners are constantly evolving these cubes, as
well as the underlying core database. This implies that the whole database and cube
structure has to be understood for each new project. Due to the short project
timeframes of approximately three to six months, this is quite impossible. In order to
reduce redundancy and inconsistency, there should be a management of user
requirements on a semantic level, i.e. a management of semantic multidimensional
data models. Please note that we further distinguish conceptual data models into
semantic and logical models: semantic ones represent business requirements whereas
logical ones describe implementation-oriented aspects. For example, business
requirements are modeled using the ADAPT notation (cf. section 4); their logical
representation might be a relational star schema.
To cope with the enterprise-wide initiative, a new department will be established.
This department is responsible for gathering user requirements, check their feasibility,
model the requirements in alignment to already existing structures, and handling the
specified requirements on to the IT department which is responsible for implementing
the new solution. The basic idea behind this approach is to create a so-called
Reporting Repository. This database stores all semantic data objects and associations
between them and thus facilitates analyses on the data models. Questions like “Which
measures are available for the calculation of product turnover?” or “Which cubes are
affected if we change our customer dimension?” can be answered. Furthermore,
Kurze C. and Gluchowski P. (2009).
Reporting Repository: Using Standard Office Software to Manage Semantic Multidimensional Data Models.
In Proceedings of the Joint Workshop on Advanced Technologies and Techniques for Enterprise Information Systems, pages 67-76
DOI: 10.5220/0002174500670076
Copyright
c
SciTePress
precise definitions of measures, dimensions, cubes, etc. are given. The repository will
be the single point of truth for multidimensional data structures within the whole
enterprise.
The remainder of this paper is structured as follows: First, we integrate the case
study into a framework of data warehouse development and outline our research
method. Second, we summarize related work and give a short overview to
multidimensional data modeling. The third part defines the requirements and shows
the implementation of the solution. The last section evaluates our work and gives an
outlook to further developments.
2 Data Warehouse Development and Research Framework
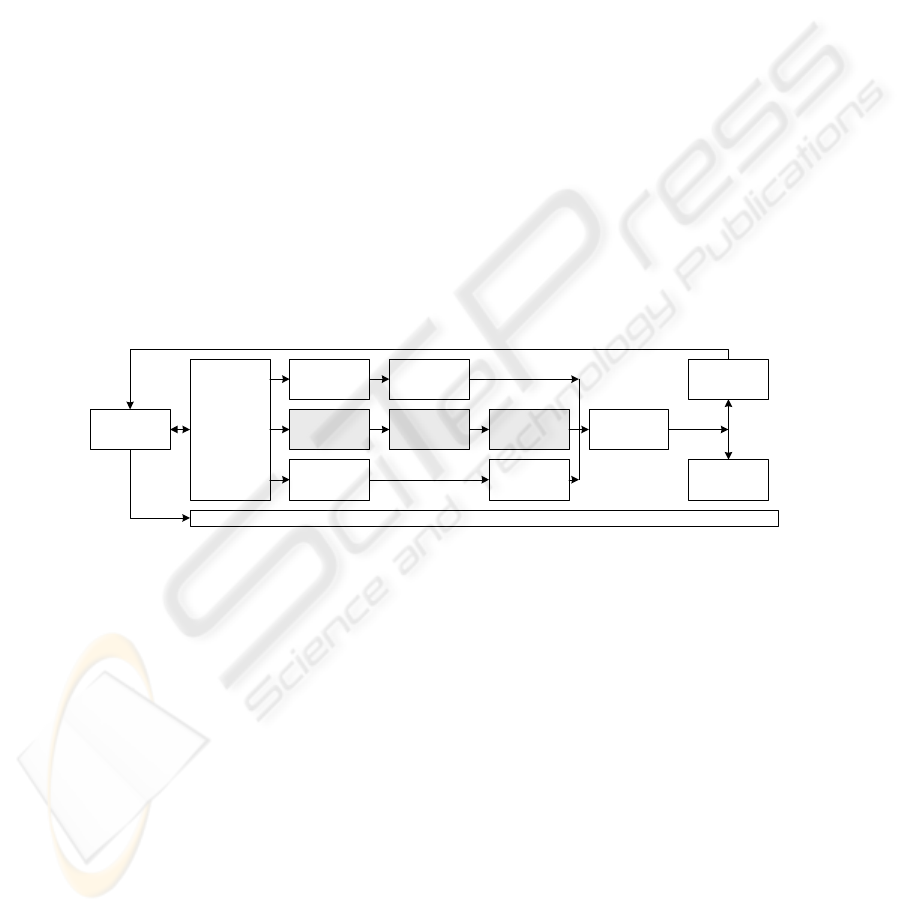
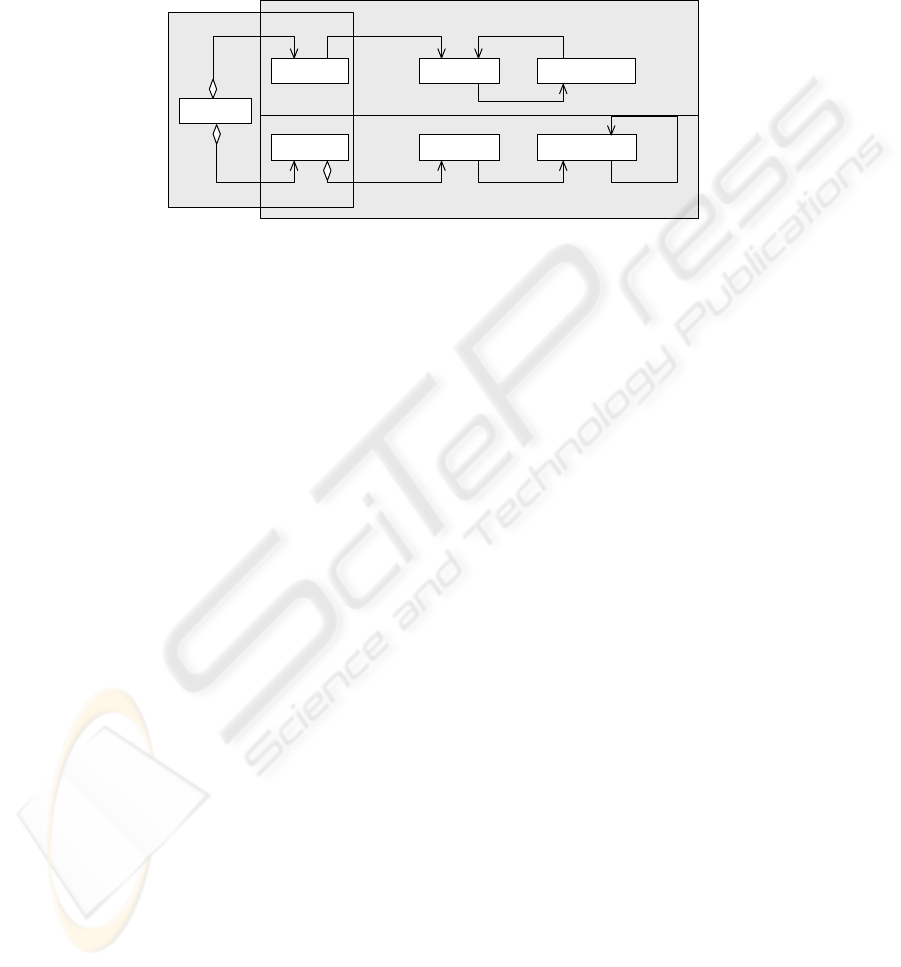
According to [1], one of the most important steps in implementing data warehouse
solutions is to gather the user requirements; the understanding of the requirements
influences almost any lifecycle choice. Subsequent to the definition of the
requirements, there are three parallel task tracks: Technology, Data, and Business
Intelligence Applications. For the remaining part of this paper, the Data Track
consisting of the steps Dimensional Modeling, Physical Design, and ETL Design &
Development, is important (cf. Fig. 1). The focus is put on the first step, Dimensional
Modeling. Within this step, modelers identify dimensions, their granularity, attributes,
and numeric facts.
Business
Requirements
Definition
Technical
Architecture
Design
Dimensional
Modeling
BI
Application
Design
Product Selection
& Installation
Maintenance
ETL
Design &
Development
BI
Application
Development
Development
Growth
Program/ Project
Planning
Program/Project Management
Physical
Design
Fig. 1. Data Warehouse Lifecycle diagram [1].
The benefits of a single integrated metadata repository are characterized as
follows: impact analysis, audit and documentation, and metadata quality management
[1]. An impact analysis helps to identify the impact of making changes to the business
intelligence system. Audit and documentation data are needed in order to do lineage
analyses as the reverse of impact analysis. It allows identifying where an object came
from and what went into its creation. Nevertheless, security data, like access rights,
are important as well. The management of metadata quality is essential for keeping
different metadata repositories in sync. It is a very substantive step as inconsistent
technical or business metadata will lead to false impact or lineage analyses.
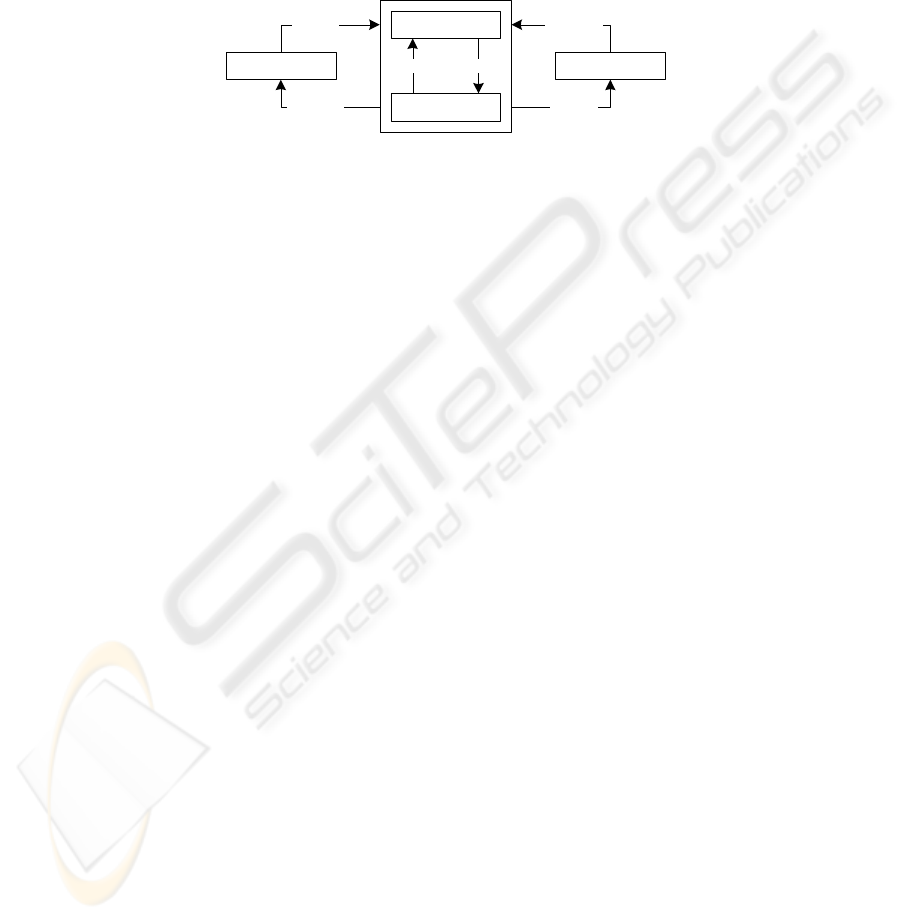
Our research is strongly aligned to the design science research in information
systems [3], [5], and [6]. We further develop an already proposed metamodel for
ADAPT [2] and create a new artifact, the Reporting Repository. The business needs
of our project partner prove our implementation to be relevant. We also contribute to
68
the scientific community by evaluating a metamodel based approach and show its
application.
Due to the fact that the developed software is not the “first” of virtually any set of
instantiation appropriate to the problem domain, we identify a significant
improvement by pointing out the gaps we closed with our repository implementation.
This can be seen as evaluation of the created artifact and will close the loop to further
research needs [5].
Develop/Build
Assess
Justify/Evaluate
Refine
Environment Knowledge Base
Business
Needs
Application Additions
Applicable
Knowledge
Fig. 2. Design science cycles [3], [5], and [6].
3 Related Work
The emphasis in our paper is put on using standard office tools for both the repository
and the graphical interface. This approach provides a solution which is relatively easy
to understand and maintain. For example, users do not have to cope with complex
graph databases.
Conceptual modeling notations for multidimensional data can be categorized into
three clusters: extensions to the Entity-Relationship model, extensions to the UML
and ad hoc models [7]. Examples for extensions of the Entity-Relationship model are
given in [8] and [9]. Neither is able to model dynamic structures, e.g. calculation
hierarchies between measures. Reference [10] serves as an example for UML-based
notations by providing a profile for multidimensional modeling. Both, the
Dimensional Fact Model [11] and ADAPT [12], which we use in our paper, rank
among the ad hoc approaches.
A repository is needed in order to store the metadata along the whole data
warehousing process [1]. The Common Warehouse Metamodel (CWM) of the Object
Management Group (OMG) is a much discussed standard for storing business
intelligence metadata [13]. Version 2 of this standard, the Information Management
Metamodel, should have been published in September 2007, but has not been
published to date [14]. For this reason, we are not concentrating on this standard for
our repository. Nevertheless, there are two general standards for metadata
repositories: Information Resource Dictionary System (IRDS, ISO/IEC 10027) [15]
and the Metadata Registry Standard (ISO/IEC 11179) [16].
A great deal of work has been done to create meta-CASE toolsets for developing
modeling environments for domain specific visual languages. An outstanding work is
outlined in reference [17]. The authors present plenty of related work and created a
toolset which simplifies the development of modeling environments. All models are
persistently saved in an XML format so that they can also be stored in a database.
Other important works include, for example, MetaEdit+ [18], Meta-MOOSE [19],
69
GMF [20], and DSL Tools [21]. Those frameworks often require considerable effort
to be understood and to be used effectively.
4 Modeling Multidimensional Data with ADAPT
Application Design for Analytical Processing Technologies (ADAPT) was first
published in 1996 [22] and was refined in 1998 [12]. Due to its pragmatic roots, there
has not been any formal foundation. A proposal of a metamodel can be found in
reference [2]. Since we intend to give only a brief introduction, the reader is referred
to [2] and [12] for further information about ADAPT. A free-of-charge stencil for
Microsoft Visio is also obtainable [23].
Self
Precedence
Used ByStrict
Precedence
Loose
Precedence
Connector
Dimension
Dimension1
Dimension2
Cube
Hierarchy
Level
{ }
Attribute
{ }
Scope
{ }
Member
Model
(a)
(b)
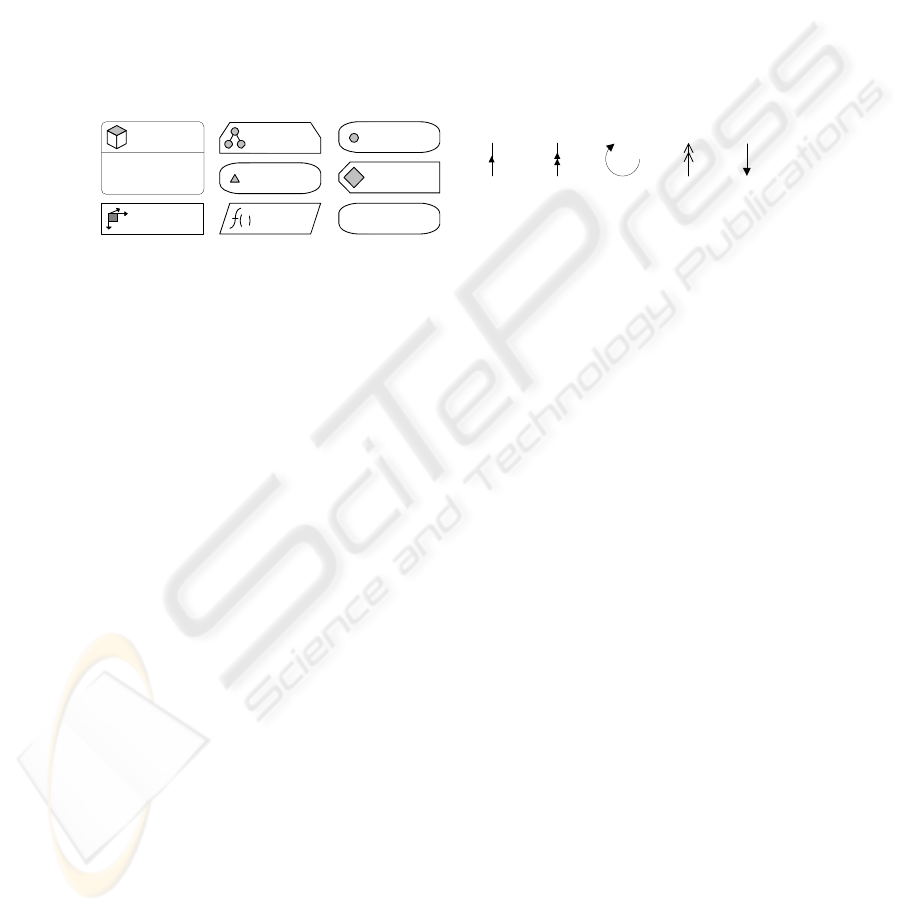
Fig. 3. Basic ADAPT elements (a) and connection symbols (b).
The basic elements of the notation are Hypercube (or Cube for short) and
Dimension. A Dimension represents an axis of a Cube. They can be modeled in detail
by the symbols Hierarchy, Level, Member, Attribute, Scope, and Model. There also
exists a variety of connector symbols depicted in Fig. 3 (b). Loose Precedence, Strict
Precedence, and Self Precedence are intended to express hierarchical or recursive
relationships between hierarchy levels. Used By identifies input parameters for and
dependencies between Models. The Connector denotes all other relationships. The
following modeling convention increases readability and understandability of
ADAPT diagrams. One regular-sized sheet of paper should contain the cubes and
their dimensions. For each dimension there should be another page defining its more
or less complex structure [2], [12].
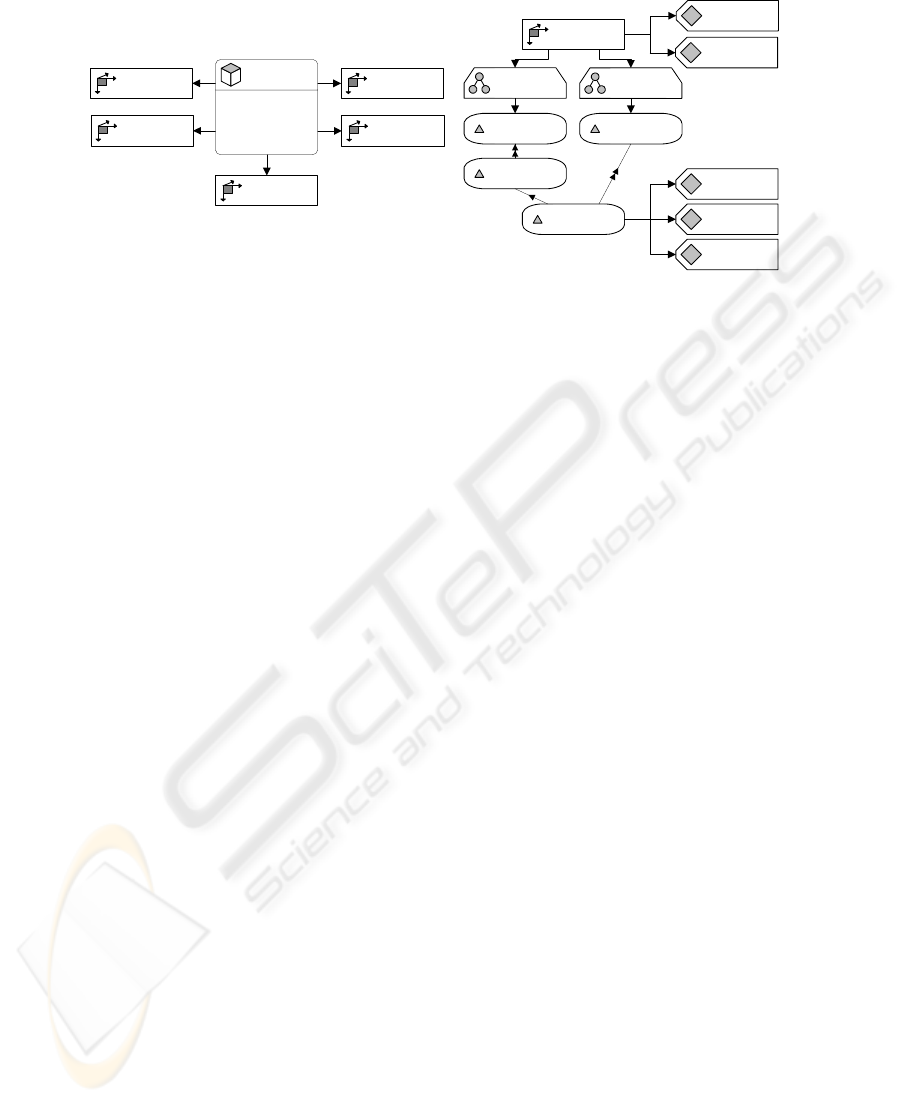
Fig. 4 applies the ADAPT notation to a simple example: (a) shows a sales cube
with five dimensions including a measure dimension. Measures are depicted as
Members of this special dimension. Dependencies can be modeled using the Model
symbol. Part (b) shows a sample product dimension with a parallel hierarchy. The
first one aggregates products into subcategories and categories, the second one into
their suppliers. The attributes connected to the dimension itself apply to each element
on each level of the dimension, i.e. the instances of the different hierarchy levels.
Those attributes connected to the product level are valid for this particular hierarchy
level only. A weight for example, does not make sense for a product category.
70
Product
Category
Supplier
Product
category
{ }
Product
subcategory
{ }
Supplier
{ }
Product
{ }
Description
English
Description
Spanish
Package type
Package size
Weight
Product
Organizational Unit
Customer
Time
Measures
Sales
Organizational
Unit
Customer
Time
Measures
Product
(a)
(b)
Fig. 4. Simple example using ADAPT: a sales cube with five dimensions (a) and the detailed
product dimension (b).
5 User Requirements and Implementation
This section outlines the requirements of our industry partner. We deduce a technical
architecture for realizing these requirements and show how we implemented this
architecture concept.
5.1 Requirements Definition
Since metamodeling is a common approach in implementing Domain Specific
Languages (which ADAPT can be seen as), the requirements will be defined in a
metamodel. Reference [2] was the starting point of our work. Because the given
metamodel did not meet all the requirements of our partner, we had to enhance it by
certain extensions. Due to concealment agreements and space limitations we will
outline only an extract of the metamodel as seen in Fig. 5.
The metamodel’s extract contains seven classes. Cubes represent
multidimensional analysis structures which contain Measures. Measures are
composed to systems of key performance indicators (KPI_Schemata) via
Aggregation Rules. If modeled in a neatly arranged way, one can easily explore
the hierarchical character of complex calculation schemata. The Measures within a
Cube are determined by Dimensions. The Dimension structure is modeled via
Hierarchies and Levels. Stereotypes indicate which connection symbol has to
be used, the navigability addresses the direction in which the arrow heads have to
lead. The distinction between different dimension types (regular dimensions and
measure dimension) has been part of the initial ADAPT notation [22] and is used in
our solution.
Furthermore, we defined four model views assembling the modeling convention in
the ADAPT presentation above: dimensions, systems of performance indicators
(measure dimensions), cubes, and report (report is not shown in Fig. 5). Each instance
of a model view, e.g. the sales cube in Fig. 4 (a) or the product dimension in Fig. 4
71
(b), is modeled on one regular-sized sheet of paper. This should increase readability
and understandability. We also defined several metadata which should be gathered for
each individual modeling element. There are, for example, access rights,
responsibilities, definitions, etc. We categorized them into clusters which will be used
later on for displaying input fields for these metadata.
Cube
Dim e ns io n Hie rar chy
<<connector>>
1..*
1..*
<<connector>>
11..*
Level
<<connector>>
1
1
<<strict precedence>>
+parent
0..1
0..*
KPI Sche m a Aggregation Rule
<<connector>>
1..*
1..*
Measure
<<connector>>
1..*1
<<connector>>
+in 0..*
1..*
<<connector>>
+out1..*
1
(a)
(c)
(b)
Fig. 5. Extract of ADAPT metamodel with model views: cube (a), system of performance
indicators (b), and dimension (c).
For our repository solution, which is an integrated repository for all the semantic
requirements to the data warehouse solution, the requirements align with the aims of
an integrated metadata repository stated in section 2. Our project partner wanted to
undertake impact analyses on a semantic level, audit and (business) user
documentation was given, and the metadata quality should be improved by executing
queries on the repository to check the consistency of the models, for example.
Therefore we needed an open repository which could be easily queried.
Additionally, we were not allowed to install a database server due to security
reasons. There also should not be the necessity for any additional software licenses.
The modelers of our partner enterprise were experienced users of Microsoft Visio and
Access, so we decided to use these two products.
5.2 Architectural Concept
In order to achieve a solution easy to maintain, we tried to keep the architecture of the
Reporting Repository as simple as possible. Fig. 6 outlines the basic thoughts.
The bottom of Fig. 6 shows the structure of our solution within the file system. To
allow access for more than one modeler, we made the folder ReportingRepository
accessible over the enterprise-wide network. In this folder there is the Access
database reportingrepository.mdb, the Visio stencil adapt_rr.vss and folders for the
ADAPT diagrams according to the defined modeling views: cube, dimension,
measure, report. These folders contain the modeled ADAPT diagrams in XML format
(*.vdx).
For conducting impact and lineage analyses, the abstract syntax of a diagram is
needed. Therefore, we only have to save the abstract syntax graph (ASG) in the
repository. Its nodes end edges are defined in the metamodel above. The pictorial
representation, i.e. the layout, remains hidden within the Visio diagram files [4].
Following the ideas of the IRDS standard [15], we also represented the ADAPT
72

metamodel within the database. Because of the four model views, we could not use
the concepts of IRDS. The analysis layer in Microsoft Access contains forms and
additional VBA code which give reasonable answers to questions raised in section 1.
Microsoft Visio Microsoft Access
Stencil
graphical defintion
of modeling elements
VBA code
Modeling Views
ADAPT diagrams
Database
ADAPT
diagrams
Analysis
User-Defined Forms
VBA code
Filesystem
ADAPT
diagrams
Access DatabaseVisio Stencil
cube
dimension
measure
report
Reporting Repository Application
ADAPT
metamodel
Fig. 6. Reporting Repository Architecture.
5.3 Implementation
The creation of the database schema should be automated in the future, since each
adaption of the metamodel requires changes. We performed this step manually. Each
class within the metamodel maps to relational table named after this class as well as
one table for each association named after the classes that are connected with each
other. The tables are connected via foreign key relationships. Additional tables were
created for each metadata cluster outlined within the requirements definition. They
are also connected via foreign key relationships to the particular modeling element
tables. In order to define the metamodel in the database, there are tables listing the
core ADAPT elements and their assignment to relational tables, as well as the model
views in which they may be used. Each association table is also assigned to the model
views. This approach allows automated syntax and consistency checks to keep the
graphical definitions in synch with the database. Additionally, referential integrity is
used to keep the database consistent.
Fig. 7 depicts the database schema for saving the metamodel and its model views.
Via simple queries it is possible to select all ADAPT elements and relationships for a
certain model view. The result is needed in order to check the syntax of a single
model view. For example, Fig. 4 (a) depicts an instance of the model view cube. Only
Cubes, Dimensions, KPI_Schemata and associations between Cube and
Dimension as well as KPI_Schemata are allowed. The Connector has to be
used in each case.
73

ID
IDFromMaster
IDToMaster
IDConnectorMaster
Relation
MD_ADAPTRelationships
ID
MasterName_Stencil
Relation
MD_ADAPTElements
IDElement
IDModelView
MD_ElementsView
IDRelationship
IDModelView
MD_RelationshipsView
IDModelView
ModelViewName
MD_ModelViews
Fig. 7. Database schema for metamodel.
We customized the basic ADAPT Visio stencil provided by the Symmetry
Corporation [23]. Therefore, we removed all unused modeling elements and
introduced new ones as outlined in the requirements definition. Each shape within the
new stencil was given some event handlers. We listen to drop and double-click
events, and customized the context menus. Each time an element is dropped onto the
drawing sheet, a window pops up which allows the selection of an already existing or
the creation of a new element. A double-click opens the metadata window for the
selected item. It contains several tabs which allow the gathering of additional
metadata. The instances of the model views, e.g. (a) and (b) in Fig. 4, are
interconnected via hyperlinks. If a user wants to show the details of the product
dimension connected to the sales cube, they only have to right-click on the dimension
and select the context menu item open definition. Another Visio document containing
the dimension will open.
6 Empirical Evaluation and Further Development
After two months of usage there have been models of about 70 dimensions, two
systems of performance indicators, more than 200 measures, four reports, and 20
cubes. The following paragraphs verify the software artifact provided and outline
further development steps. From a business point of view the following aspects arise:
• Usability and Understandability of Diagrams Due to Model Views. This
requirement has been reached. The implemented Access forms summarize the
model views, i.e. they provide a list of all cubes, reports, dimensions, and measure
dimensions. A link to the graphical definition files is given, too. The
implementation via hyperlinks within the Visio files is easy to use and fast.
• Single Point of Truth for Multidimensional Data Models. A recent project at
our industry partner has shown that this requirement is met. New requirements to
the data warehouse have been evaluated against the already existing models. The
project scope could be reduced since some extensions were not necessary – they
were already included in the current implementation.
• Eliminate Redundancy and Inconsistency within Semantic Data Models. The
repository allows searching in all the provided models. This was not possible
74

before, since the “models” have been available in written texts only. The
additional metadata to each element helps users to easily and quickly understand
the data models.
• Modeling of Security, Especially Access Rights for Users. This requirement
arose during the development of the solution. Unfortunately, ADAPT does not yet
provide security modeling. We solved this issue by additional entries in the
metadata section of each model element.
From a technical point of view, we would like to focus on the following, most
important lessons learned:
• Changes within the Metamodel. Changes in the metamodel resulted in
considerable changes in the source code. It would be much more useful to
implement a generic approach as presented in the related work and to make
extensive use of repository standards. A solution to automatically create the
database structure, Visio stencils and consistency checks would be greatly
appreciated.
• Integrated Syntax Check. Currently, the syntax of the model is checked while
saving the diagram into the database. If the syntax is checked directly after
inserting an element into the drawing area, it might save a great deal of the
modeler’s time. The extensive use of repository standards could be a solution to
this issue.
• Synchronization of Graphical Definition and Abstract Syntax. The separation
between the graphical definitions in Visio files and the abstract syntax in the
database is difficult to maintain. The most common error was the deletion of
model elements in a Visio file but not in the database. A VBA function (accessible
via the context menu) is available, but it was not used in the early days of
modeling. We implemented consistency checks in order to synchronize Visio files
and the contents of the repository. The result is a report summarizing all possible
inconsistencies.
To summarize, we gained a great deal of new input for a refinement of the
ADAPT metamodel. An ideal solution would be an extensible metamodel which
could be customized to particular requirements. Furthermore, an evaluation of
ADAPT against the Bunge-Wand-Weber framework [24] is an interesting research
topic.
References
1. Kimball, R., Ross, M., Thorntwaite, W., Mundy, J., Recker, B.: The Data Warehouse
Lifecycle Toolkit. 2nd edn. Wiley, Indianapolis (2008)
2. Gluchowski, P., Kurze, C., Schieder, C.: A Modeling Tool for Multidimensional Data using
the ADAPT Notation. Proceedings of the 42nd Hawaii International Conference on System
Sciences, CD-ROM. IEEE (2009)
3. Rittgen, P.: Collaborative Modeling – A Design Science Approach. Proceedings of the
42nd Hawaii International Conference on System Sciences, CD-ROM. IEEE (2009)
75

4. Rekers, J., Schürr, A.: Defining and Parsing Visual Languages with Layered Graph
Grammars. Journal of Visual Languages and Computing 1 (1997) 27-55
5. March, S.T., Smith, G.F.: Design and natural science research on information technology.
Decision Support Systems 4 (1995) 251-266
6. Hevner, A.R., March, S.T., Park, J., Ram, S.: Design Science in Information Systems
Research. MIS Quarterly 1 (2004) 75-105
7. Rizzi, S., Abelló, A., Lechtenbörger, J., Trujillo, J.: Research in Data Warehouse Modeling
and Design: Dead or Alive? Proceedings of the 9th ACM international workshop on Data
warehousing and OLAP. ACM, Arlington (2006) 3-10
8. Sapia, C., Blaschka, M., Höfling, G., Dinter, B.: Extending the E/R Model for the
Multidimensional Paradigm. Proceedings of the Workshops on Data Warehousing and Data
Mining: Advances in Database Technologies. Springer, London (1998) 105-116
9. Malinowski, E., Zimámyi, E.: Hierarchies in a Multidimensional Model: From Conceptual
Modeling to Logical Representation. Data & Knowledge Engineering 2 (2006) 348-377
10. Luján-Mora, S., Trujillo, J., Song, I.: A UML profile for multidimensional data modeling in
data warehouses. Data & Knowledge Engineering 3 (2006) 725-769
11. Golfarelli, M., Maio, D., Rizzi, S.: The Dimensional Fact Model: A Conceptual Model for
Data Warehouses. International Journal of Cooperative Information Systems 2-3 (1998)
215-247
12. Bulos, D., Forman, S.: Getting Started with ADAPT. Whitepaper http://symcorp.com/
downloads/ADAPT_white_paper.pdf (2006). [01-22-2009]
13. OMG: Common Warehouse Metamodel (CWM) Specification V 1.1. http://www.omg.org/
docs/formal/03-03-02.pdf (2003). [01-23-2009]
14. OMG: Request For Proposal: Information Management Metamodel (IMM).
http://www.omgwiki.org/imm/lib/exe/fetch.php?id=welcome_to_imm&cache=cache&medi
a=05-12-02.pdf (2005). [01-23-2009]
15. ISO/IEC 10027 Information technology – Information Resource Dictionary System (IRDS)
16. ISO/IEC 11179 Information technology – Metadata registries (MDR)
17. Zhu, N., Grundy, J., Hosking, J., Liu, N., Shuping, C., Mehra, A.: Pounamu: A meta-tool
for exploratory domain-specific visual language tool development. The Journal of Systems
and Software 3 (2007) 1390-1407
18. Steven, K., Kalle, L., Matti, R.: MetaEdit+: A Fully Configurable Multi-User and Multi-
Tool CASE and CAME Environment. Lecture Notes In Computer Science, Vol. 1080.
Springer-Verlag, London (1996) 1-21
19. Ferguson, R.I., Parrington, N.F., Dunne, P., Hardy, C., Archibald, J.M., Thompson, J.B.:
MetaMOOSE – an object-oriented framework for the construction of CASE tools.
Information and Software Technology 2 (2000) 115-128
20. Eclipse Graphical Modeling Framework (GMF). http://www.eclipse.org/modeling/gmf/.
[01-23-2009]
21. Cook, S., Jones, G., Kent, S., Wills, A.C.: Domain-Specific Development with Visual
Studio DSL Tools. Addison-Wesley, Amsterdam (2007)
22. Bulos, D.: OLAP Database Design. A new dimension. database programming & design, 6
(1996) 33-37.
23. Symmetry Corporation: Free ADAPT Visio Stencil. http://symcorp.com/downloads/
ADAPTv3_visio_stencil.zip. [01-23-2009]
24. Rosemann, M., Green, P.: Developing a meta model for the Bunge-Wand-Weber
ontological constructs. Information Systems 2 (2002) 75-91
76
