
RFId and Returnable Transport Items Management: An
Activity-based Model to Assess the Costs and Benefits in
the Fruit and Vegetable Supply Chain
Giovanni Miragliotta, Alessandro Perego and Angela Tumino
Department of Management, Economics and Industrial Engineering
Politecnico di Milano, 20133 Milano, Italy
Abstract. Radio Frequency Identification (RFId) technology promises to enable
substantial benefits in Returnable Transport Items management. Lured by this
opportunity, some companies (e.g. Metro Group) are carrying out pilot projects,
but the difficulties in quantifying the costs and benefits stemming from such
applications still prevent many companies from using this technology. This
paper describes an analytical model to assess the profitability of such
investments, focusing on the fruit and vegetable supply chain.
1 Introduction
Radio Frequency Identification (RFId) technology is deemed to have great potential
to improve the efficiency and accuracy of asset management in different supply
chains. More specifically, the management of Returnable Transport Items (RTIs) - i.e.
“all means to assemble goods for transportation, storage, handling and product
protection in the supply chain which are returned for further usage, including for
example pallets with and without cash deposits as well as all forms of reusable crates,
trays, boxes, roll pallets, barrels, trolleys, pallet collars and lids” [1] - has always been
a critical issue in the Fast Moving Consumer Goods supply chain. Therefore, a
substantial interest in RFId potentialities has arisen, and some pilot projects have been
launched by supply chain leaders, e.g. Metro Group [2]. However, many companies
are still biding time, primarily because of a lack of confidence in the benefits and,
consequently, in the impact on Return On Investment, which generates a greater
perception of risk [3].
Consistent with this premise, this paper aims to present an activity-based model to
evaluate the profitability of RFId applications supporting RTI management in the fruit
and vegetable supply chain. The paper is structured as follows. Section 2 provides a
classification of the main scientific contributions on the evaluation of RFId
applications. Section 3 presents the objectives and the methodology. and Section 4
describes the model. Section 5 illustrates the application of the model to the supply
chain of a prominent Italian retailer and discusses the main business implications.
Finally, Section 6 draws some conclusions and suggests future research paths.
Miragliotta G., Perego A. and Tumino A. (2009).
RFId and Returnable Transport Items Management: An Activity-based Model to Assess the Costs and Benefits in the Fruit and Vegetable Supply Chain.
In Proceedings of the 3rd International Workshop on RFID Technology - Concepts, Applications, Challenges , pages 39-48
DOI: 10.5220/0002192800390048
Copyright
c
SciTePress

2 Literature Review
The assessment of the value related to the implementation of ICT solutions has
fascinated for years researchers, and various studies have been conducted. However,
most of them have been carried out at the industry and economy levels, or at the firm
level, providing limited support to understand where and how the benefits are
generated. Only few authors analyse the impact of ICT on business processes, which
is essential to understand how value is created (e.g. [4]). If we focus on RFId, in
recent years members of both academic and generalist press have devoted much
attention to the evaluation of RFId projects. The available contributions can be
classified in three main groups.
1. Qualitative papers that describe the strategic implications of applying RFId to
supply chain management (e.g. [5]), provide a taxonomy and a qualitative
evaluation of the benefits achievable through RFId technology (e.g. [6], [7]) and
analyze the implementation process (e.g. [8]).
2. Quantitative analyses based on empirical evidence (e.g. case studies) or experts’
evaluations, which mainly focus on the Fast Moving Consumer Goods supply
chain, where the first pilot projects were launched. These papers seek to provide
both a taxonomy and a quantitative evaluation of the benefits stemming from the
adoption of RFId (e.g. [9], [10]).
3. Quantitative studies based on structured assessment models, that present
mathematical and simulation models to assess the impact of RFId on supply chain
performance (e.g. [11], [12], [13]).
While the first attempts were mainly based on empirical evidence, in recent years
more attention has been paid to mathematical and simulation models. However, they
mainly focus on the benefits that can be achieved applying the RFId tags on the
products (i.e. pallet loads, cases, items), while little attention has been paid to the
benefits enabled by the tagging of RTIs (e.g. [9]).
3 Objectives and Methodology
Consistent with the premises, this paper aims to present a structured model to assess
the costs and benefits stemming from the RFId tagging of RTIs, and to eventually
inspire the decision making process of managers. More specifically, the model
focuses on the management of the RTIs which are commonly used to transport fruit
and vegetables in the Fast Moving Consumer Goods supply chain. The structure of
the model is general, i.e. it can be applied to any retailer who uses RTIs to transport
fruit and vegetables, and consists of three strictly related components: the assessment
of the benefits in productivity, the assessment of the benefits enabled by the increased
process quality and visibility, and the assessment of the capital and operational
expenditures (CapEx and OpEx). The paper present the results of the model
application to a prominent Italian retailer (Nordiconad).
The research program was divided into three phases, which resorted to ad hoc
methodologies. In the first phase, direct interviews with the involved companies
(producer, retailer, pooling company) were performed in order to analyze the
processes. In the second phase, the analytical model was developed, resorting to the
40
well-established activity-based modeling approach, as used by other authors (e.g.
[14]). More specifically, in order to understand the impact on business processes, each
activity was first split into a hierarchy of elementary activities. Then, the impact of
RFId in terms of reduced resource requirements based on relevant operational
resource consumption drivers was evaluated. In order to improve its usability, the
model has been coded into an MS-Excel based tool. Finally, direct interviews and
technological tests were carried out to collect the required inputs and analyze the
results.
4 The Model
4.1 The Reference Supply Chain
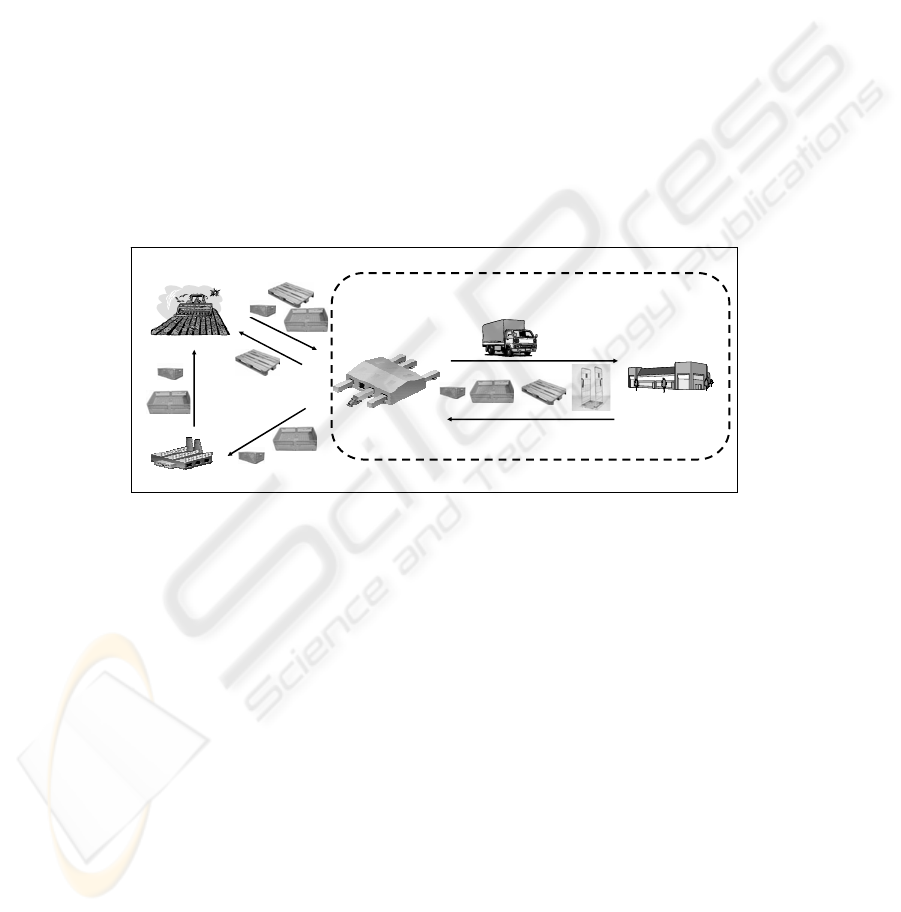
The typical fruit and vegetable supply chain consists of four members: the pooling
company, the producer, the retailer (distribution center, stores) and the carrier. (cf.
Figure 1).
Pooling company
Producer
Retailer point of saleRetailer point of sale
Carrier
Retailer DC
Focus of the assessment model
Fig. 1. The reference supply chain.
The model considers two kinds of RTI, one being used as secondary packaging
(plastic crates and bins), while the other as tertiary packaging (pallets, roll containers).
Other relevant characteristics of this flow are as follows:
• Crates and bins are provided by a pooling company which sends them to the
producer, so that the latter can fill them with fruit and vegetables. In accordance
with the retailer’s orders, the producer sends the RTIs full of fruit and vegetables
to the retailer DC, who temporarily stores them. Then, the stores order the
products, and the retailer DC picks the requested crates and bins and ships them to
the points of sale. Finally, the retailer DC is responsible for the collection of the
RTIs, and for their shipment to the pooling company (thus closing the loop);
• Both roll containers and pallets are used to ship the products from the retailer DC
to the stores, while the producer uses only pallets;
• The owner of the crates and bins is the pooling company, while the pallet and roll
containers are owned by the retailer;
41

• The carrier is responsible for the transport of RTIs from the retailer DC to the
stores.
More specifically, the model is focused on a sub-part of the previously illustrated
supply chain (cf. Figure 1) which consists of the retailer DC, the carrier and the
stores. For each of these nodes the model focuses on the RTI receiving, shipping and
administrative activities. The latter have been analyzed in depth and the associated
consumption of resources has been modeled using an activity-based approach (cf.
Section 3). The results have been extensively reviewed and validated by the logistics
directors of the involved companies.
4.2 The Technological Scenarios
We considered an RFId scenario in which every RTI is provided with a re-usable
RFId tag. The latter is initialized when the asset enters into the system according to
the Electronic Product Code (EPC) standard, which states that a unique identifier has
to be written on the tag. The costs of the RFId tags are sustained by the company who
owns the RTIs, i.e. the pooling company for the crates and bins, and the retailer DC
for the pallets and roll containers.
According to the current performance of RFId technology, a non-zero reading
time has been assumed to ensure perfect reliability, i.e. 100% reading rate (cf. Section
5.1).
All the supply chain nodes are provided with the RFId hardware and software
required to identify all the entering and exiting RTIs. More specifically:
• The loading and unloading docks of the retailer DC are provided with RFId gates
consisting of an RFId reader, four antennas, a movement sensor, a traffic light to
confirm the correct reading, and a monitor;
• The stores are provided with RFId handheld readers;
• All the nodes are provided with appropriate software which collects the data
gathered by the hardware infrastructure.
As a benchmark, we chose a base-line scenario (B) which assumes a visual, non-
automatic identification. In fact, while the bar-code standard is commonly used to
identify the goods, it is still less used for RTI identification and management.
Moreover, the number and typology of shipped RTIs is written on the shipping
documents manually or electronically. As for the plastic bins and crates, the retailer
has to collect information on their usage, which is sent to the pooling company.
4.3 The Assessment of the Benefits
As stated in Section 3, two main classes of benefit were considered. Indeed, we
included both benefits related to productivity increases within the material handling
and the administrative processes (called “operational benefits”), and benefits that
accrue through better process accuracy and visibility.
An activity-based approach was used to assess the operational benefits. In
particular, receiving and shipping activities, along with the related administrative
processes, have been split into a hierarchy of elementary activities. Then, the impact
of RFId in terms of reduced resource requirements has been assessed. For the sake of
42
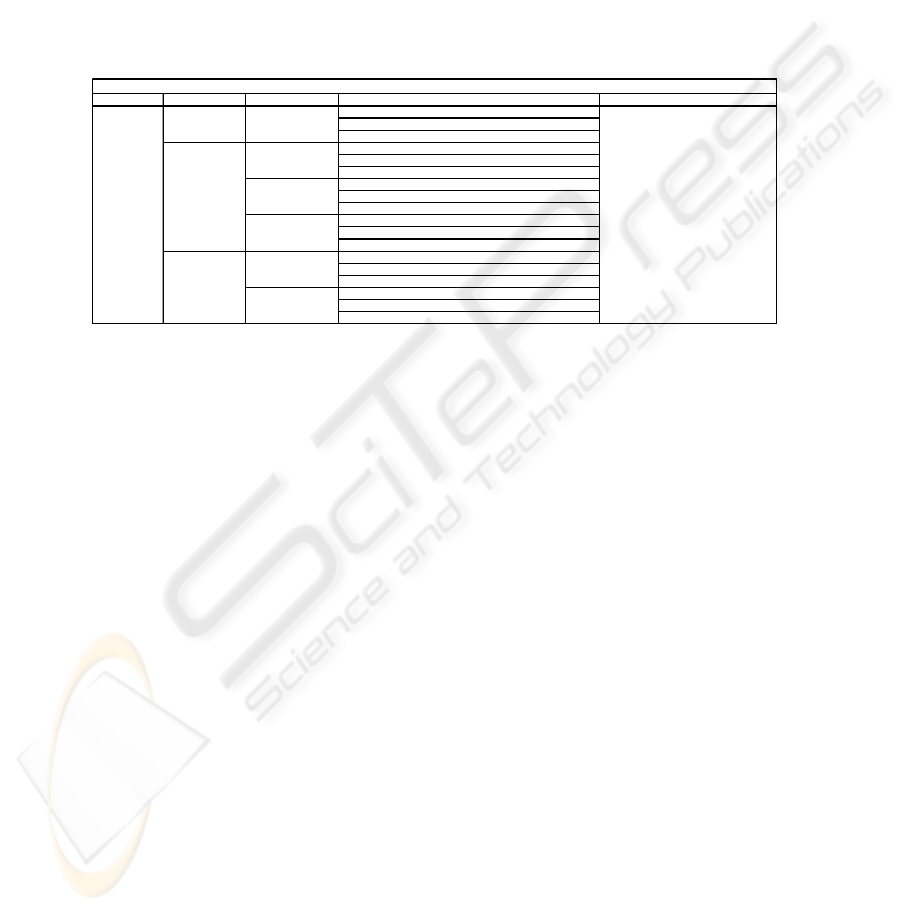
illustration, the model regarding the “Shipping of full RTIs from the retailer DC to the
stores” will be detailed here (cf. Figure 2). After completing the picking activity, the
worker registers the number of RTIs that have been used. Then, two documents are
prepared and printed: the shipping document and a control document, which contains
the typology and the total number of RTIs that are going to be shipped to the stores.
Before the goods are loaded on the truck, a worker counts the number of RTIs that
have been used, and compares it with the data reported in the control document. If
needed, he corrects the document with the right number of RTIs. Thanks to RFId
technology, the assets counting can be automated. For the interested reader, the
complete model (i.e. description of the activities, inputs, formulas) is available on
request.
Macro-activity Activity Elementary activity Input Formula
Time to re
g
ister the data in the IS
(
t_IS
)
Workforce usa
g
e factor
(
η
)
Number of orders per
y
ear
(
n_ord
)
Time to find the shippin
g
document in the IS
(
t_find_sd
)
Workforce usa
g
e factor
(
η
)
Number of trucks exitin
g
from the retailer DC per
y
ear
(
n_truck
)
Time to print a document
(
t_pr
)
Workforce usa
g
e factor
(
η
)
Number of trucks exitin
g
from the retailer DC per
y
ear
(
n_truck
)
Time to print a document
(
t_pr
)
Workforce usa
g
e factor
(
η
)
Number of trucks exitin
g
from the retailer DC per
y
ear
(
n_truck
)
Time to move to the loadin
g
dock
(
t_ld
)
Workforce usa
g
e factor
(
η
)
Number of trucks exitin
g
from the retailer DC per
y
ear
(
n_truck
)
Time to count an RTI
(
t_RTI
)
Workforce usa
g
e factor
(
η
)
Number of RTIs shipped to the stores
(
n_RTI
)
RETAILER DC
Write the number of
RTIs in the Information
System (t_write_IS)
Registration in the
Information System
(t_write_IS)
t_ship_full = t_write_IS + t_doc + t_cont
t_write_IS = (t_IS * n_ord) / η
t_request = (t_find_sd * n_truck) / η
t_print_sd = (t_pr * n_truck) / η
t_print_cd = (t_pr * n_truck) / η
t_move = (t_ld * n_truck) / η
t_count = (t_RTI * n_RTI) / η
Move to the loading
dock (t_move)
Counting (t_count)
Controls (t_cont)
Shipping - Full
RTIs (t_ship_full)
Request to the
Information System
(t_request)
Print the shipping
document (t_print_sd)
Print the control
document (t_print_cd)
Preparation of the
shipping documents
(t_doc)
Fig. 2. The benefits evaluation – Shipping of full RTIs from the retailer DC to the stores.
As regards the benefits enabled by the increased process accuracy and visibility, a
brief description of those which have been quantified is reported here.
• Shrinkage. RFId-enabled automatic identification helps reduce process errors and
improve asset visibility, leading to a reduction in penalty costs when an RTI is not
found. In fact, when an RTI is lost, the supply chain node which is in charge of it
has to pay a pre-defined amount of money to the asset owner.
• Contentious Issues. “Lost RTIs” means that contentious issues are likely to arise
between the involved nodes. In fact, it is not easy to understand when and where
the loss occurs, since currently the RTIs are not individually tracked. The RFId-
enabled automatic identification of all the RTIs supports their tracking and tracing,
thus reducing the insurgency of contentious issues.
• Better Process Control. The automatic identification allows to introduce new
counting controls, which today are not performed because of time (and cost). This
benefit has been assessed in terms of amount of time (and related costs) which
would have been needed in the base-line technological scenario to perform the RTI
counting enabled by RFId.
In addition to the benefits that can be quantitatively assessed, others are of a more
qualitative nature. For example, the RFID-enabled tracking and tracing of all the RTIs
allows to create a database which contains the current location of all the assets. This
allows to improve the rotation of RTIs, as well as to better plan their maintenance.
43
4.4 The Assessment of Capital and Operational Expenditures
The implementation costs of an RFId project include both the initial investment
(Capital Expenditure, CapEx) and the recurrent annual costs (Operational
Expenditure, OpEx). More specifically, CapEx includes the costs of hardware (e.g.
readers, antennas, re-usable tags), software (middleware and software
development/integration), and project management (design, implementation, test and
change management, project management). The OpEx includes the maintenance of
the RFId infrastructure and the annual training costs.
5 The Application of the Model
5.1 The Parameters
The model has been applied to the fruit and vegetable supply chain of a prominent
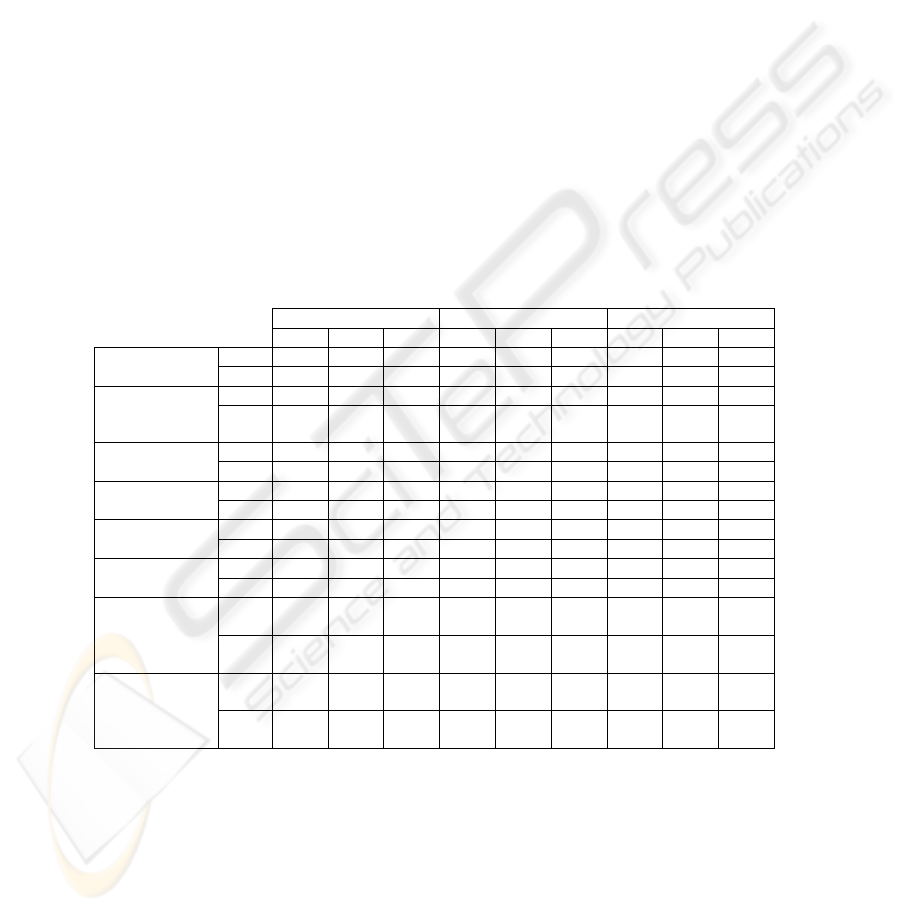
Italian retailer, i.e. Nordiconad. The main flows which characterize the supply chain
are reported in Table 1.
Table 1. The RTI flows (thousands of RTIs).
Retailer DC Carrier Store
C1 C2 C3 C1 C2 C3 C1 C2 C3
Inbound pallets
(kpallets/year)
Full
30 30 60 35 115 210 35 115 210
Empty
35 115 210 35 115 210 - - -
Outbound
pallets
(kpallets/year)
Full
35 115 210 35 115 210 - - -
Empty
30 30 60 35 115 210 35 115 210
Inbound rolls
(krolls/year)
Full
- - - 145 460 860 145 460 860
Empty
145 460 860 145 460 860 - - -
Outbound rolls
(krolls/year)
Full
145 460 860 145 460 860 - - -
Empty
- - - 145 460 860 145 460 860
Inbound bins
(kbins/year)
Full
6 6 11 6 6 11 6 6 11
Empty
6 6 11 6 6 11 - - -
Outbound bins
(kbins/year)
Full
6 6 11 6 6 11 - - -
Empty
6 6 11 6 6 11 6 6 11
Inbound crates
(kcrates/year)
Full
4,20
0
4,20
0
8,00
0
4,20
0
4,20
0
8,00
0
4,20
0
4,20
0
8,00
0
Empty
4,20
0
4,20
0
8,00
0
4,20
0
4,20
0
8,00
0
- - -
Outbound
crates
(kcrates/year)
Full
4,20
0
4,20
0
8,00
0
4,20
0
4,20
0
8,00
0
- - -
Empty
4,20
0
4,20
0
8,00
0
4,20
0
4,20
0
8,00
0
4,20
0
4,20
0
8,00
0
Three different scopes of analysis have been considered, which differ in terms of
costs and benefits:
• Case 1 (C1), in which the RFId project involves only the sub-part of one retailer
DC that is in charge of managing the fruit and vegetables, and the carriers and
stores who receive these products. The RTIs which are used to transport all the
44
other products are not provided with RFId tags, and the related activities are not
considered.
• Case 2 (C2), in which the RFId project involves one retailer DC, which adopts the
technology to support not only the management of the RTIs used to transport fruit
and vegetables, but also of those which are used to transport all the other grocery
products. All the carriers and stores who receive products from the considered DC
are included in the analysis.
• Case 3 (C3), in which the retailer adopts RFId technology in all its DCs to support
the management of all RTIs (both those which are used to transport fruit and
vegetables and those which are used for other grocery products), including the
DCs which do not manage fruit and vegetables. All the carriers and stores who
receive the products from the retailer DCs are considered.
The profitability analysis compares the RFId scenario with a base-line scenario
(B), whose main performance parameters are reported in Table 2. As regards the RFId
scenario, two different identification solutions can be used accordingly to the facility
needs, namely RFId gates or handhelds. For sake of illustration, the RFId gates are
used to identify the RTIs entering in (or exiting from) the retailer DCs, while the RFId
handhelds are preferred in the points of sale because of their higher flexibility. These
two solutions differ in terms of time to identify the RTIs (cf. Table 2).
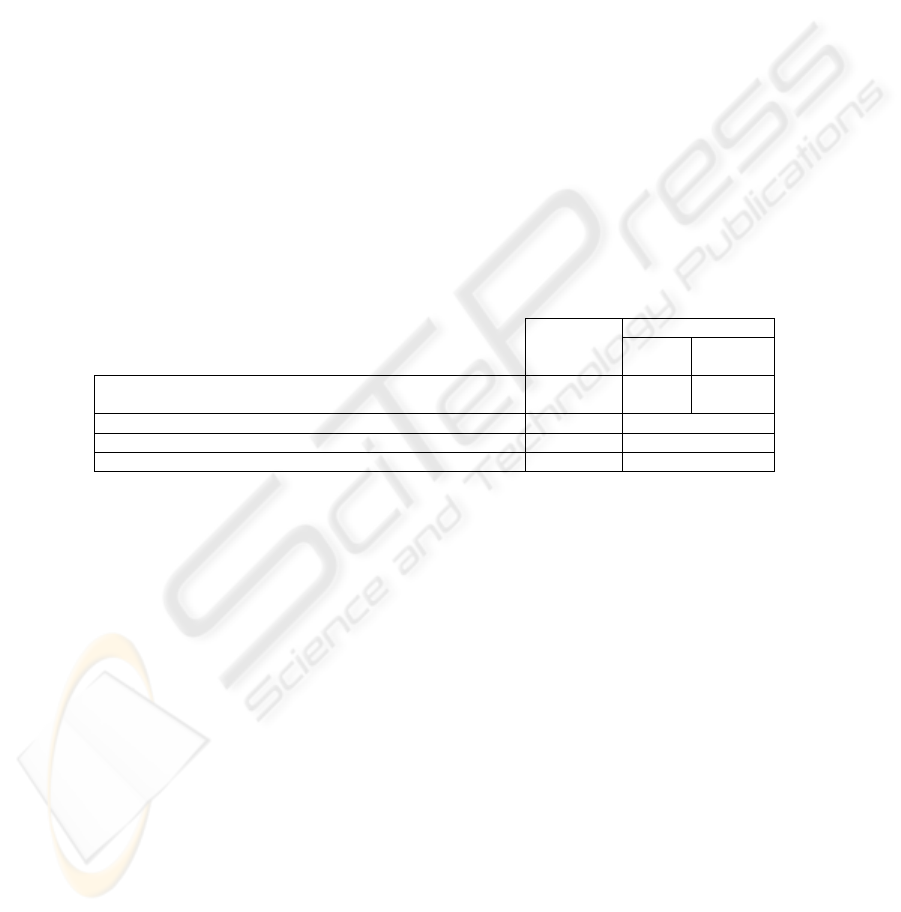
Table 2. The main performance parameters.
Base-line
RFId
Gate
Handhel
d
Time to identify all the crates/bins on a pallet/roll (s/pallet;
s/roll)
145 7.5 15
Time to archive the control documents (minutes/day) 90 0
% errors in the control documents prepared by the retailer DC 2% 0%
% errors in the control documents prepared by the store 5% 0%
5.2 The Results
Figure 3 shows the benefits enabled by the RFId adoption, for the three considered
scopes of analysis (“Case 1”, “Case 2”, “Case 3”).
First, the RFId adoption allows to achieve both significant productivity benefits,
which range from 260,000 €/year in “Case 1” to 880,000 €/year when all the products
and distribution centers are impacted by RFId (“Case 3”). Second, it yields also
substantial benefits enabled by the increased process accuracy and visibility, which
range from about 100,000 €/year in “Case 1” to 475,000 in “Case 3”. Therefore, the
total benefits range from 360,000 €/year to more than 1,350,000 €/year.
Interesting results emerge from the breakdown of the benefits by activity and by
supply chain stage. Overall, the supply chain members enjoy different benefits. More
specifically, it is the retailer DC that reaps most of the benefits, significantly reducing
the costs of both receiving the empty RTIs from the stores and performing
administrative activities. Shrinkage and contentious issues reduction is significant too.
As regards the stores, in the base-line scenario the most critical activity is to ship the
empty RTIs to the retailer DC, since every error would lead to a contentious issue.
45
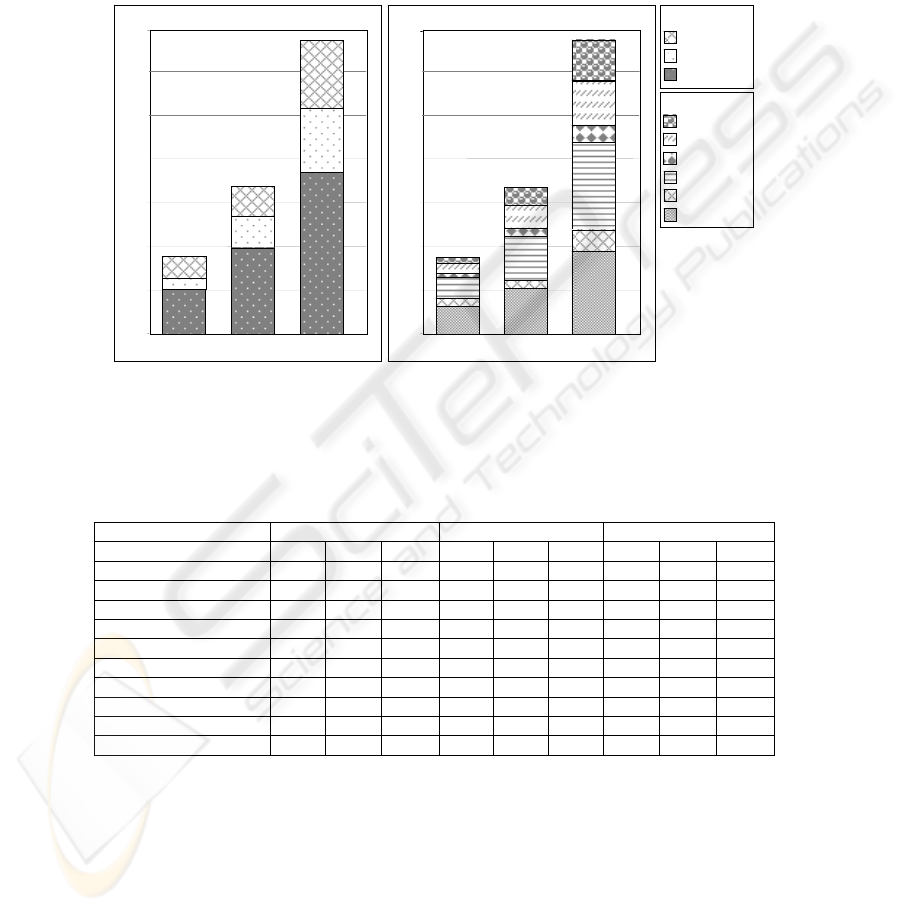
Therefore, most of the benefits are related to the automatic counting and the
contentious issues reduction. The benefits achieved by the carrier, instead, are mainly
related to the possibility of eliminating the controls performed when receiving the
RTIs, because RFId technology enables a more objective and accurate measure of the
number of received assets.
Looking at the supply chain as a whole, the receiving and administrative activities
reap most of the total benefits. The contentious issues reduction and the improved
process control are significant too.
Benefits: Breakdown per SC player
0
200
400
600
1400
Case 1 Case 2
Case 3
Supply Chain
k€/year
358,5
Benefits: Breakdown per activity
Receiving
Shipping
Administrative
activities
Retailer DC
Stores
Carrier
800
1000
1200
208
48
102,5
681
398
147
136
1354
745
295
314
0
200
400
600
800
1400
Case 1 Case 2
Case 3
Supply Chain
k€/year
358,5
132
33
1000
1200
95
20
50
Shrinkage
Contentious issues
Process control
28,5
681
210
97
203
41
103
85
1354
380
98
403
80
206
188
SC players
Activities
Fig. 3. The results of the model – The benefits in the RFId scenario.
Table 3 reports the Capital and Operational Expenditures incurred by the supply
chain members.
Table 3. CapEx and OpEx in the RFId scenario.
Retailer DC Stores Supply Chain
C1 C2 C3 C1 C2 C3 C1 C2 C3
CapEx (k€) 733 827 1,738 214 275 584 947 1,102 2,322
RFId HW – Tags 685 690 1,350 - - - 685 690 1,350
RFId HW – Other 37 114 328 190 230 486 227 344 672
RFId SW 10 20 50 15 35 75 25 55 105
Training 1 3 10 9 10 23 10 13 23
OpEx (k€/year) 45,6 82,3 165,5 18 25 52 63,6 107,3 217,5
Maintenance – HW 30 65 130 15 18 39 45 83 169
Maintenance – SW 1,5 3 7,5 2,2 6 11 3,7 9 18,5
RFId tags on new RTIs 14 14 27 - - - 14 14 27
Training to new people 0,1 0,3 1 0,8 1 2 0,9 1,3 3
As stated before, each RTI is provided with a re-usable RFId tag, whose cost
depends on the specific RTI. More specifically, the tags which are put on pallets,
crates and bins cost about 0.2€/tag, while special tags are used on the “metallic” roll
containers (10 €/tag).
The payback time and the Net Present Value (NPV) have been computed, as
shown in Table 4, taking into account a “transitory period” (1 year) during which we
46
have assumed that the benefits can only be partially achieved. The Net Present Value
has been computed using a five-year time horizon and a discount rate of 4%, whereas
the payback time is based on non-discounted cash flows.
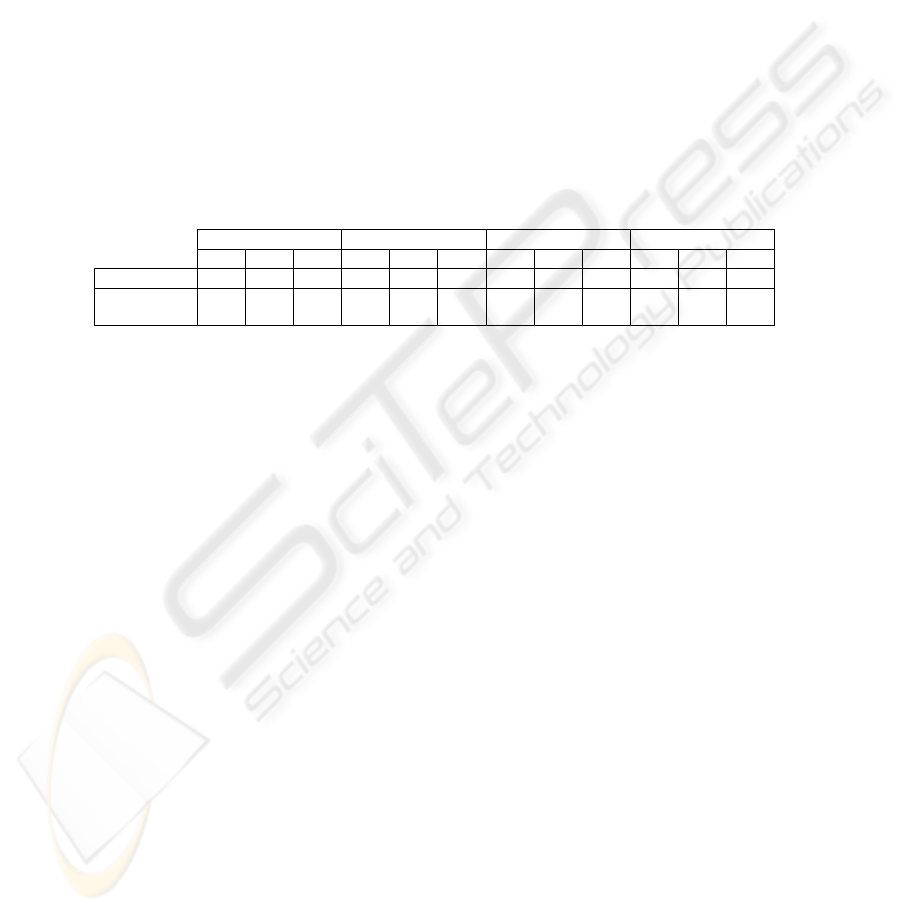
If we consider only those RTIs used to transport the fruit and vegetable flows of a
single distribution center (“Case 1”), a positive Net Present Value cannot be realized
from a supply chain perspective, because only the carrier benefits from the technology
adoption. But when we consider all the RTIs used by one (“Case 2”) or more (“Case
3”) retailer DCs to transport all the grocery products, the investment becomes
profitable from a supply chain perspective. Moreover, Table 4 shows that the best
adoption strategy for the retailer is to adopt RFId in one Distribution Center, which
manages both fruit and vegetables and other products. The results obtained by the
retailer DC in “case 3” are only apparently inconsistent. We could expect the
investment profitability to be similar to that calculated in “Case 2”, but the lower
investment profitability in “Case 3” is due to the fact that some of the additional DCs
included in the analysis do not manage fruit and vegetables (cf. Section 5.1), which
require most of the efforts in the base-line scenario.
Table 4. The investment evaluation – NPV and Pay-back time.
Retailer DC Carrier Stores Supply Chain
C1 C2 C3 C1 C2 C3 C1 C2 C3 C1 C2 C3
NPV (k€)
-263 180 -33 138 385 755 -27 -105 -112 -151 460 610
Pay-back
time (years)
7.7 3.7 6.7 0 0 0 5.3 8.0 5.8 5.6 3.1 3.6
A sensitivity analysis has been carried out in order to analyze how the results
change in function of the most significant parameters. In particular, different reading
time performance of the RFId technology (± 100%) and different costs of the RFId
tags (± 20%) have been considered. The analysis proved that, considering a lower
performance level and a higher tag costs, the investment remains profitable in “Case
2” and “Case 3”, with a pay-back time of 4.0 and 4.7 years respectively. Moreover,
when best technology performance and lower costs are considered (which can jointly
be obtained thanks to a technological improvement and/or a more accurate analysis of
the best tagging position), the investment becomes profitable also in “Case 1”, with a
pay-back time of about four years.
6 Conclusions
This paper shows that RFId technology has the potential to improve the efficiency and
accuracy of the Returnable Transport Items in the fruit and vegetable supply chain.
The results are strongly dependent on the adoption level in terms of facilities and
products which are supported by RFId technology (“Case 1” vs. “Case 2” vs. Case
3”). In fact, while the application of RFId to support only the management of RTIs
which are used to transport fruit and vegetables seems to be unprofitable, a positive
Net Present value is obtained when an entire facility is considered.
The model presented in this paper has a few limitations. The most important is
that it does not consider the pooling company and the producer, both of whom could
47

significantly benefit from RFId adoption. Moreover, a wider sensitivity analysis
should be performed, since only the identification time has been considered so far.
Moreover, the application of the model to other retailers would allow to compare the
project profitability in different real contexts, thus providing interesting information.
Finally, only some of the accuracy and visibility benefits have been quantitatively
assessed. Future developments of the research should overcome these limitations.
Acknowledgements
We would like to thank GS1 Italy and Nordiconad for their valuable support during
all the phases of the research project.
References
1. ISO: ISO TC104 – Supply chain applications of RFId – Returnable Transport Item,
ISO/CD 17364, ISO 2005
2. Wolfram G.: RFId/EPC value-added applications in the supply chain at Metro Group,
RFId/EPCglobal in Europe, Düsseldorf, 2006
3. RFId-IPO, Italian Permanent Observatory on RFId Technologies: RFId: alla ricerca del
valore, research report (in Italian), 2007
4. Mooney J.G., Gurbaxani V., Kraemer K.L.: A Process Oriented Framework for Assessing
the Business Value of Information Technology, Proceedings of the 16th Annual
International Conference on Information Systems, 2001
5. Srivastava B.: Radio Frequency ID technology: the next revolution in SCM, Business
Horizons, Vol. 47, No. 6 (2004), 60-68
6. Helders B., Vethman A. J.: Beyond 2005: how RFId will change the global Supply Chain,
Chain Store Age, Vol. 79, No. 12 (2003), 39-48
7. Curtin J., Kauffman R.J., Riggins F.J.: Making the ‘MOST’ out of RFId technology: a
research agenda for the study of the adoption, usage and impact of RFId, Information
Technology and Management, Vol. 8 (2007), 87-110
8. Wu N.C., Nystrom M.A., Lin T.R., Yu HC.: Challenges to global RFId adoption,
Technovation, Vol. 26, No. 12 (2006), 1317-1323
9. Chappell G., Ginsburg L., Schmidt P., Smith J., Tobolski J.: Auto-ID on the Line: The
Value of Auto-ID Technology in Manufacturing, Auto-ID Center, MIT, 2003
10. Hardgrave B.C., Waller M., Miller R.: Does RFId reduce out of stocks? A preliminary
analysis”, ITRI, University of Arkansas, 2006
11. Atali A., Lee H., Ozer O.: If the inventory manager knew: value of RFId under imperfect
inventory information, Stanford University, 2004
12. Wang S., Liu S., Wang W.: The simulated impact of RFId-enabled supply chain on pull-
based inventory replenishment in TFT-LCD industry, International Journal of Production
Economics, Vol. 112, No. 2 (2008), 570-586
13. De Kok A.G., van Donselaar K.H., van Woensel T.: A break-even analysis of RFId
technology for inventory sensitive to shrinkage, International Journal of Production
Economics, Vol. 112, No. 2 (2008), 521–531
14. Subirana B., Eckes C., Herman G., Sarma S., Barrett M.: Measuring the impact of
information technology on value and productivity using a process-based approach: the case
of RFId technology, MIT, 2003
48
