
Detecting Malicious Insider Threats using a Null Affinity
Temporal Three Dimensional Matrix Relation
Jonathan White, Brajendra Panda, Quassai Yaseen, Khanh Nguyen and Weihan Li
Department of Computer Science, University of Arkansas, U.S.A.
Abstract. A new approach for detecting malicious access to a database system
is proposed and tested in this work. The proposed method relies upon
manipulating usage information from database logs into three dimensional null-
related matrix clusters that reveals new information about which sets of data
items should never be related during defined temporal time frames across
several applications. If access is detected in these three dimensional null-related
clusters, this is an indication of illicit behavior, and further security procedures
should occur. In this paper, we describe the null affinity algorithm and illustrate
by several examples its use for problem decomposition and access control to
data items which should not be accessed together, resulting in a new and novel
way to detect malicious access that has never been proposed before.
1 Introduction
Unauthorized access to data resources is a major threat faced by all organizations.
While organizations typically have very complex firewalls and intrusion detection
systems in place in order to detect external threats, these systems do little to protect
organizations against another significant threat, the malicious insider [1]. These
insiders will often not be after the physical systems, rather they will attempt to corrupt
or capture the data these systems contain. This threat needs to be protected against,
and more work needs to be performed in the prevention and detection of these attacks.
Reality, however, shows that such mechanisms for enforcing security policies are
often ignored or not adequately used by security professionals. While the reasons for
this vary, they typically are related to how complex it is to define implementable
security policies and how difficult enforcement against “privileged users” can become
[12]. Much more emphasis needs to be placed on simple, well-defined internal access
control mechanisms.
We propose a misuse detection system that involves knowledge about the set of
data items that are used during the normal execution of an application during certain
defined time frames. This is done for some set (or all) applications that are run against
the database, resulting in a three dimensional relation. This information is then used to
cluster groups of data items that have low temporal affinity, meaning that they are
rarely, if ever, used together during standard operating conditions. This information
can be collected by investigating historical data kept in the logs by the database
management system. This raw historical usage data is then transformed using three
dimensional matrix operations that allow security engineers to better analyze potential
White J., Panda B., Yassen Q., Nguyen K. and Li W. (2009).
Detecting Malicious Insider Threats using a Null Affinity Temporal Three Dimensional Matrix Relation.
In Proceedings of the 7th International Workshop on Security in Information Systems, pages 93-102
DOI: 10.5220/0002199000930102
Copyright
c
SciTePress

misuse from current dynamic database operations. This method has not been proposed
before, and it shows promise to reveal previously unknown usage patterns that can
indicate illicit behavior. Our proposed method also has several benefits over other
traditional methods of insider threat detection in that it requires little storage space,
can be easily adjusted to reflect new applications, is very quick in operation once the
historical data has been properly clustered, and requires only a moderate amount of
computational time to calculate.
The paper is organized as follows. Section 2 details previous work on security
issues related to databases and malicious data access detection. Section 3 presents the
proposed mechanism for building a two dimensional usage matrix for each
application from historical logs that will be used in determining valid use. Section 4
presents the algorithm we have developed for computing the null temporal affinity of
a given usage matrix; section 5 presents an evaluation of our results. Section 6
concludes the paper.
2 Background
In spite of the classical security mechanisms developed in the database area, current
DBMS are not well prepared for integral security mechanisms such as privacy and
confidentiality. An important part of security aware databases will include
mechanisms to automatically detect malicious data accesses and intrusions, and
prevent them from occurring again in the future. By implementing intrusion detection
and prevention methodologies, organizations are afforded better protection against
data misuse and corruption, resulting in substantial savings for that organization.
General methods for intrusion detection are based on either anomaly detection or
pattern recognition [2], [13]. Pattern recognition is the search for known attack
signatures in commands that are currently being executed. Anomaly detection relies
on searching for deviations from known historical profiles of good commands and
using this as an indication of threats [10]. We use the anomaly detection approach for
this work as it allows a large set of historical input data that can be easily processed
from the logs that are kept by all database management systems [14]. In the following
sections, we will show other works that relate to anomaly detection.
Recent works have addressed real-time intrusion and attack isolation in DBMS.
DEMIDS [3] is a misuse detection program designed to examine audit logs to derive
user profiles that are a snapshot of typical user behavior. If the user strays too far from
their historical profile, their actions are monitored more closely to determine if they
are acting maliciously.
The DEMIDS program introduces the notion of distance measure and frequent
item sets to capture the working scopes of users using a data mining based algorithm.
If the items that the user attempts to access are far enough away from what is
typically accessed, this is a strong indication that malicious behavior is occurring. The
user can be prevented from accessing further items once it has been determined they
are acting maliciously. This work focused on the user/data item relationship, while
our work focuses on the application/data item/temporal frame relationship.
Fonseca [2] designed a program called MDAD (Malicious Data Access Detector)
that examines the set of valid SQL queries that a user typically performed. The
94

program used two distinct phases, a learning phase where valid logs are examined to
derive a user profile of valid queries that are performed, and a detection phase where
new queries are compared to known historical data. The program uses a directed
graph to better protect traditional database applications from SQL injection type of
attacks as well as web based attacks. Petri-Nets and data dependency relationships
were use to model normal data update patterns and potential database misuse in [5]
and fingerprints of normal behaviors that can be used for intrusion detection in
databases is addressed in [4].
Clustering high use items has been used in [6], [7]. In those domains, high affinity
items are clustered together to better see sets that are used frequently together during
the normal execution of a transaction. The clusters also enabled potential
segmentation of large datasets across a distributed environment, enabling better
performance metrics. These works were not concerned with temporal relations or how
the low affinity items might be clustered to show items that should not be clustered
together.
3 Assigning Null Affinity Temporal Values
In a typical database environment, transactions are programmed into various database
application interfaces, so as long as the database applications remain stable, the set of
transactions that are executed will not change. For example, in an educational
database application, users can only perform and interact with data items that are
available at their user-dependent application interface (e.g., viewing grades, paying
for classes, entering grades, dropping a student from a class, etc). Other operations are
not available for that particular class of end-user. Normally, end-users can not execute
ad hoc queries against the database. It is a very realistic assumption to use
transactional profiling to detect malicious data access, resulting in a reduced risk of
false alarms with other intrusion detection mechanisms.
3.1 2D Usage Array
For each application A
y
that is run on the database, choose a time frame T
z
. The time
frame needs to be chosen with a granularity that reflects the usage of the database,
and the temporal frame can be adjusted as necessary. For each data item I
x
available
to an application, an attribute usage value, denoted as use(I
x
, A
y
, T
z
), is defined as:
use(I
x
, A
y
, T
z
) =
{
}
Tz frame timeduringIx item data usesAy n applicatio if 1
otherwise if 0
(1)
The matrix is stored in an M x N two dimensional data usage array at position A
i,j
where M is the number of data items (rows) and N is the number of temporal frames
(columns) and i is the particular data item and j is the particular time frame under
examination.
95

1234567
1000000
1111111
1010101
0000010
0000010
a
b
c
d
e
TT T T T T T
I
I
I
I
I
Fig. 1. Example 2D usage matrix.
In the above figure, an application used data item I
a
only during time frame T
1
. In
this example, we can define the time frame to be the days of week, so time frame T
1
would correspond to Monday during a given week and year. If it is so desired, the
temporal granularity can be changed so that the time frame under examination has a
larger or smaller amount of granularity. For example, the usage matrix could be
defined for only each hour during the Monday T
1
time frame from the above example.
The time frame could also have a much larger granularity; for example, the data usage
matrix could be defined as the previous twelve months of usage.
3.2 3D Usage Matrices
The 2D usage arrays are calculated for each application that is run against the
database, resulting in a three dimensional relationship. If an application is not
suspected for potential misuse, the security engineer can extricate that particular
application from the process and focus on other, more susceptible, applications. The
result is then an M x N x P relationship where M is the number of data items, N is the
number of temporally related time frames that were chosen in the first step, and P is
the number of applications that are run against the database. This 3D usage data is
used next to find and cluster elements that should not be used together across three
dimensions, time, application level, and data item level, resulting in a novel way to
detect misuse of the database.
4 Computing Null Temporal Affinity Energy Levels
Given the 3D usage matrix of a particular system, we have defined a Null Temporal
Affinity Energy (NE) methodology that processes the 3D matrix so that dense clumps
of zeros are clustered together across all thee dimensions. The NE algorithm was
devised so that a three dimensional matrix that possesses dense clumps of zeros in all
three dimensions will have a large NE (null energy) level when compared to the same
three dimensional matrix whose elements across the y and z axes have been permuted
so that its numerically small elements are more uniformly distributed throughout the
relation. The x axis (time) is not permuted because each of the time frames are related
by some fixed metric; this relationship will be used to expand or contract the three
dimensional relationship to home in on particular areas of potential misuse in an area
of future work described in section 6.
96

The proposed null energy level is the sum of the bond strengths in the 3D array of
each nearest neighbor in three dimensions, where the bond strength is defined as the
inverse of their product. The NE value, then, is given by:
NE(U)
Tx
= ½ *
______ _______ _______ _______ _______ _______ _______
( ( ( *[ ])))
,, 1,, 1,, , 1, , 1, ,, 1 ,, 1
111
jN
iM kP
AAAAAAA
i jk i jk i jk i j k i j k i jk i jk
ijk
=
==
+++++
∑∑∑
+− +− +−
===
(2)
__
x
A represents the binary inverse of A
x
. U is a nonnegative M x N x P three
dimensional array consisting of results of the use function over time period T
x
; U was
derived in section 3. Since all the values of U are binary, the NE value is very
efficiently calculated, even when given large three dimensional matrices. The value of
½ is present so that each bond is only counted once in the total NE sum.
To better understand what the NE value represents, one can visually circle
adjacent zeroes going up, down, left, or right in the same two dimensional plane, and
also potentially circling zeros in the plane above and below the current element. All of
these six elements are related, and by permuting and then clustering them, items are
revealed which should not be used together for certain time frames across different
applications and different data items. This is done for each element in the three
dimensional matrix; the negative energy is the total sum where adjacent elements are
zero. For example, the NE of the matrix in only two dimensions in Fig. 1 is 19.
Because of the three dimensionality of the matrix, clustered arrays in two
dimensional planes that appear to have a small NE value may in fact be contributing
to a larger total null energy value in the resultant three dimensional matrix. This is
data that is not apparent by simply viewing the usage information from the logs. By
including time, data items, and the applications that are used, our solution can detect
malicious individuals who are using multiple applications illicitly, which is an
improvement over other methods.
As the data items and applications are not related by some predefined metric, we
can permute the three dimensional planes and the rows in each plane without losing
information. Maximizing the NE by row and/or planar permutations serves to create
strong bond energies by driving the null valued array elements together. The pattern
of misuse revealed by the clustering of non related data enables this identification,
and the intrusion detection method would not function as without the clustering of the
zero valued elements.
4.1 Sensitivity to Initial Conditions
The NE level of a given matrix is very sensitive to the degree of clumpiness of null
valued elements. For example, consider the following two dimensional matrixes that
consist of the same elements with different permutations. By permuting the rows, we
are able to achieve a higher degree of null valued elements that are adjacent. While
demonstrating this in three dimensions is more difficult visually, the concept is the
same.
97
4.2 Permutation Algorithm
The Null Temporal Affinity Energy algorithm maximizes the summed bond energy
over all row and planar permutations of an input array U to reveal clusters of data
items that should not be used together during certain time frames. That is, we wish to
find:
max { NE(U)
Tx
}
(3)
where NE(U)
Tx
was defined in Equation 2 and the maximization is taken over the
possible matrices that are obtained by permuting the rows and planes of the original
use value matrix. By convention, the three dimensional use matrix was defined to be
an
M x N x P array where M is the number of data items, N is the temporal time frame,
and P is the number of applications under examination.
The algorithm will always reduce the input use array into a three dimensional
matrix with the non-interacting zero valued elements clumped together independently
of the initial ordering of the rows, columns, and planes. This decomposition reveals
data items that should not be accessed together during certain time frames, as the
following two dimensional figures show.
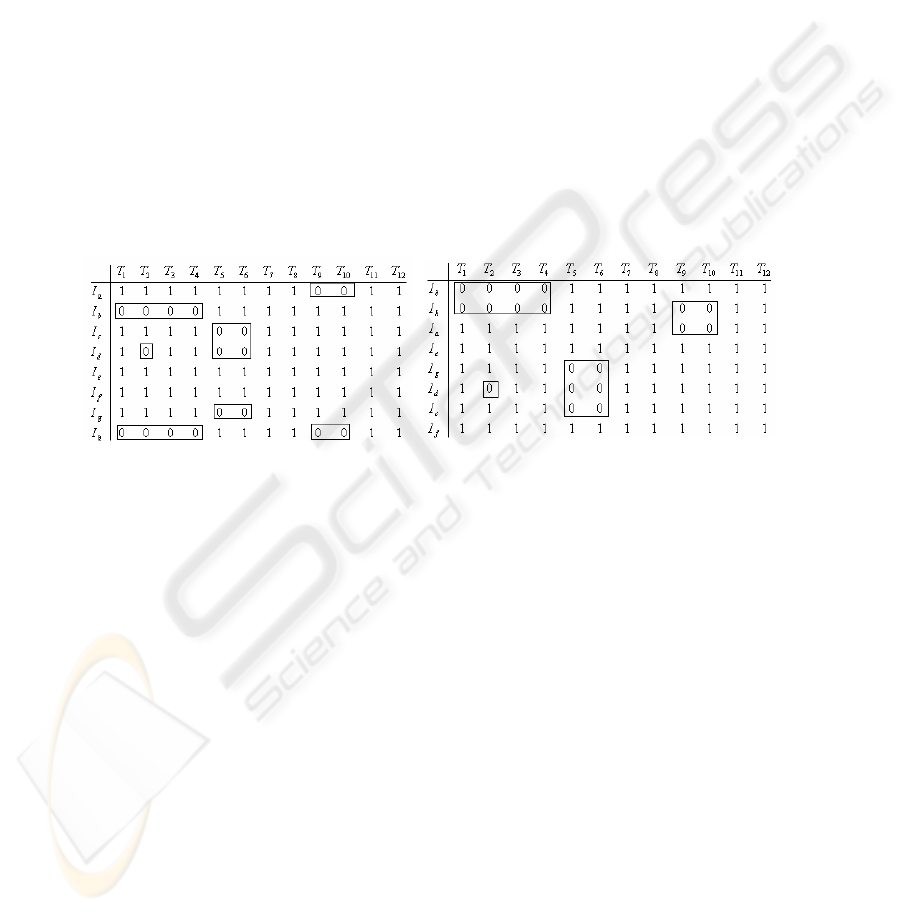
Fig. 2. Original use array with clusters
identified NE = 13.
Fig. 3. Maximized use array with clusters
identified. NE = 21.
By clustering the data items that should not be used together in certain time frames,
one can better predict what malicious users will access if they are indeed actually
acting maliciously. In figure 3, for example, if it is detected that access occurred to
data items I
g
and I
c
during time frame T
5
, if other accesses occurred to data items I
g
,
I
c
, or I
d
during time frame T
6
, this is a strong indication of misuse. When the third
dimension is added, one can also predict how a malicious attacker will act if they are
using multiple applications. This indication is not evident in the non-maximized array
presented in figure 4, and even less so in the DBMS logs. By performing the
permutation based clustering in three dimensions, potential patterns of misuse are
revealed very prominently, and this data can be used to detect intrusions.
5 Insider Threat Intrusion Detection
The mechanism for the detection of potential malicious use of the database by an
insider threat relies on using historical information to build a profile of an
98

application’s normal execution involving both the data items that the application uses
and the times in which they are accessed. This is performed for each application,
resulting in a three dimensional relation. Our proposal can be run as an autonomous
subsystem separated from the DBMS on a dedicated machine or the mechanism can
be implemented internally to the DDMS using triggers. However, in the case of the
latter, the performance of the database may be degraded as the execution of database
triggers is normally a high resource consuming task.
Once the maximized 3D use matrix is calculated, questionable actions are
compared to this known historical data to find how ‘close’ these questionable queries
are to the known good behavior. To capture the idea of ‘closeness’, we introduce the
notation of a distance measure. The goal of this distance measure is to capture how far
from normal behavior questionable requests appear. Queries that are too far from
what is considered ‘close’ require more security procedures to occur. Actions that are
within some threshold of normalcy are allowed with no further examination.
5.1 Distance Measure Function
As our mechanism involves what data items are accessed, when they are accessed,
and what applications are being used, suspicious queries could be using the correct
data item at the wrong time, the wrong data item at the correct time, or both the wrong
data item at the wrong time, as well as several incorrect application level usages. If
the correct application is using the correct data items at the correct times, no further
examination needs to occur. However, when a suspicious action is detected involving
any of the variables under measure, (denoted by S
a
in the following sections), this
suspicious action needs to be compared to the known historical behavior that has been
processed and permuted so as to have a maximum null energy, which was described
in section 4. This maximized matrix is denoted as A
max
below. The distance measure
function takes these ideas into account and is given as follows:
For each data access that does not conform to what was expected, the distance of
this access is calculated as follows:
Dist(A
max
[i,j,k], S
a
[i,j],k) = k
1
*t
y
+ k
2
*n
y
+k
3
*a
y
(4)
This function is called for each A
max
[i,j,k] that does not equal S
a
[i,j,k] and where
A
max[
i,j,k] is a zero valued element. k
1
, k
2
, k
3
are weights between 0 and 1 assigned by
the security officer, t
y
is the time until an allowable access occurred in the past/future,
n
y
is the number of access in a three dimensional congruent cluster during the time
frame under suspicion, and a
y
is the number of applications used illicitly in that
cluster.
The Dist value is calculated for each nonconforming access, and these values are
summed to give a result. It is important to note that each access may lie at different
coordinates in the x, y, z plane, so S
a
is also potentially a three dimensional matrix.
The summed distance values must be over some specified threshold value in order for
the access to be called illicit. This threshold value must be set by the security officer.
The total distance is calculated as follows:
99

Total_Dist =
∑
=
=
acessessuspiciousofendk
accesssuspicousfirstk
kADist
___
__
max
),(
(5)
The k
1
, k
2
, and k
2
values exist in equation 4 so that the distance value can be
weighted towards the time, data items, or the number of potential applications used
illicitly in the cluster. Depending on the usage of the application, one of these metrics
may be more important and should be weighted higher so as to give a greater
contribution to the distance that the access is from normal.
The value t
y
is calculated by finding the closest valid time that the data item had
been accessed in the past or future while still using the current application. By
definition, t
y
= d where A
max
[i
±
d,j,k] is the closet access to S
a
[i,j,k] where
A
max
[i ± d,j] is 1.
The value of n
y
is calculated by counting the number of potentially illicit accesses
that lie in a particular three dimensional cluster of items that should not be related.
These clusters were found by using the process described in Section 4. This gives
weight to the number of illicit data items accessed. a
y
is calculated by summing the
number of applications used maliciously that lied in that cluster. If the values of t
y
, n
y
,
or a
y
are high, this increases the distance measure and is a strong indication of misuse.
An insider threat is detected if, after performing the above procedure, the following
holds:
Total_Dist ≥ D
thresh
(6)
where D
thresh
is the threshold distance that is set to the maximum distance a suspicious
query can be before it is known to be malicious. The Total_Dist will grow as more
suspicious actions occur. The D
thresh
metric is system dependent, and it needs to be
assigned by the security officer using knowledge about the particular environment the
database is used in. If the calculated distance of the access usage array is above the
threshold, other security procedures should occur [2]. These might include notifying
the DBA about the illicit behavior by triggering an alarm with the relevant
information such as the time, username, database objects accessed attached to the
message, immediately disconnecting and rolling back the changes that the user made,
or execution of some damage confinement and repair mechanisms that are built into
the DBMS. These security precautions are dependent on the application and will be
different for each use [11].
6 Conclusions
This paper has proposed a new mechanism to detect malicious data access. As
database systems play a vital role in organizational information architectures,
procedures must be in place to ensure that these resources are not being used
maliciously [8], [9]. We have presented the concepts and underlying architecture and
shown how they can be applied.
Our proposal relies on using historical data stored by the database logs on what
data items were used at a particular time by various applications. This information is
then processed to reveal clumps of data items that should not be used together during
100

certain time frames, resulting in a three dimensional usage matrix. This matrix allows
a better prediction of potential misuse by allowing quicker and more precise
prediction of items that should not be used together across the time, data item, and
application dimensions. Suspicious queries are then compared to the maximized usage
array and a distance value is calculated for each non conforming action. These
distances are summed to reveal how far from what was expected this access is. If the
access is above a certain threshold, further security procedures are performed.
This work has revealed several areas of improvements and further work. We are
working on adding a spatial dimension to our model as the physical location of a user
is often an important security metric. The resulting four dimensional matrix requires a
reworking of our clustering algorithm and modifications to the distance calculations.
As mentioned previously, we plan to develop an automatic method to allow the
temporal time frame to be dynamically set so as to show several characterizations of
the system. As the usage array is already clustered, we will be able to focus in on
certain areas that we know are hotspots for potential attacks, and tailor the system to
these dimensions. The clustering is what allows us to have this view of the system.
Acknowledgements
This work has been supported in part by US AFOSR under grant FA 955-08-1-0255.
We are thankful to Dr. Robert. L. Herklotz for his support, which made this work
possible.
References
1. Gordon, L. Loeb, M., Lucyshyn, W. and Richardson, R. Computer Security Institute.
Computer crime and security survey, 2006.
2. Fonseca, J., Vieira, M., and Madeira, H. Online detection of malicious data access using
DBMS auditing. In Proceedings of the 2008 ACM Symposium on Applied Computing. SAC
'08. ACM, New York, NY, 1013-1020, 2008.
3. Chung, C. Y., Gertz, M., Levitt, K. DEMIDS: a misuse detection system for database
systems. In integrity and internal Control information Systems: Strategic Views on the
Need For Control, Norwell, MA, 159-178, 2000.
4. Lee, S. Y., Low, W. L., and Wong, P. Y. Learning Fingerprints for a Database IDS. In
Proceedings of the 7th European Symposium on Research in Comp. Security. LNCS, vol.
2502. Springer-Verlag, London, 264-280, 2002.
5. Hu,Y. and Panda, B. Identification of Malicious Transactions in Database Systems. In
ideas,pp.329. 7
th
Intl. Database Engineering and Applications Symposium (IDEAS'03),
2003
6. McCormick W., Schweitzer P., White, T. Problem Decomposition and Data Reorganization
by a Clustering Technique, Operations Research. 993–1009, 1972.
7. Navathe, S., Ceri, S., Wiederhold, G., and Dou, J. Vertical partitioning algorithms for
database design. ACM Trans. Database Syst. 9, pp. 680-710, 1984.
8. Ramakrishnan, R. and Gehrke, J. Database Management Systems. 3rd. McGraw-Hill. 2002
101

9. Vieira, M. and Madeira, H. Detection of Malicious Transactions in DBMS. In Proceedings
of the 11th Pacific Rim international Symposium on Dependable Computing (December 12
- 14, 2005). PRDC. IEEE Computer Society, Washington, DC, 350-357, 2005
10. Bertino, E., Kamra, A., Terzi, E., and Vakali, A. 2005. Intrusion Detection in RBAC-
administered Databases. In Proceedings of the 21st Annual Computer Security Applications
Conference. ACSAC. IEEE Computer Society, Washington, DC, 170-182, 2005
11. Schonlau, M. and Theus, M. Detecting masquerades in intrusion detection based on
unpopular commands. In Information Processing Letters, vol. 76, 33–38, 2000.
12. Dewri, R., Nayot, P., Indrajit, R., Whitley, D.: Optimal security hardening using multi-
objective optimization on attack tree models of networks. In ACM Conference on Computer
and Communications Security, 204-213, 2007.
13. Ray, I., and Poolsappasit, N. Using Attack Trees to Identify Malicious Attacks from
Authorized Insiders. In ESORICS 2005, Milan, Italy, pp. 231-246, 2005.
14. Poolsappasit, N., Ray, I. A Systematic Approach for Forensic Investigations of Computer
Attacks Using Attack Trees. In Proceedings of the 3rd IFIP WG 11.9 International
Conference on Digital Forensics, Orlando, Florida, 2007.
102
