
Automatic Analysis of Historical Manuscripts
Costantino Grana, Daniele Borghesani and Rita Cucchiara
University of Modena and Reggio Emilia, Italy
Abstract. In this paper a document analysis tool for historical manuscripts is
proposed. The goal is to automatically segment layout components of the page,
that is text, pictures and decorations. We specifically focused on the pictures,
proposing a set of visual features able to identify significant pictures and separat-
ing them from all the floral and abstract decorations. The analysis is performed
by blocks using a limited set of color and texture features, including a new tex-
ture descriptor particularly effective for this task, namely Gradient Spatial De-
pendency Matrix. The feature vectors are processed by an embedding procedure
which allows increased performance in later SVM classification.
1 Introduction
The availability of digitized versions of historical documents offers enormous opportu-
nities for applications, especially considering that often the original versions are closed
to the public due to their value and delicacy. Among all, the illuminated manuscripts are
very interesting from this point of view, because of their historical and religious pecu-
liarities: these masterpieces contain beautiful illustrations, such as different mythologi-
cal and real animals, scenes, court life illustrations, symbols and so on. Since a manual
segmentation and annotation require too much time and efforts to be performed, the
automatic analysis would be a challenging but undoubtedly very useful opportunity.
In this work we propose a system to segment and extract in an automatic way pic-
tures from the decorated pages of these manuscripts. The application is particularly
innovative since for the first time an attempt to distinguish between valuable pictures
and decoration is proposed by means of visual cues. To solve this task, we exploited a
novel texture feature, specifically aimed at detecting the correlations between the gra-
dient directions and a novel clustering-based embedding process applied to Support
Vector Machines, which allows to reduce the training requirements both in terms of
number of samples and of computational time without impacting on the classification
performance.
2 Related Work
Document analysis is one of the most explored fields in image analysis, and a plethora
of works has been produced dealing with different aspects of the segmentation of the
document. The seminal work of Nagy [1] gives the perfect overview of the techniques
proposed until some years ago for text segmentation (the overall most faced problem),
OCR and background removal. Some approaches dealing also with pictures segmen-
tation have been proposed. Chen et al. provide a general partition of the classification
Grana C., Borghesani D. and Cucchiara R. (2009).
Automatic Analysis of Historical Manuscripts.
In Proceedings of the 9th International Workshop on Pattern Recognition in Information Systems, pages 93-102
DOI: 10.5220/0002200500930102
Copyright
c
SciTePress

approaches proposed so far [2]. In particular, according to their taxonomy, the page can
be classified using image features, physical layout features, logical structure features
and eventually textual features. Several works tackle the physical and logical segmen-
tation of the page, exploiting different rules on the page structure, such as geometric
constraints over the layout. Our work belongs to Chen’s first class, based on image fea-
tures. Texture features based on frequencies and orientations have been used in [3] to
extract and compare elements of high semantic level without expressing any hypothe-
sis about the physical or logical structure of the analyzed documents, exploiting a page
analysis by blocks. Nicolas et al. in [4] proposed a 2D conditional random field model
to perform the same task. Histogram projection is used in [5] to distinguish text from
images, while a more complex approach based on effective thresholding, morphology
and connected component analysis has been used in [6].
In [7] Le Bourgeois et al. highlighted some problems with acquisition and compres-
sion, then authors gave a brief subdivision of documents classes, and for each of them
a proposal of analysis. They distinguished between medieval manuscripts, early printed
documents of the Renaissance, authors manuscripts from 18th to 19th and finally ad-
ministrative documents of the 18th - 20th. In this work, the authors performed color
depth reduction, then a layout segmentation that is followed by the main body segmen-
tation using text zones location. The feature analysis step uses some color, shape and
geometrical features, and a PCA is performed in order to reduce the dimensionality.
Finally the classification stage implements a K-NN approach. Their system has been
finalized in the DEBORA project [8], which consists of a complete system specifically
designed for the analysis of Renaissance digital libraries.
In this paper we are interested in the first class identified by [7], that is composed of
illuminated manuscripts. We propose a mixed approach based on both texture and mor-
phology for text and image segmentation, while we define a new method to distinguish
between picture and decoration.
3 An Overview of the System
The approaches for image segmentation and classification presented in this paper have
been implemented in an integrated system for document analysis and remote access,
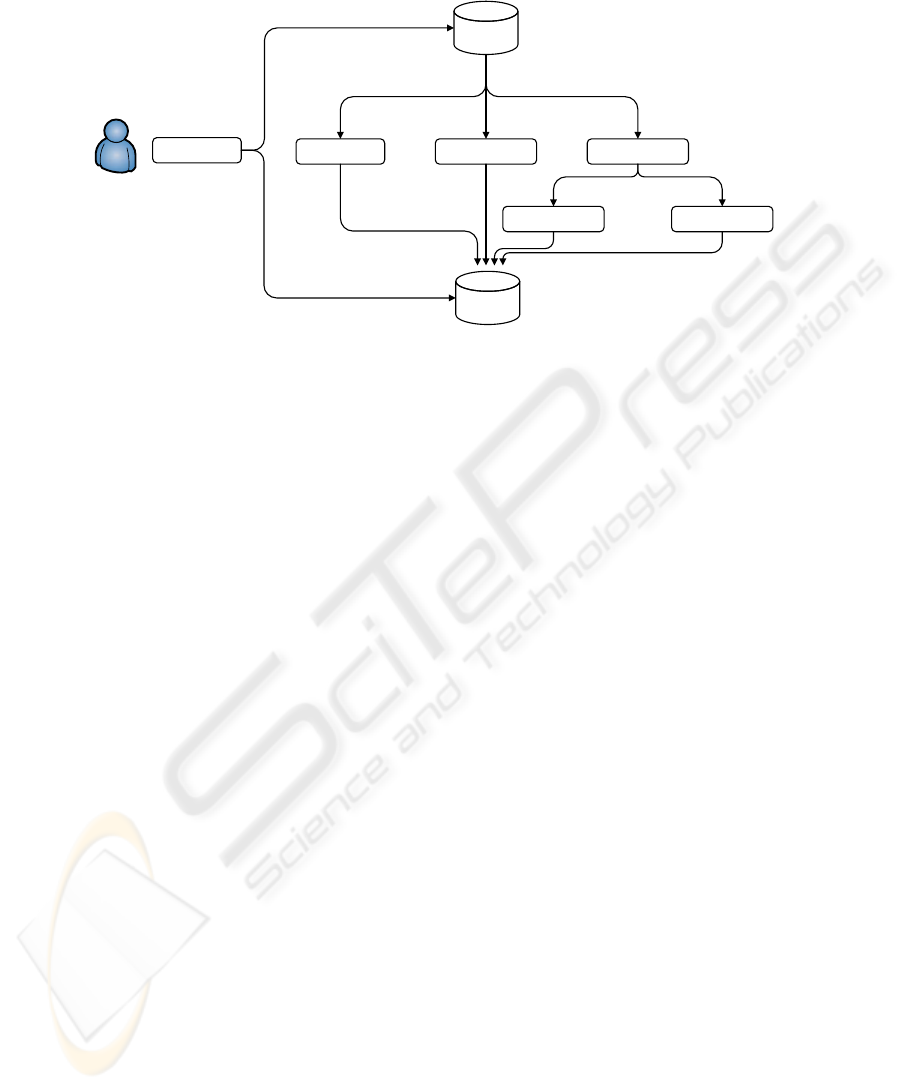
including querying and browsing functionalities. The system elements are reported in
Fig. 1. Two different databases have been created in order to store images and annota-
tions. The former stores the high resolution digitized manuscripts, while the latter con-
tains both the automatically extracted knowledge and the historical comments added by
experts.
The retrieval subsystem shares the canonical structure of CBIR systems. This is the
basis for the user interface module, that integrates the visual and keyword-based search
engine to propose an innovative browsing experience to the user. The web interface
allows to select a manuscript, and for each page the automatic layout segmentation is
provided distinguishing between background, text, and images.
An offline page analysis module process the stored images and for each of them de-
tects text and images. Then it distinguishes pictures within the decorations and extracts
them separately. The details of these steps are fully described in the following sections.
94
Background ImagesText
Picture Decoration
Images
database
Annotation
database
UI
Fig. 1. Overall schema of the system.
After the segmentation, the areas are saved into the annotation database and a feature
extraction stage is performed over the picture areas, to allow CBIR functions such as
similarity-based retrieval on their visual appearance.
The text detection module integrated in the page analyzer is based on the approach
reported in our previous work [9]. Briefly, we use a two-dimensional autocorrelation
matrix, since textual areas have a pronounced horizontal orientation that heavily differs
both from background and decoration blocks. Given the autocorrelation matrix, the sum
of all the pixels along each direction is computed to form a polar representation of the
autocorrelation matrix, called directional histogram. This polar distribution is modeled
using a mixture of two Von Mises distributions, since the standard Gaussian distribu-
tions are inappropriate to model angular datasets. SVMs are then used for learning and
classification. The text areas are then also stored in the annotation database, in order to
allow the application of OCR functions, or visual keyword spotting [10].
4 Picture Extraction
Miniature illustrations detection begins with a preprocessing stage to distinguish be-
tween background, text, and images. The result of the image extraction is a binary mask
containing both pictures and decorations. Since morphological or pixel level segmenta-
tion are not enough to separate them, a block based analysis is performed and a feature
vector is extracted for each block. Finally a SVM is used to classify and separate them.
Examples of original digitized pages and the final output are shown in Fig. 4.
4.1 Preprocessing
The aim of this stage is to focus the analysis on the regions of higher interest, decreasing
the computational load of the next stages. The entire workflow is shown in Fig. 2.
95

Original image
Binarization
(Otsu)
Crop
Blob analysis
Labeling
Small blobs
removal
Frame mask
Filling
T
sb
Fig. 2. Diagram of the preprocessing applied to each image.
The original image is cropped to remove the black border due to the scanning pro-
cess, by measuring the percentage of dark pixels on the current row or column and
moving inward, until it drops under 20%. The cropped image is then binarized with au-
tomatic thresholding, using the Otsu algorithm: this technique proved to be sufficiently
robust to remove the paper background, since the digitalization process is very accu-
rate, and the chromatic range of the spoiling is limited. The connected components of
the image are then labeled and their area is computed in order to extract only large ones,
compatibly with the smallest accepted size for a blob (a thresold T
sb
is fixed at the dou-
ble of the height of a single text line). The contour of each blob is then followed and
then filled. Blobs information are stored in a tree structure to avoid errors in the filling
procedure: the tree is traversed in level-order filling the wider blobs first. The resulting
pixels are used as a mask for the next stages of the processing.
4.2 Block Level Feature Extraction
The image areas, as identified by the preprocessing output mask, are analyzed at block
level, using a sliding window. The window size has been empirically set depending on
the image resolution; in our experiments it was set to 200 × 200 pixels for images of
3894×2792 pixels. To ensure an effective coverage of the images, the window is moved
so to obtain an overlap of 80% of its area between each step. For each block, a set of
color and texture features is extracted; in particular we adopt both RGB Histogram and
Enhanced HSV Histogram as color features, and we propose a new texture descriptor
named Gradient Spatial Dependency Matrix (GSDM). A fusion algorithm based on a
weighted mean between standardized distance values is employed to mix the features
responses. The weights have been automatically tuned by exhaustive search on the train-
ing set aiming at maximizing the F measure, starting from the all equal position, and
allowing a maximum and minimum deviation of 20%.
RGB Histogram. A basic 3D color histogram on the RGB components of the image is
computed. Each component is quantized to 8 values, resulting in a 512-bin histogram.
Each bin of the resulting histogram is then normalized so that they add up to one.
Enhanced HSV Histogram. The idea of this feature is to separately account the chro-
matic and achromatic contribution of pixels. To this aim, 4 bins are added to the stan-
dard MPEG-7 HSV histogram, resulting in a 260-bins descriptor that proved to be more
96

robust to bad quality or poorly saturated images [11]. This representation provides an
advantage with respect to the standard HSV histogram definition because images have
been depicted by hand, so they do not have photographic quality, despite of their high
resolution digitalization.
Gradient Spatial Dependency Matrix. This feature is inspired to the well known Har-
alick’s grey level co-occurrence matrix (GLCM) [12], which provides a representation
of the spatial distribution of grey-scale pixels of the image. Unlike GLCM, we provide
this new representation, which accounts for the spatial distribution of gradients within
the image.
The original image I is convolved with a Gaussian filter with σ = 1. The filtered
image I
gauss
is then used to compute the horizontal and the vertical gradients image
using central differences.
G
x
(x, y) = I
gauss
(x + 1 , y) − I
gauss
(x − 1, y)
G
y
(x, y) = I
gauss
(x, y + 1) − I
gauss
(x, y − 1)
(1)
Gradient images are used to compute the module and the direction for each pixel p:
M(p) =
q
G
x
(p)
2
+ G
y
(p)
2
(2)
D(p) =
(
π
2
if G
x
(p) 6= 0
tan
−1
G
y
(p)
G
x
(p)
+ π
mod π otherwise
(3)
Finally D is uniformly quantized into Q using 8 levels. Said L
x
= {1, 2, . . . , N
x
} and
L
y
= {1, 2, . . . , N
y
} the X and Y spatial domains, and L = L
x
× L
y
the set of pixel
coordinates of the greyscale image I, in order to summarize the relations between the
gradients of neighbor pixels, we start defining C
δ
(i, j) as the set of all point couples
displaced by vector δ, with gradient directions i and j respectively:
C
δ
(i, j) = {r, s ∈ L|Q (r) = i, Q (s) = j, r − s = δ} . (4)
Since we are also interested in the strength of the texture, the magnitude of the gradients
is considered in the final matrix:
P
δ
(i, j) =
X
(r,s)∈C
δ
(i,j)
M (r) + M (s) (5)
In our setup, δ was taken in the set {(1,-1), (1,0), (1,1), (0,1)}, that contains the 4 main
directions {45
◦
, 0
◦
, −45
◦
, −90
◦
} at 1 pixel distance. Concluding, the feature used is
composed by four square matrices with size 8× 8, leading to a 256-dimensional feature
vector.
4.3 Classification with SVM
Support Vector Machines are a common technique for data classification. One remark-
able property of SVMs is that their ability to learn can be independent of the dimen-
sionality of the feature space. In this particular application this is not true. In fact, in
97
Block analysis
Preprocessing
Embedded space
Distance
computation
SVM learning
Training set
Model
Clustering
Prototypes
N
clust
Block analysis
Preprocessing
Embedded space
Distance
computation
Testing set
SVM classification
Results
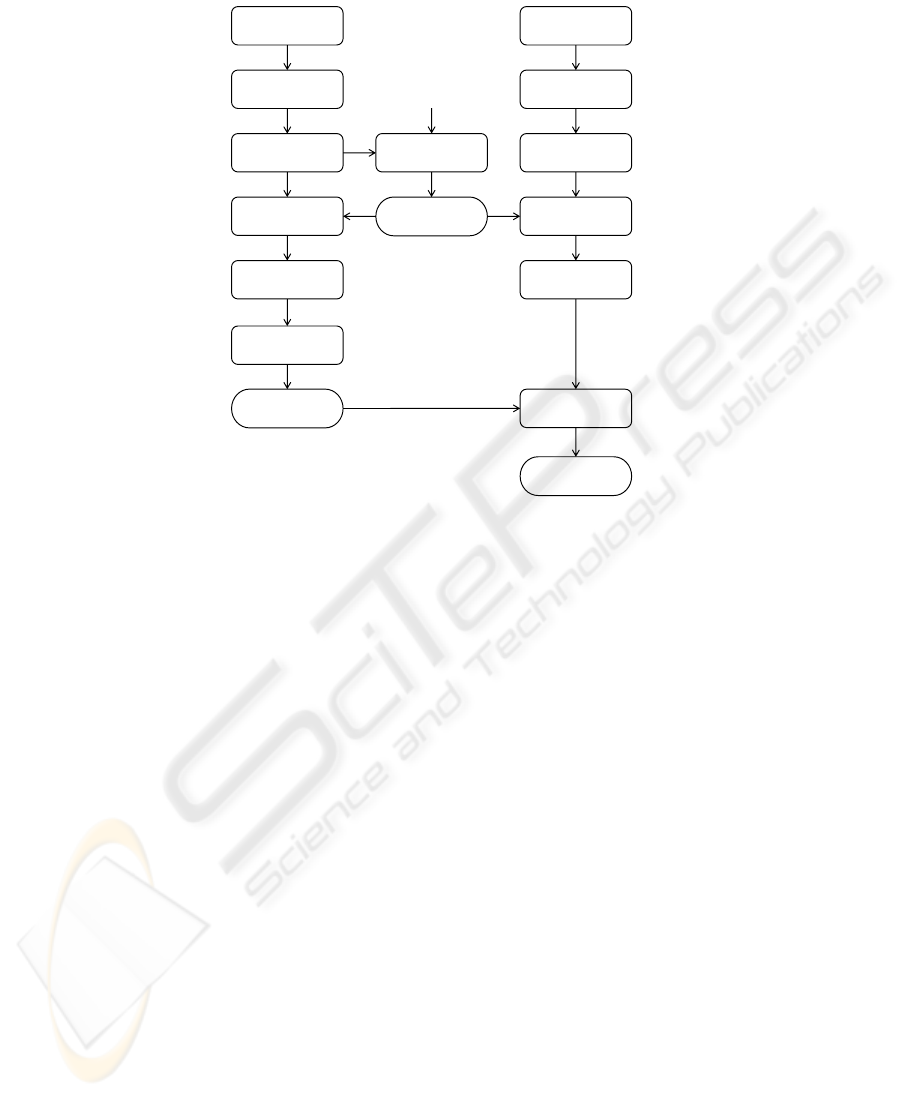
Fig. 3. Diagrams that show the way each image is preprocessed and then analyzed in the learning
and the classification procedures.
order to obtain acceptable performance we had to use a large number of training sam-
ples and these were directly related to the number of features employed. The use of an
RBF kernel, usually providing better performance than linear or polynomial ones, re-
quired unacceptable training times with our training set. Neither a reduction of the size
of the training set with this kernel is acceptable because of lower classification perfor-
mances and overfitting (all training samples where selected as support vectors). Indeed,
a reduction of the training set size would be particularly useful, in face of the final ap-
plication scenario, in which the final user could obtain automatic annotation providing
fewer manual samples, thus reducing his work. The amount of data and the dimension-
ality of feature vectors are challenging problems. A typical example is the similarity
searching, in which we want to find the most similar results to a given query in a CBIR
system. When we work with large datasets, the number of distances evaluations nec-
essary to complete the task could become prohibitive. In order to limit this amount of
computations and at the same time to maintain an acceptable quality of the results, an
embedding approach can be exploited.
The goal is to embed the dataset into a different vector space with a lower dimen-
sionality in such a way that distances in the embedded space approximate distances in
the original space. In a more formal way, given a metric space S with a defined distance
d, an embedding can be defined as a mapping F from (S, d) into a new vector space
(R
k
, δ) where k is the new dimension and δ is the new distance.
98

F : S → R
k
δ : R
k
× R
k
→ R
k
(6)
Given two object o
1
and o
2
, the goal of the embedding approach, as mentioned before,
is to assure that the distance δ(o
1
, o
2
) is as close as possible to d(o
1
, o
2
) in the original
space. In particular, the embedding assures the contractive property if the distances in
the embedding space provides a lower-bound for the corresponding distances in the
original space. We use an embedding approach derived from Lipschitz embeddings: in
order to exploit the distance metric specifically designed for every single feature (or
consequently for every group of features, with simple feature fusion approaches), we
used Complete Link clustering [13].
The final procedure to learn and classify our data blocks, is summarized in Fig. 3:
we separately cluster the positive and negative training samples, in order to select the
most valuable objects which represent the entire sets. These reference examples become
the basis of the new embedded space, and the new coordinates of every element in the
dataset are computed as their distances with the reference objects. Now we can apply
the regular SVM learning stage, obtaining our classifier. The reference objects can now
be used to embed the unknown objects, using the SVM classifier to provide the final
output.
A similar procedure is described in [14], where it is called “mapping onto a dissim-
ilarity space”: they use a Regularized Linear/Quadratic Normal density-based Classi-
fier and compare three criteria to select the representation set, namely random, most-
dissimilar and condensed nearest neighbor.
5 Experimental Results
In this paper, we used the digitalized pages of the Holy Bible of Borso d’Este, which is
considered one of the best Renaissance illuminated manuscript in the world. Tests has
been performed among a dataset of 320 high resolution digitalized images (3894x2792).
These images have been manually annotated, so half of the pages has been used for
training and half for testing. Results are reported in terms of recall and precision.
The granularity of these results has two levels: blocks and blobs. Recall and preci-
sion at blocks level correspond to the raw recall and precision values outputted by the
SVM: based on the ground truth, we labeled each block within the testing set, choosing
a positive annotation if the majority of pixels within the block belongs to a valid picture,
and a negative annotation otherwise. Recall and precision at blobs level are instead com-
puted counting how many blobs have a significant overlap with a corresponding blob in
the ground truth.
We computed recall and precision values with different sets of features, in order to
verify that a higher number of features could effectively contribute to a better classifica-
tion. Each feature defines its own way to compute the similarity: in particular, RGB and
EHSV histograms exploit a histogram intersection approach, while the GSDM feature
performs a sum of point-to-point Euclidean distances between the matrices. These val-
ues are standardized, and then a weighted mean is computed to fuse their results. The
99

Table 1. Comparison using different feature sets.
RGB % eHSV % GSDM % all %
Re
blobs
84.21 81.50 84.21 85.69
P r
blobs
70.33 74.91 57.27 73.36
Re
blocks
68.58 62.85 74.60 75.87
P r
blocks
84.23 87.31 74.23 85.80
Table 2. Comparison with and without the embedding procedure.
Samples 10 000 1 000
Embedding no yes
Re
blobs
% 84.91 85.69
P r
blobs
% 73.28 73.36
Re
blocks
% 74.44 75.87
P r
blocks
% 85.90 85.80
Support Vectors 1075 377
Feature computation time (s) 945 183
Processing time (s) 4521 1425
tests were conducted applying the previously described embedding procedure firstly to
the single features, then to their combination.
Table 1 shows that the addition of different features helps improving the classifi-
cation performance. In particular, simple information about colors in the HSV space
proved to be discriminant enough to distinguish the images from the decorations, since
decorations have a limited palette and a major amount of background pixels. Texture
information help to significantly increase the precision, and a further improvement on
recall values is highlighted. Finally the addition of the RGB histogram seems to pro-
pose a good compromise between recall and precision: it boost precision values with a
minimum loss in recall values.
Above tests has been conducted on a training set of 1000 samples, using the em-
bedding procedure described in Section. 4.2 and with a SVM classification with RBF
kernel. Table 2 shows a comparison between the performance with and without the
embedding, including computation times (in a modern Intel Core2Duo processor). Ex-
perimental results show that by using the embedding approach with only 1000 positive
samples and 1000 negative samples we can obtain similar performances to those ob-
tained by using ten times more samples, spending a lot less time for the computation of
visual features and easing up the classification using less support vectors. This is a great
advantage because it implies that, given a new manuscript to be analyzed, the human
operator can manually annotate only a few pages. This procedure can be also included
into a relevance feedback context: using a limited amount of correction on the results
proposed with a standardly trained system, in a small amount of time good results can
be easily achieved. Some example results are shown in Fig. 4.
100

Fig. 4. Example of segmentation results.
6 Conclusions
This paper described a system for the automatic segmentation of decorations from il-
luminated manuscripts. Starting from the high resolution replicas of the Bible pages, a
preprocess stage focus the processing on the most valuable pixels of the image, then
a sliding window analysis extracts low level color and texture features of each block.
By the application of the described embedding procedure SVM classification provides
good results with less training samples and allows the use of RBF kernels.
References
1. Nagy, G.: Twenty years of document image analysis in PAMI. IEEE Trans Pattern Anal
Mach Intell 22 (2000) 38–62
101

2. Chen, N., Blostein, D.: A survey of document image classification: problem statement, clas-
sifier architecture and performance evaluation. Int J Doc Anal Recogn 10 (2007) 1–16
3. Journet, N., Ramel, J., Mullot, R., Eglin, V.: Document image characterization using a mul-
tiresolution analysis of the texture: application to old documents. Int J Doc Anal Recogn 11
(2008) 9–18
4. Nicolas, S., Dardenne, J., Paquet, T., Heutte, L.: Document Image Segmentation Using a 2D
Conditional Random Field Model. In: Proc Int Conf on Document Analysis and Recognition.
Volume 1. (2007) 407–411
5. Meng, G., Zheng, N., Song, Y., Zhang, Y.: Document Images Retrieval Based on Multiple
Features Combination. In: Proc Int Conf on Document Analysis and Recognition. Volume 1.
(2007) 143–147
6. Kitamoto, A., Onishi, M., Ikezaki, T., Deuff, D., Meyer, E., Sato, S., Muramatsu, T., Kamida,
R., Yamamoto, T., Ono, K.: Digital Bleaching and Content Extraction for the Digital Archive
of Rare Books. In: Proc Int Conf on Document Image Analysis for Libraries. (2006) 133–144
7. Le Bourgeois, F., Trinh, E., Allier, B., Eglin, V., Emptoz, H.: Document Images Analysis
Solutions for Digital libraries. In: Proc Int Workshop on Document Image Analysis for
Libraries. (2004) 2–24
8. Le Bourgeois, F., Emptoz, H.: DEBORA: Digital accEss to BOoks of the RenAissance. Int
J Doc Anal Recogn 9 (2007) 193–221
9. Grana, C., Borghesani, D., Cucchiara, R.: Describing Texture Directions with Von Mises
Distributions. In: Proc Int Conf on Pattern Recognition. (2008)
10. Konidaris, T., Gatos, B., Ntzios, K., Pratikakis, I., Theodoridis, S., Perantonis, S.: Keyword-
guided word spotting in historical printed documents using synthetic data and user feedback.
Int J Doc Anal Recogn 9 (2007) 167–177
11. Grana, C., Vezzani, R., Cucchiara, R.: Enhancing HSV Histograms with Achromatic Points
Detection for Video Retrieval. In: Proc Int Conf on Image and Video Retrieval. (2007) 302–
308
12. Haralick, R.M. and Shanmugam, K. and Dinstein, I.: Textural features for image classifica-
tion. IEEE Trans Syst Man Cybern 3 (1973) 610–621
13. Jain, A., Dubes, R.: Algorithms for clustering data. Prentice-Hall, Inc. (1988)
14. Pekalska, E., Duin, R.P.W.: Dissimilarity representations allow for building good classifiers.
Pattern Recognition Letters 23 (2002) 943–956
102
