
HYBRID DCA-PCA MULTIPLE FAULTS DIAGNOSIS METHOD
Funa Zhou
1,2
, Tianhao Tang
2
and Chenglin Wen
3
1
Computer&Information Engineering School, Henan University, Kaifeng, Henan, China
2
Department of Electrical & Control Engineering, Shanghai Maritime University, Shanghai, China
3
Institute of Information and Control, Hangzhou Dianzi University, Hangzhou, China
Keywords: Unknown fault pattern, Multiple faults, DCA, PCA, Fault diagnosis.
Abstract: As it can avoid the pattern compounding problem of PCA, designated component analysis (DCA) can be
used to implement multiple fault diagnosis for a multivariate process. But designated fault pattern must be
defined in advance, which limited its application in unknown fault diagnosis. In this paper, a hybrid DCA-
PCA method is developed for unknown multiple faults diagnosis. the main idea is: Implement DCA in the
first step. Removing the designated fault pattern from the observation data, then implement PCA to the
residual, and use the first loading vector as the new fault pattern to extend the fault pattern base. In the third
step, implement DCA for the new fault pattern and compute the significance of the new fault pattern.
Simulation for data involved 4 faults shows the efficiency of the progressive DCA fault diagnosis method.
1 INTRODUCTION
Fault diagnosis is critical for large scale system
since failure in a part may cause breakdown of the
system or even disastrous accident (Zhou, 2000).
In general, fault diagnosis methods can be
classified into 3 classes: quantitative model-based
method, qualitative model-based method and
process history based method, also called data
driven method (Venkat,2003, Wen, 2008, Ku, 1995).
With the widely application of DCS and
intelligent instrument in industry field, it is
convenient to acquire and store a large amount of
data on system operation. Since these data isn’t
efficiently used in monitoring, it is not surprise to
face “data rich, information poor” problem. People
are now realizing the significance of data driven
monitoring method (Venkat, 2003, Yue, 2001).
Common used data driven diagnosis method
includes: expert system method, ANN based method
and statistical method (Venkat, 2003, He, 2007).
Among data driven methods, statistical method
seems to have been well studied and applied. And
PCA/PLS based methods are the dominant ones.
These PCA based methods are efficient in abnormal
detection. But pattern compounding effect of PCA
makes it unavailable to fault pattern recognition,
especially for multiple faults diagnosis (Liu, 2002).
DCA is also a multivariate statistical information
extraction method. It can avoid the pattern
compounding problem of PCA, thus can be used to
diagnose multiple faults (Liu, 2002, Zhou, 2009).
But
1) DCA requires all the designated patterns are
orthogonal, which is impractical in most application;
2) DCA diagnosis method is validated only for
those known fault patterns defined in advance.
The first problem has been solved in (Zhou,
2009). This paper focuses on developing a hybrid
DCA-PCA method for unknown fault diagnosis.
2 PCA BASED FAULT
DIAGNOSIS
The essence of PCA is a linear transform
ybv
T
ii
= (1)
Where principal component
i
v is the projection of
observation variable
1
12
[, , , ]
Tp
p
yyy y R
×
=∈"
on loading vector
1
12
[, ,, ]
Tp
iii ip
bbb b R
×
=∈" ,
which is the
ith eigenvector of
y
’s covariance
matrix
y
Σ
. For a sample size of n , equa. (1)
expands into the following matrix form
T
VBY= (2)
where
pn
YR
×
∈
is the observation matrix,
pn
VR
×
∈ is the scoring matrix.
PCA decompose the observation matrix
Y
as a
sum of
p
matrices of rank 1
367
Zhou F., Tang T. and Wen C. (2009).
HYBRID DCA-PCA MULTIPLE FAULTS DIAGNOSIS METHOD.
In Proceedings of the 6th International Conference on Informatics in Control, Automation and Robotics - Intelligent Control Systems and Optimization,
pages 367-370
DOI: 10.5220/0002201103670370
Copyright
c
SciTePress
∑∑
+==
+=
p
mi
T
ii
m
i
T
ii
vbvbY
11
(3)
Where
m is the number of key principal
component selected,
∑
+=
=
p
mi
T
ii
vbE
1
is the residual.
Implement abnormal detection via the statistics
2
T
and
SPE
(MacGregor, 1995, Zhang,2000).
But they can not correctly recognize fault pattern.
3 DCA BASED FAULT
DIAGNOSIS
The designated patterns are defined as
T
ipiii
dddd ],,,[
21
"= , where
ij
d is 0 or 1
determined by the relation between fault and its
symptom(Zhou,2009, Liu, 2004). Then, project
y
on
i
d to get the designated components
ydw
T
ii
= (4)
For a sample size of
n
T
WDY=
(5)
Thus
Y
can also be expressed as sum of
p
matrices of rank 1
1
p
ii
i
Ydw
=
=
∑
(6)
If there are only
pl
≤
variation pattern is
designated, then (Zhou, 2009)
1
l
ii
i
YdwE
=
=+
∑
(7)
Convergence of (7) has been proved in (Zhou,
2009).
Compute the significance of every designated
pattern to determine whether the fault has occurred
%var()/ ()
iiy
Pwtrace=Σ (8)
But DCA is invalidated for unknown faults
diagnosis. A hybrid DCA-PCA method will be
developed to solve this problem.
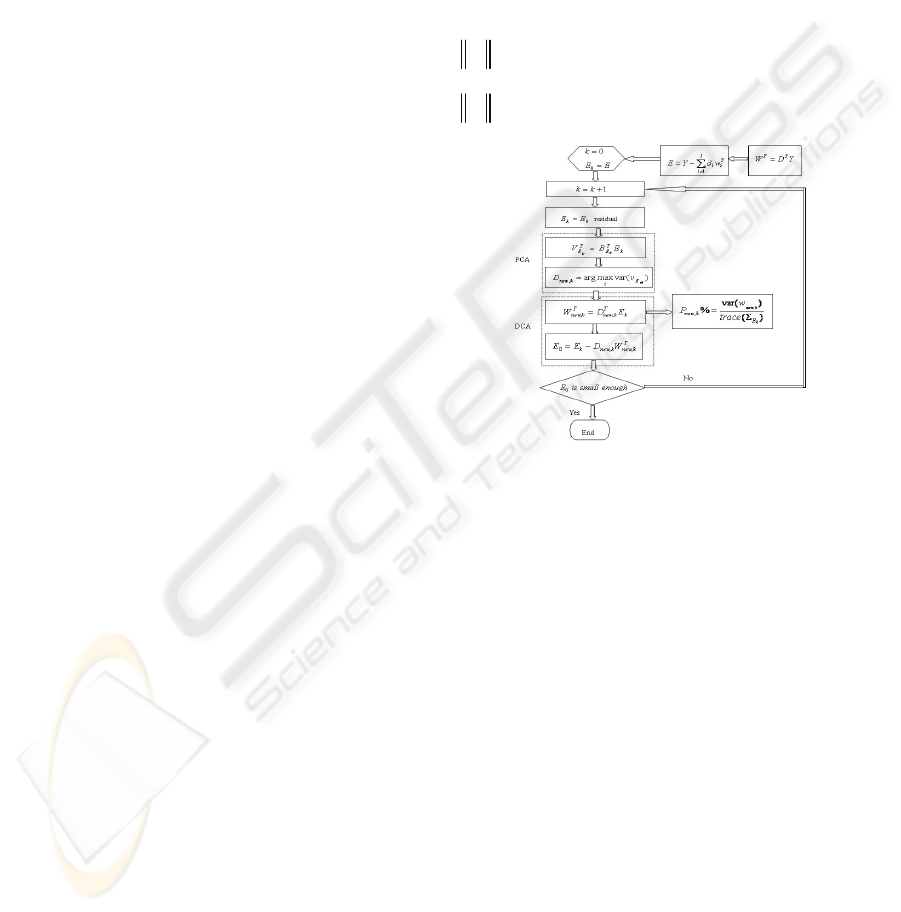
4 HYBRID DCA-PCA MULTIPLE
FAULT DIAGNOSIS METHOD
As it is known to all, PCA is a complete data-driven
method. Although fault pattern PCA revealed makes
no physical sense, it can determine a significant
variation pattern of the abnormal system without any
prior information. In this section, we develop a
hybrid DCA-PCA multiple fault diagnosis method
for the case when unknown new fault occurs.
First, define
l
)( pl
≤
designated pattern as in
(Zhou,2009), and implement DCA to the
observation data; Then, remove the designated
patterns defined in advance from the observation
data to get the residual
E
; Determine whether new
fault is comprised in the residual according to the
energy significance of the residual defined as
F
E
.
1
l
ii
i
EY dw
=
=−
∑
is large in the sense
F
E
δ
> means that new fault occurred.
Figure 1: Hybrid DCA-PCA diagnosis method.
Implement PCA to
E
, and select the first
loading vector as new fault pattern
1,new
D
.
Another round of DCA is carried out for
1,new
D
.
Repeating this process until residual is insignificant.
YDW
TT
=
(9)
1
l
ii
i
EY dw
=
=−
∑
(10)
T
EE
VBE= (11)
)var(max
1,
i
E
i
new
vD
=
(12)
EE
=
1
(13)
,1 1,1 1
T
new new
WDE= (14)
2 1 ,1 ,1new new
EEDW=− (15)
22
2
T
EE
VBE=
(16)
)var(max
22,
i
E
i
new
vD
=
(17)
#
ICINCO 2009 - 6th International Conference on Informatics in Control, Automation and Robotics
368
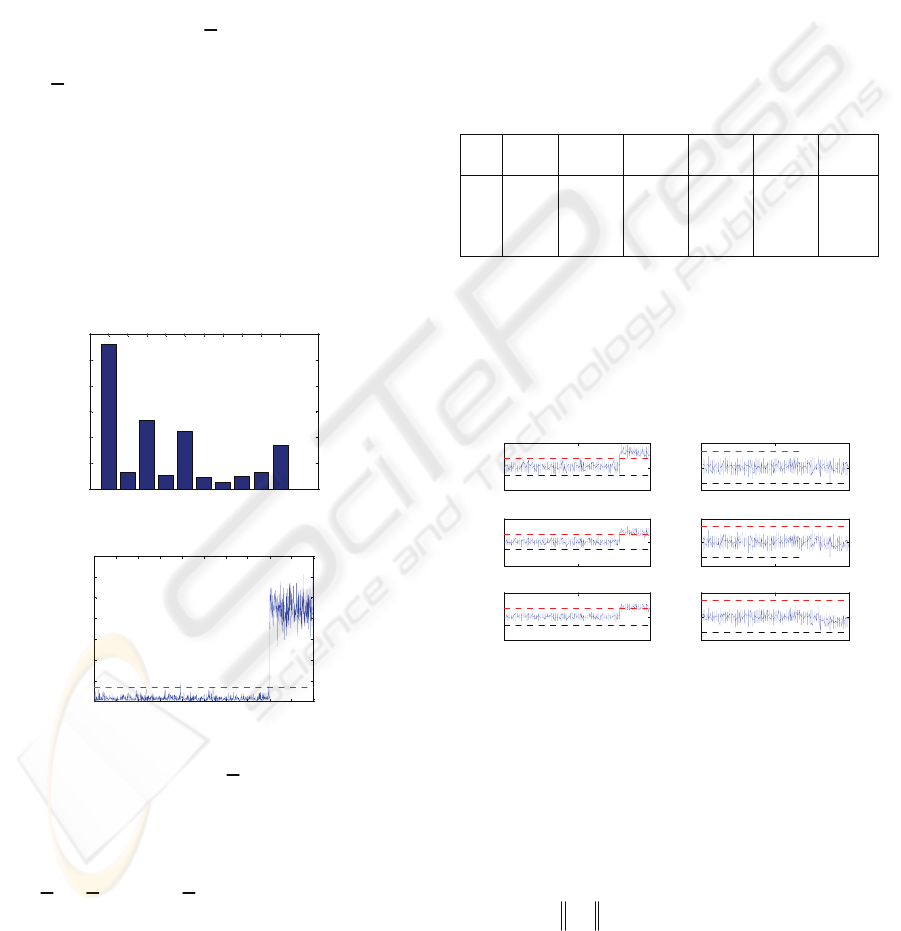
Figure 1 depicts the hybrid DCA-PCA multiple
fault diagnosis process.
5 SIMULATIONS
Simulations parameters used are: 15
=
p ,
1000=n , 6=l .
The observation data is generated by the
composition of 10 variation patterns
10
1
ii
i
Ydw
=
=
∑
(18)
Where
2
~(0, )
ii
wN
σ
is the simulated designated
component,
1p
i
dR
×
∈
)10,,2,1( "
=
i are the 10
variation patterns to generate observation data
Y
.
figure 2 depicts the contribution of each
i
d to
Y
.
The first 6 pattern
61
,, dd " are the designated
pattern we selected,
531
,, ddd is the fault pattern,
10
d is a fault pattern unconsidered in advance.
1 2 3 4 5 6 7 8 9 10
0
1
2
3
4
5
6
Figure 2: DC values for Generating observation.
0 100 200 300 400 500 600 700 800 900 1000
0
5
10
15
20
25
30
35
95% c ont rol li mit
Figure 3: SPE chart for PCA.
For normal observation,
i
w can be generated in
MATLAB using “randn” and some linear operation
For fault case,
13510
,,,dddd are amplified
from sampling time 801 to 1000
5var( )
ii i
ww w=+
1, 3, 5, 1 0i =
(19)
5.1 PCA based Fault Diagnosis
The SPE chart of PCA are shown in figure 3. Figure
3 indicates that system considered is abnormal from
801st sample point. However, SPE chart can not tell
what faults occur.
5.2 Hybrid DCA-PCA Multiple Faults
Diagnosis
Implement DCA to the observation, and illustrate
the significance of each designated pattern in table 2.
From table 2, we can see that, the fist, the third and
the fifth variation pattern are the 3 significant ones
of the 6 designated patterns. According to the
significance of the observation to each designated,
we can conclude that faults corresponding to these 3
designated patterns have occurred in the system.
Table 2: Significance of the designated pattern in D.
1
d
2
d
3
d
4
d
5
d
6
d
%
i
d
0.41
23
0.036
8
0.1946
0.035
9
0.1839
0.037
8
Figure 6 draws the Shewhart chart of every
designated component in. It indicates that the 1
st
, 3
rd
,
and 5
th
designated component’s Shewhart chart
exceed the control limit from 801 to 1000. Figure 6,
confirms that faults corresponding to the 1
st
, 3
rd
, and
5
th
designated patterns have occurred in the system.
0 500 1000
-1 0
0
10
the 1s t dc
LCL
UCL
0 500 1000
-5
0
5
the 2nd dc
LCL
UCL
0 500 1000
-1 0
0
10
the 3 dc
LCL
UCL
0 500 1000
-5
0
5
the 4th dc
LCL
UCL
0 500 1000
-1 0
0
10
the 5th dc
LCL
UCL
0 500 1000
-5
0
5
the 6th dc
LCL
UCL
Figure 6: Shewhart chart for 6 DC.
For the case 15
=
p , 1000=n and 6=l ,
statistical result of more than 100 times
simulation shows that the threshold is reasonable
10
=
δ
(20)
Removing the 6 designated variation pattern to
get the residual
0
E . The norm of the residual is
0
12.7524
F
E
δ
=
>
(21)
It is possible that at least one new fault is still
included in the residual. Implement PCA to the
residual
0
E , and take the first load vector as a new
HYBRID DCA-PCA MULTIPLE FAULTS DIAGNOSIS METHOD
369
fault pattern. Then implement DCA to
0
E for
1new
d . And compute its significance
6083.0%
1
=
new
d (22)
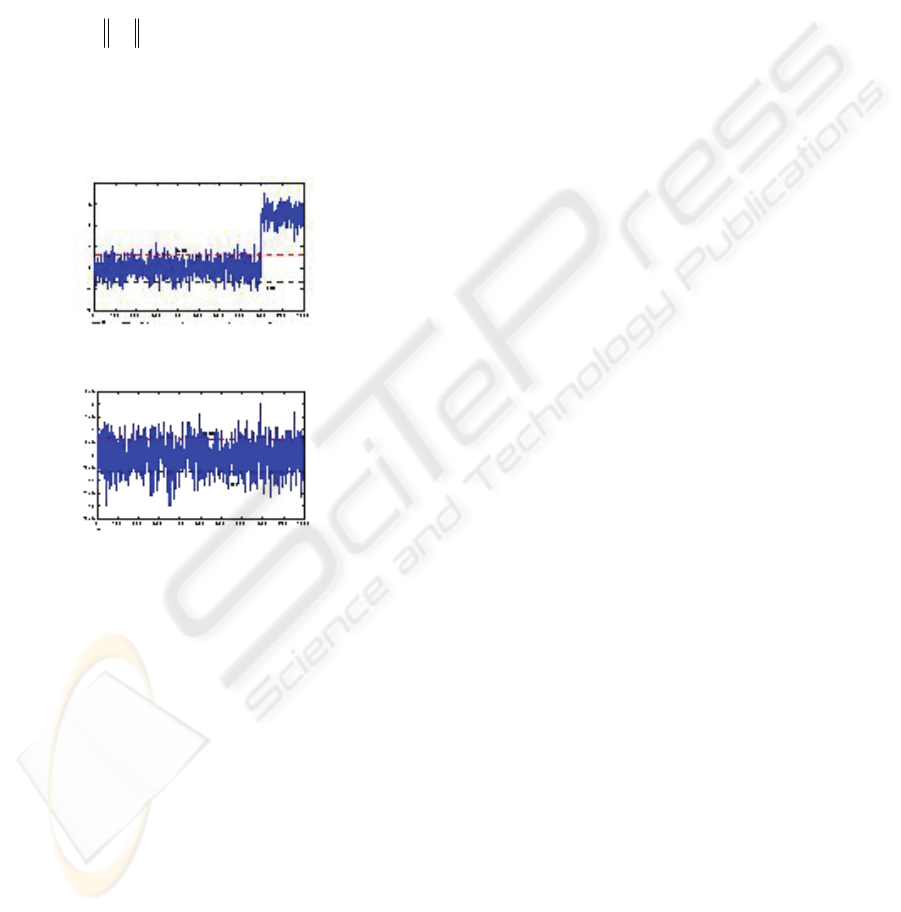
The Shewhart chart of this new designated
component is depicted in figure 7. Figure 7 tells us
that fault corresponding to
1new
d has occurred in the
system. Removing the new fault pattern
1new
d from
0
E we have the residual of this DCA step
1
7.2042
F
E = (23)
To the residual
1
E , Shewhart chart for the
secondnew designated component, figure 8 is within
the control limit, which will confirm that
10
=
δ
is
reasonable
Figure 7: Shewhart chart for the 1
st
new dc.
Figure 8: Shewhart chart for the 2
nd
new dc.
From the above simulation research, we can
conclude that
1
d ,
3
d ,
5
d and
10
d occurred in the
system. This is basically the same as the simulation
manner that we used to generate
Y
.
6 CONCLUSIONS
DCA can avoid pattern compounding problem of
PCA. But it is invalidated for unknown faults
diagnosis. In this paper, a hybrid DCA-PCA method
for unknown multiple fault diagnosis.
Some data driven methods other than PCA can
be used to the residual to estimate the new fault
pattern to make it physical sense.
ACKNOWLEDGEMENTS
This paper is supported by NSFC (60804026);
International cooperation project of Zhejiang
(2006C24G2040012), Natural science fund of
Henan (2009A510001) International cooperation
project of Henan (094300510043), Key disciplines
of Shanghai Municipality (J50602), Development
Project (08YZ109) from Shanghai Municipal
Education Commission.
REFERENCES
Donghua Zhou, Yinzhong Ye, 2000. Modern fault
diagnosis and tolerant control[M], Beijing, Qstinghua
Publishing House (in Chinese).
Venkat Venkatasubramanian, Raghunathan Rengaswamy,
Kewn Yin, Surya N. Kavuri,2003. A review of process
fault detection and diagnosis Part I[J]: quantitative
model-based methods. Computers and Chemical
Engineering 27 (2003):pp293-311.
Qingbo He, 2007. Application Multivariate statistical
analysis in machine state monitoring and diagnosis
[D], PHD thesis, University of Science and
Technology of China (in Chinese).
Yue H H, Qin S J, 2001. Reconstruction based fault
identification using a combined index. Industrial and
Engineering Chemistry Research[J], 40(20): 4403-
4414
J.F. MacGregor and T. Kourtl, 1995. Statistical process
control of multivariate processes[J], Control Fag.
Practice, VoL 3, No. 3, pp. 403-414.
Yegang Liu, 2002. Statistical control of multivariate
processes with applications to automobile body
assembly (D). PHD, University of Michigan.
Jie Zhang, Xianhui Yang. Multivariate statistical
control[M], Beijing, Chemistry Industry Publishing
House, 2000 (in Chinese).
Funa Zhou, Chenglin Wen, Tianhao Tang, 2009. DCA
based multiple faults diagnosis method, accepted by
ACTA AUTOMATICA SINICA (in Chinese).
Chenglin Wen, Jing Hu, Tianzhen Wang, Zhiguo Chen.
RPCA and it’s application in data compression and
fault diagnosis, ACTA AUTOMATICA SINICA
34(9) : 1128-1139 (in Chinese).
Ku, W., Storer, R.H., and Georgakis,C, 1995. Disturbance
detection and isolation by dynamic principal
component analysis [J], Chemometrics and Intelligent
Laboratory Systems, 30:179-196.
ICINCO 2009 - 6th International Conference on Informatics in Control, Automation and Robotics
370
