
FATIGUE RECOGNITION USING EMG SIGNALS AND
STOCHASTIC SWITCHED ARX MODEL
Hiroyuki Okuda, Fumio Kometani, Shinkichi Inagaki and Tatsuya Suzuki
Nagoya University, Furo-cho, Chikusa-ku, Nagoya, Japan
Keywords:
Human fatigue, Hybrid system, Electro Myo-Gram, Recognition.
Abstract:
The man-machine cooperative system is attracting great attention in many fields, such as industry, welfare
and so on. The assisting system must be designed so as to accommodate the operator’s skill, which might
be strongly affected by the fatigue. This paper presents a new fatigue recognizer based on the Electro Myo-
Gram (EMG) signals and the Stochastic Switched ARX (SS-ARX) model which is one of the extended model
of the standard Hidden Markov Model (HMM). Since the SS-ARX model can represent complex dynamical
relationship which involves switching and stochastic variance, it is expected to show higher performance as
the fatigue recognizer than using simple statistical characteristics of the EMG signal and/or standard HMM.
The usefulness of the proposed strategy is demonstrated by applying to a peg-in-hole task.
1 INTRODUCTION
The man-machine cooperative system is attracting
great attention in many fields, such as manufacturing,
medicine, welfare and so on. The main purpose of
assisting system is to reduce physical burden of the
operator. Since a human skill is strongly affected by
fatigue of the operator, the assisting system must be
designed so as to accommodate with the change of
skill characteristics caused by fatigue. To meet this
requirement, fatigue must be detected and evaluated
based on some quantitative manner. One of the ba-
sic ideas to evaluate the degree of fatigue is to mea-
sure physiological signals, such as the density of lac-
tic acid in blood. This approach, however, requires
the operator to stop the task, to take special examina-
tion and to be injured for sampling.
Recently, Electro Myo-Gram (EMG) signal is rec-
ognized as a promising one to measure the degree
of physical fatigue without any special examination.
EMG signal can be easily detected by only putting
the probe on surface of the corresponding muscle.
The relationship between the fatigue and the change
of features such as Muscle Fiber Conduction Veloc-
ity (MFCV), magnitude, spectrum of EMG and so
on are reported (Sadoyama and Miyano, 1981; Lip-
pold et al., 1960; Arendt-Nielsen and Mills, 1988;
D. K. Kumar and Bradley, 2003). Although these
previous researches enable us to characterize the re-
lationship between fatigue and the statistical charac-
teristics of the EMG signal, their applications have
been restricted in simple monotonous motion because
those measures are developedunder the Maximal Vol-
untary Contraction (MVC) condition. If the target
task is more complex, fatigue recognition based on
these features turns difficult cause of large variance
of the measured signals in dynamic motion. To over-
come this problem, a model-based approach, which
can reflect the effect of the dynamic motion, must be
exploited for the fatigue recognition.
22
a
12
a
21
a
13
a
31
a
33
a
23
a
32
a
11
a
,t
T
tt
ey
22
+= θφ
,t
T
tt
ey
11
+= θφ
,t
T
tt
ey
33
+= θφ
Figure 1: SS-ARX model (three states).
This paper presents a new fatigue recognizer
based on the EMG signals and the Stochastic
Switched ARX (SS-ARX) model. The SS-ARX
model (Sekizawa et al., 2007) can be regarded as an
extension of standard Hidden Markov Model (HMM)
wherein each Auto Regressive eXogenous (ARX)
model is embedded in each discrete state of the
202
Okuda H., Kometani F., Inagaki S. and Suzuki T. (2009).
FATIGUE RECOGNITION USING EMG SIGNALS AND STOCHASTIC SWITCHED ARX MODEL.
In Proceedings of the 6th International Conference on Informatics in Control, Automation and Robotics - Robotics and Automation, pages 202-207
DOI: 10.5220/0002205502020207
Copyright
c
SciTePress
HMM. In the proposed framework, we pay attention
not only to the measured signal itself but also to the
dynamic relationship between the EMG signals and
motion, i.e. movement of the tool. Since the SS-
ARX model can represent complex dynamics, which
involves switching and stochastic variance, it is ex-
pected to show higher performance as the fatigue rec-
ognizer using standard HMM. This advantage is more
emphasized when the target task becomes much more
complex. Furthermore, we demonstrate the useful-
ness of the proposed strategy by applying to a peg-in-
hole task. A comparison with standard HMM is also
discussed.
2 STOCHASTIC SWITCHED ARX
MODEL
SS-ARX model is defined as the system wherein one
autoregressive exogenous (ARX) models is switched
to the other one according to the state transition prob-
ability(Sekizawa et al., 2007). Figure 1 shows the SS-
ARX model with three states.
This model can be regarded as the model wherein
each ARX model is embedded in each discrete state
of standard HMM. In the following, the definition
and three important problems of the SS-ARX model
are briefly reviewed (see detail in (Sekizawa et al.,
2007)).
2.1 Parameters in SS-ARX Model
The parameters in SS-ARX model are specified as
follows:
• S
i
: Discrete state (i=1,2,···,N)
• a
ij
: State transition probability (i=1,2, ··· ,N; j=
1,2,··· ,N)
• π
i
: Initial state probability (i=1,2,··· , N)
• θ
i
: Parameters in ARX assigned to S
i
(i =
1,2,··· ,N)
• σ
i
: Variance of equation error e
i,t
in ARX model
assigned to S
i
(i=1,2, ··· ,N)
N denotes the number of discrete states. We denote
the set of parameters in the SS-ARX model by λ=
(π
i
,a
ij
,θ
i
,σ
i
).
2.2 Three Fundamental Problems
To address several fundamental problems listed be-
low, the measured signal and its occurrence probabil-
ity are defined for SS-ARX model as follows: First
of all, a measured signal o
l,t
at time t is defined as
combination of the output y
l,t
and the regressor ψ
l,t
,
that is, o
l,t
=(y
l,t
,ψ
l,t
). Where l is index of observed
sequences, i.e. the index of trials. Then, its occur-
rence probability b
i
(o
l,t
) is defined by assumption of
the Gaussian distribution of the equation error, and is
given by
b
i
(o
l,t
) =
1
√
2πσ
i
exp
(
−
(θ
T
i
ψ
l,t
−y
l,t
)
2
2σ
2
i
)
. (1)
Based on these definitions, the following three
fundamental problems can be addressed for SS-ARX
model.
1. Evaluation problem
The probability P(O
l
|λ) that the measured signal
sequence O
l
=(o
l,0
,o
l,1
, ··· , o
l,t
, ··· , o
l,T
) occurs
from the model λ=(π
i
,a
ij
,θ
i
,σ
i
), that probability
is called as likelihood, is calculated. This prob-
lem can be solved by applying Forward algorithm
(Rabiner, 1989).
2. Decoding problem
The most likely underlying state se-
quence s = (s
l,0
,s
l,1
,··· , s
l,t
,··· , s
l,T
), which
yields the measured signal sequence
O
l
= (o
l,0
,o
l,1
,··· , o
l,t
,··· , o
l,T
), is found for
the model λ=(π
i
,a
ij
,θ
i
,σ
i
). This state estimation
can be realized by applying Viterbi algorithm
(Rabiner, 1989).
3. Estimation problem
The model parameter λ = (π
i
,a
ij
,θ
i
,σ
i
),
which gives the highest occurrence prob-
ability for the measured signal sequence
O
l
=(o
l,0
,o
l,1
,··· , o
l,t
,··· , o
l,T
), is estimated.
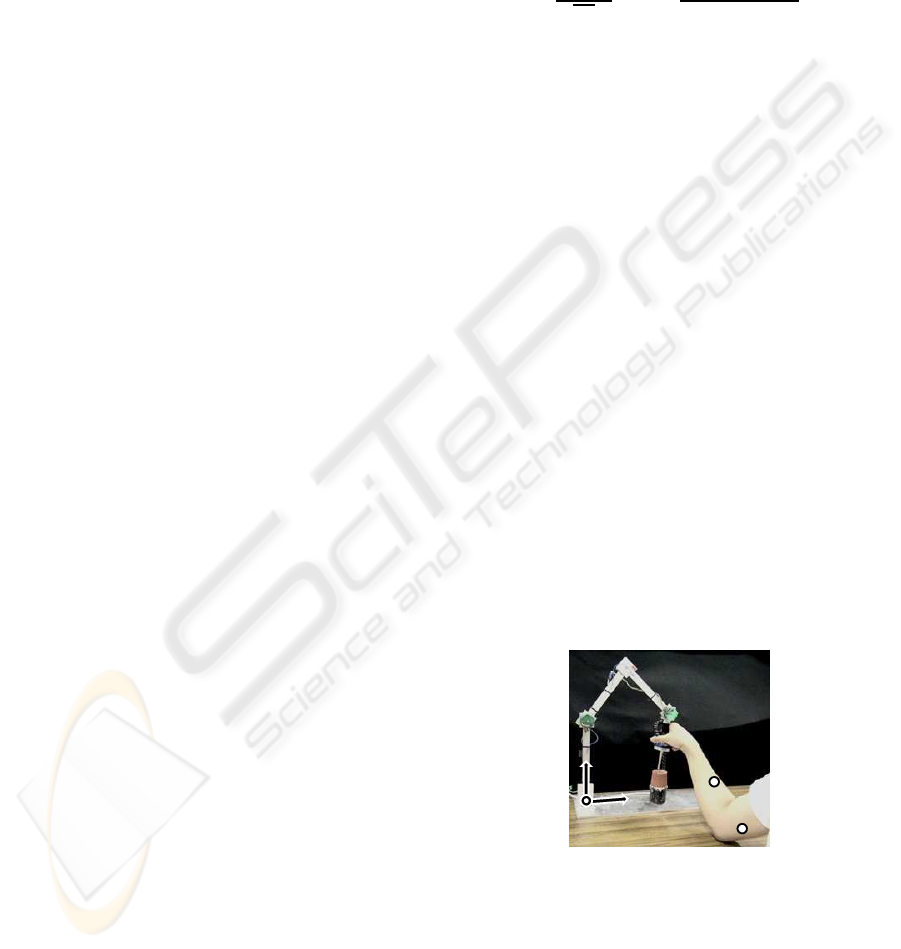
EMG1
EMG2
X
Z
Y
Figure 2: Data acquisition of peg-in-hole task.
The solution for problems 1 and 2 are same as
ones for standard HMM. However, the parameter es-
timation algorithm for the SS-ARX model requires
some extension to the one for standard HMM. The
concrete parameter estimation algorithm for the SS-
ARX model can also be derived based on the EM al-
gorithm. The resulting parameter update law of θ
θ
θ
i
is
FATIGUE RECOGNITION USING EMG SIGNALS AND STOCHASTIC SWITCHED ARX MODEL
203
given as follows:
θ
′
i
=
(
T
∑
t=0
L
∑
l=1
k
l
ψ
l,t
ψ
T
l,t
α(l,i,t)β(l, i,t)
)
−1
×
(
T
∑
t=0
L
∑
l=1
k
l
ψ
l,t
y
l,t
α(l,i,t)β(l, i,t)
)
(2)
where k
l
is defined by 1/P(O
l
|λ), and α(l,i,t) and
β(l, i,t) are the forward probability and the backward
probability of SS-ARX model, which resemble them
of HMM respectively. Other update laws and its
derivation are written in our previous study (Sekizawa
et al., 2007).
Note that this model is applicable not only to the
linear dynamics but also to a certain class of nonlinear
dynamics, which may include switching mechanism.
This benefit strongly motivatesus to apply to the mod-
eling and recognition of complex human skill.
3 EXPERIMENT SETUP AND
DATA ACQUISITION
The fatigue recognizer is realized using SS-ARX
model, and applied to the peg-in-hole task shown in
Fig. 2. The peg-in-hole task is widely known as the
typical skill which involves the switching in the dy-
namics caused by change of the contact configuration
(Hirana et al., 2004; Ricker et al., 1996). In this work,
the peg is supposed to move only on X −Z plane. The
mechanical arm in Fig. 2 provides no assisting force.
As shown in Fig. 2, examinee holds the peg by grasp-
ing the end of the arm. There is no clearance between
the rubber hole and peg. This implies that much force
is required to accomplish the peg insertion. The ex-
aminees execute the task following the scenario de-
picted in Figure 3.
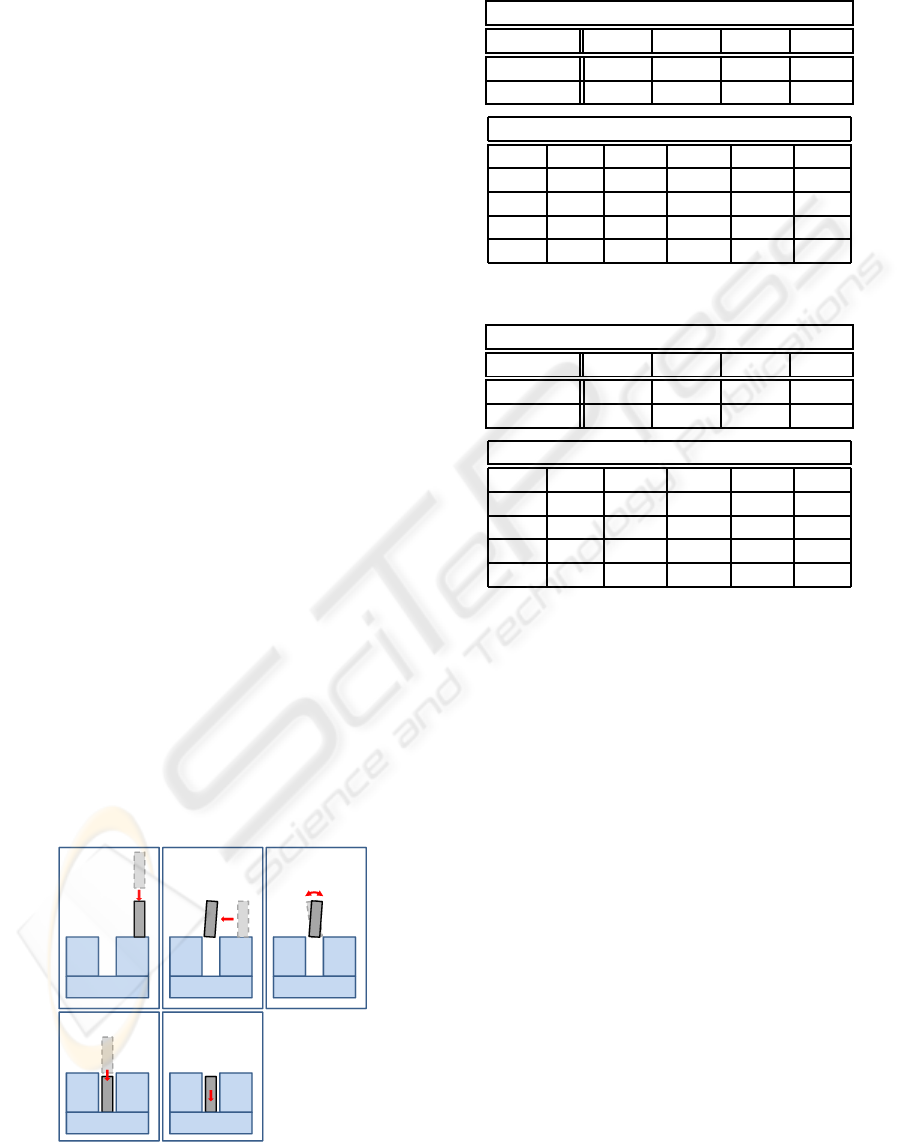
Hole
HoleHole
Hole
Peg
PegPeg
Peg
Contact
Sliding
Up righting
Step. I Step. II Step. III
Terminate
Step. V
Insert
Step. IV
Figure 3: Typical motion of peg.
Table 1: Model parameters of examinee A (case of non-
fatigue).
State transition probability
a
ij
i = 1 i = 2 i = 3 i = 4
j = i 0.962 0.956 0.959 1
j = i + 1 0.038 0.044 0.041 0
ARX-model parameters
θ
i1
θ
i2
θ
i3
θ
i4
σ
i
state1 0.404 0.134 0.042 0.549 0.005
state2 0.466 -0.166 0.031 0.472 0.006
state3 0.961 -0.088 0.006 -0.012 0.010
state4 0.189 -0.008 -0.014 0.014 0.004
Table 2: Model parameters of examinee A (case of fatigue).
State transition probability
a
ij
i = 1 i = 2 i = 3 i = 4
j = i 0.978 0.923 0.950 1
j = i + 1 0.022 0.077 0.050 0
ARX-model parameters
θ
i1
θ
i2
θ
i3
θ
i4
σ
i
state1 0.945 -0.091 0.006 0.052 0.007
state2 1.071 0.347 0.229 -0.200 0.013
state3 0.984 0.029 -0.056 -0.021 0.005
state4 0.180 0.002 0.040 0.003 0.003
Step. I The peg goes down vertically until it con-
tacts with the surface of stage.
Step. II The peg slides to top of hole on the surface
with keeping contact.
Step. III The operator uprights the peg for preparing
the insertion.
Step. IV The peg is inserted firmly to the end of the
hole.
Step. V Terminate.
Furthermore, the operators are well trained so as
to be able to ignore the effect of experiences. The data
for parameter estimation and recognition are acquired
by the procedure shown in Fig. 4.
As a whole, twenty five data are acquired for ver-
ification of recognition. Examinees are expected to
be more fatigued in the latter trials. Three examinees
followed this procedure.
During the experiment, the position of the peg p
Z
and two EMG signals at different locations shown in
Fig. 2 (Extensor carpi ulnaris and Triceps brachii
muscle) are measured every 1[msec]. The reason why
these muscles are chosen is that these are well related
with a force along with direction of peg insertion. The
ICINCO 2009 - 6th International Conference on Informatics in Control, Automation and Robotics
204
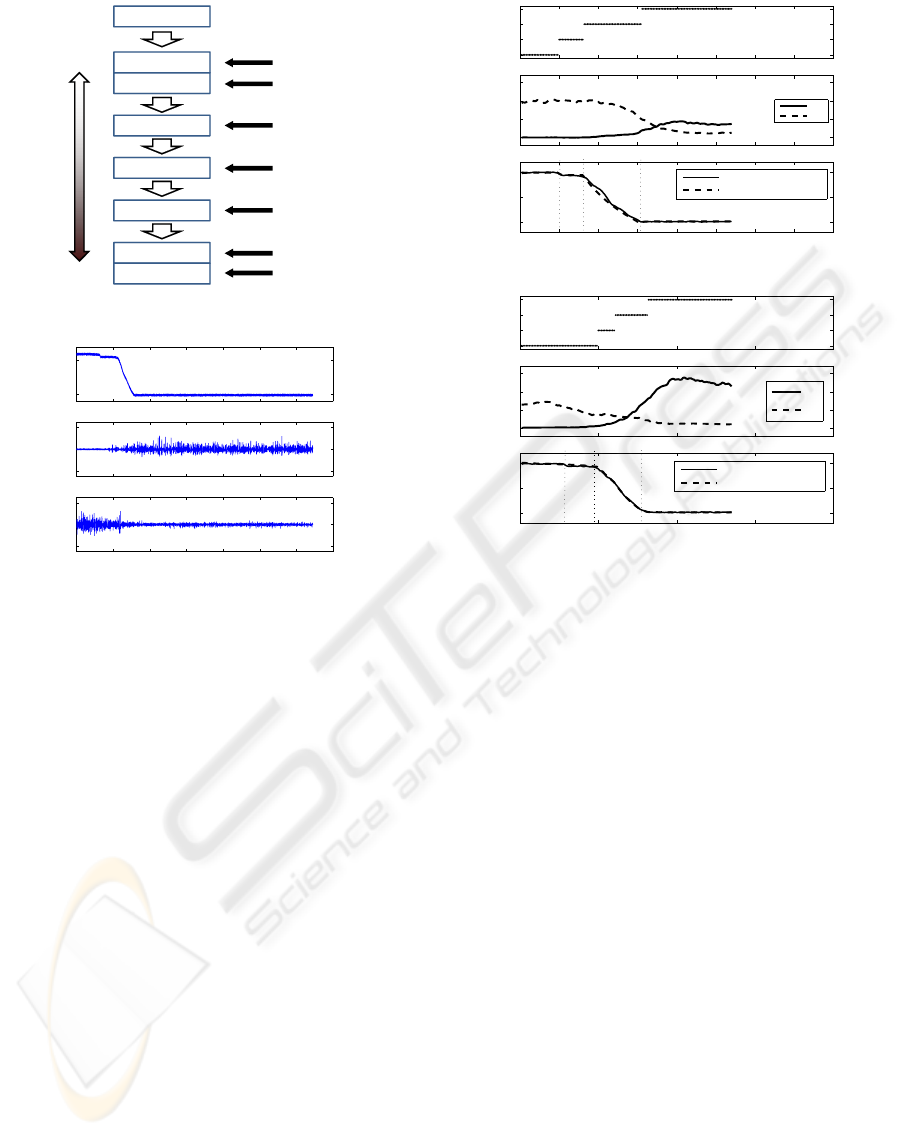
3 trials
5 trials
3 trials
Training
5 trials
5 trials
5 trials
5 trials
Enough rest
Fifty trials are executed
Less
Much
Fatigue
Data set NF
Data 1-5
Data 6-10
Data 11-15
Data 16-20
Data 21-25
Data set F
Fifty trials are executed
Fifty trials are executed
Fifty trials are executed
Figure 4: Data acquisition procedure.
0 1 2 3 4 5 6 7
100
150
p
z
0 1 2 3 4 5 6 7
1.8
2
2.2
EM G
1
0 1 2 3 4 5 6 7
1.8
2
2.2
EM G
2
Time [sec]
Figure 5: Example of signals EMG
1
, EMG
2
and p
Z
(exam-
inee A, case of non-fatigue).
EMG signals are amplified with a gain of 1000 (Bio-
metrics Ltd; SX230). Examples of measured EMG
signals are shown in Fig. 5 together with p
Z
.
In addition, the EMG signals are transformed to
feature values by using the moving integral and nor-
malized using the minimum and maximum values in
trial 1 of Dataset NF, and also decimated by 20. In
the following, E
1
and E
2
are used to denote the nor-
malized feature values of the EMG
1
and EMG
2
, re-
spectively.
4 PARAMETER ESTIMATION
RESULTS
In this section, the parameters of SS-ARX model are
estimated based on learning data and the parame-
ter update algorithm described in section 2. First of
all, the signals and parameters appearing in the ARX
model in the state k are defined as follows:
y
t
=p
Z
(t) (3)
ψ
t
={p
Z
(t −1),E
1
(t −1),E
2
(t −1),1} (4)
θ
T
k
={θ
k1
,θ
k2
,θ
k3
,θ
k4
} (k = {1, 2, ··· ,N}) (5)
θ
θ
θ
k
is the coefficient vector in the ARX model at
0 0.5 1 1.5 2 2.5 3 3.5 4
1
2
3
4
State
transition
0 0.5 1 1.5 2 2.5 3 3.5 4
0
0.5
1
1.5
E
1
and E
2
E
1
E
2
0 0.5 1 1.5 2 2.5 3 3.5 4
0
0.5
1
p
Z
Time [sec]
Measured by sensor
Calculated by model
II
III
IV
V
(a) Case of non-fatigue
0 1 2 3 4
1
2
3
4
State
transition
0 1 2 3 4
0
0.5
1
1.5
E
1
and E
2
E
1
E
2
0 1 2 3 4
0
0.5
1
p
Z
Time [sec]
Measured by sensor
Calculated by model
II
III
IV
V
(b) Case of fatigue
Figure 6: State transition, feature value of EMG, and
p
Z
(examinee A).
state k. For reduction of the computational burden
and complexity, the analysis is restricted in the mo-
tion along Z-axis which requires much more muscle
force than other direction in the insertion task. Fur-
thermore, the number of states is set to be N = 4 by
try and error, and the left-to-right SS-ARX model is
adopted.
The parameters of SS-ARX model of non-fatigue
case, λ
NF
is estimated using Data set NF. On the
other hand, the parameters of SS-ARX model of fa-
tigue case, λ
F
is estimated using Data set F. 500
sets of initial parameters for the SS-ARX model were
tested in the parameter estimation algorithm to find
semi-optimal parameters. The parameter estimation
results are shown in Tables 1 and 2.
Although we can see big difference in parameters
between two models, this is partly because the physi-
cal meaning of the state in each model differs.
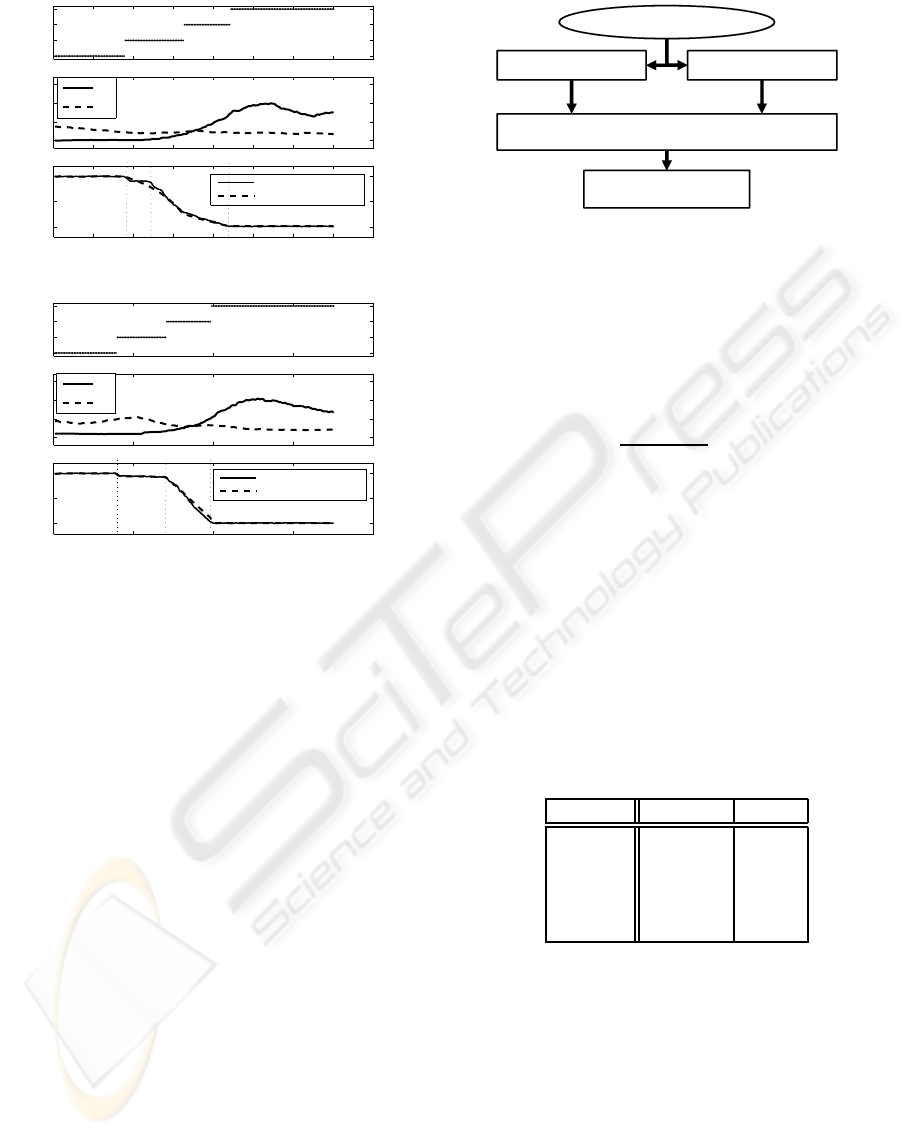
In Figs. 6 and 7, the estimated state transition, nor-
malized feature values of EMG signals, and the com-
parison between the observed p
Z
and calculated one
using the estimated model are depicted from the top.
The top figure represents the estimated state transi-
tion using Viterbi algorithm (Note that the state tran-
sition is not measured explicitly in our framework).
The bottom figure indicates that the observed output
FATIGUE RECOGNITION USING EMG SIGNALS AND STOCHASTIC SWITCHED ARX MODEL
205
0 0.5 1 1.5 2 2.5 3 3.5 4
1
2
3
4
State
transition
0 0.5 1 1.5 2 2.5 3 3.5 4
0
0.5
1
1.5
E
1
and E
2
E
1
E
2
0 0.5 1 1.5 2 2.5 3 3.5 4
0
0.5
1
p
Z
Time [sec]
Measured by sensor
Calculated by model
II
III
IV
V
(a) Case of non-fatigue
0 1 2 3 4
1
2
3
4
State
transition
0 1 2 3 4
0
0.5
1
1.5
E
1
and E
2
E
1
E
2
0 1 2 3 4
0
0.5
1
p
Z
Time [sec]
Measured by sensor
Calculated by model
II
III
IV
V
(b) Case of fatigue
Figure 7: State transition, feature value of EMG, and
p
Z
(examinee B).
agree well with the calculated output. Thus, the accu-
racy of the SS-ARX model can be verified.
Also, the steps in the motion of the peg (II to V)
are superimposed in the bottom figure. Intuitively, the
state transition scenario must be associated with the
switching occurred in the real task. Thus, we can see
that the state definition of λ
F
is different from one
of λ
NF
. In addition, we can see the big difference in
the profiles of the E
1
and E
2
in the case of examinee
A, however, the differences are not clear in the case
of examinee B as shown in Fig. 7. In this case, it
seems almost impossible to discriminate fatigue and
non-fatigue cases only by looking at the profiles of
E
1
and E
2
and the state transition in each case. How-
ever, Since the SS-ARX model explicitly includes the
dynamic relationship between E
1
, E
2
and p
Z
, the fa-
tigue recognition can be realized even in such a case
as shown in the next section.
5 FATIGUE RECOGNITION
In this section, fatigue is recognized using the two
models estimated in the previous section. The log-
likelihood values of the measured data over the two
Results
Fatigue or Non-fatigue
No fatigue model ( λ
NF
)
Fatigue model ( λ
F
)
Recognition
Observation
P(O
l
|λ
NF
) P(O
l
|λ
F
)
DLL = log{P(O
l
| λ
NF
)}-log{P(O
l
| λ
F
)}
Figure 8: Proposed Recognition Scheme
models are computed and compared to recognize the
degree of fatigue of examinee. The illustrative dia-
gram of the proposed scheme is shown in Fig. 8. The
degree of fatigue of each examinee is evaluated by
the difference of two log-likelihood values (denoted
by DLL) given as follows:
DLL = log
P(O
l
|λ
NF
)
P(O
l
|λ
F
)
= log{P(O
l
|λ
NF
)}−log{P(O
l
|λ
F
)} (6)
where O
l
is the measured sequence. log{P(O
l
|λ)},
which is log-likelihood of the measured sequence
over the model, can be easily calculated by using For-
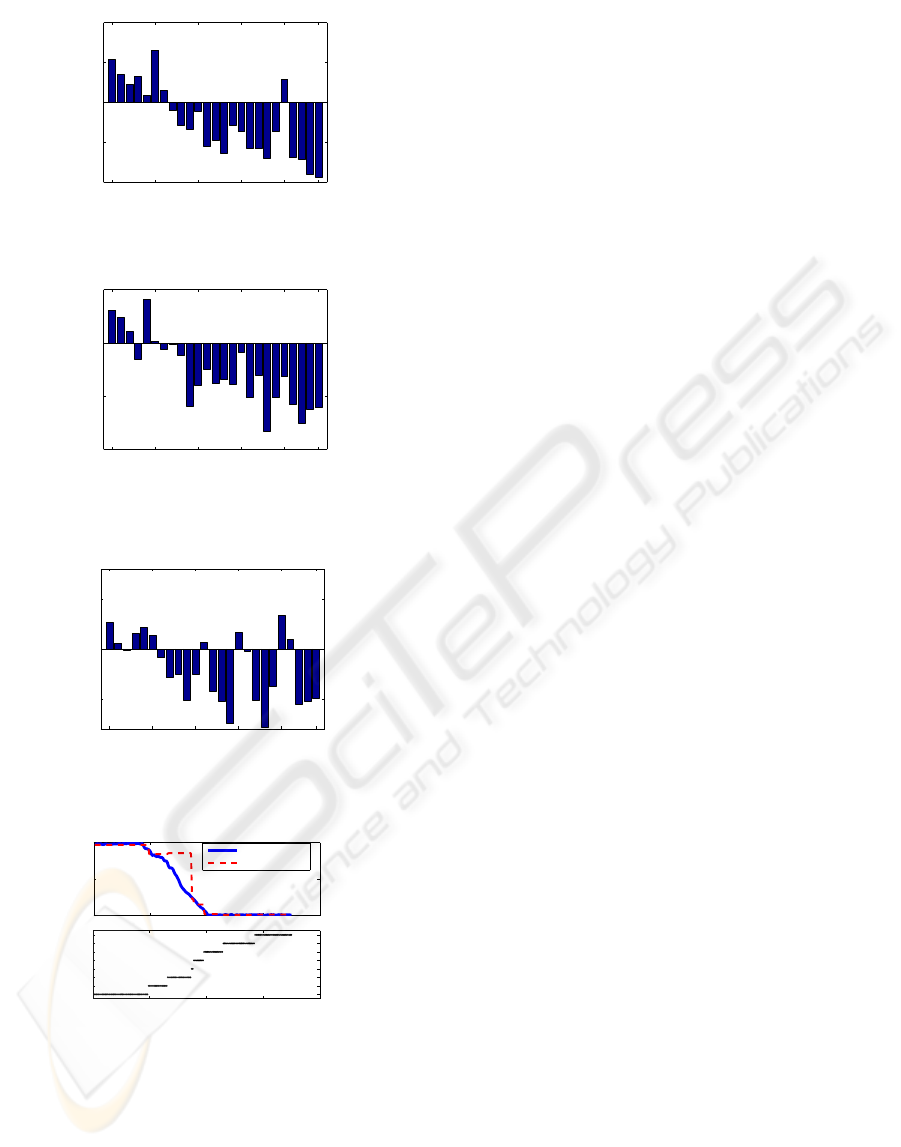
ward algorithm introduced in section 2.
We can see the clear tendency that the DLL goes
down according to increase of the trial number. In ad-
dition, the trial when the DLL across zero is regarded
as the turning point from ‘non-fatigue trial’ to ‘fatigue
trial’. Thus, the degree of fatigue of the examinee can
be evaluated in quantitative manner.
Table 3: Correlation r between the DLL and trial number.
Exam. SS-ARX HMM
Exam.A -0.80 -0.77
Exam.B -0.83 -0.25
Exam.C -0.77 -0.62
Exam.D -0.62 -0.65
Exam.E -0.93 -0.85
Finally, some discussions on the comparison with
the standard HMM are given in the following. For the
comparison, the number of states of the HMM were
set to 8 (left-to-right structure), although the proposed
SS-ARX model has 4 states. In the numerical exper-
iments, the 4-state HMM did not work at all as the
fatigue recognizer. The measured signals E
1
, E
2
and
p
Z
were vector quantized by using 32 symbols. Here,
a correlation of five examinees between the DLL and
data number, which is regarded as a typical index to
evaluate the relationship between the DLL and degree
of fatigue, is calculated and shown in Table 3. This
result implies that the growth of DLL calculated by
ICINCO 2009 - 6th International Conference on Informatics in Control, Automation and Robotics
206
1 6 11 16 21 25
-400
-200
0
200
400
Trial Number
DLL
Figure 9: DLL of examinees A.
1 6 11 16 21 25
-200
-100
0
100
Trial Number
DLL
Figure 10: DLL of examinees B.
1 6 11 16 21 25
-2
0
2
x 10
4
Trial Number
DLL
Figure 11: DLL of examinee B(in the case of HMM).
0 1 2 3 4
0
0.5
1
p
z
Measured by sensor
Calculated by model
0 1 2 3 4
1
2
3
4
5
6
7
8
State
transition
Time [sec]
Figure 12: p
Z
and state transition of trial 1 of examinee B(in
the case of HMM).
SS-ARX has stronger correlation with the increase of
trial number compared with that of standard HMM
(except examinee D.) This comes from the fact that
the HMM cannot capture the accurate dynamic char-
acteristics underlying the measured signals compared
with the SS-ARX model.
The recognition performances of the standard
HMM and the SS-ARX model are comparedusing the
profile of examinee B in the following. The recogni-
tion result of the HMM of examinee B is shown in
Fig. 11. Also, the calculated p
Z
and estimated state
transition obtained by Viterbi algorithm are shown in
Fig. 12.
In Fig. 11, obtained DLL does not related to trial
number apparently. According to this result, it is al-
most impossible to discriminate between fatigue tri-
als and non-fatigue trials. Therefore, the degree of
fatigue does not seem to be recognized by standard
HMM for examinee B.
6 CONCLUSIONS
This paper has presented a new fatigue recognizer
based on the EMG signals and the stochastic switched
ARX (SS-ARX) model. Since the SS-ARX model
can represent complex dynamics which involves
switching and stochastic variance, high performance
as the fatigue recognizer was achieved. And the use-
fulness of the proposed strategy was demonstrated by
applying to a peg-in-hole task. The design of adap-
tive assisting system which can accommodate with
the change of skill characteristics caused by fatigue
is our future work.
REFERENCES
Arendt-Nielsen, L. and Mills, K. (1988). Muscle fibre con-
duction velocity, mean power frequency, mean emg
coltage and force during submaximal fatiguing con-
tractions of human quadriceps.
D. K. Kumar, N. D. P. and Bradley, A. (2003). Wavelet anal-
ysis of surface electromyography to determine muscle
fatigue.
Hirana, K., Suzuki, T., and Okuma, S. (2004). Formula-
tion and motion planning of the peg-in-hole task with
mixed logical dynamical system theory.
Lippold, O., Ledfean, J., and Vuco, J. (1960). The elec-
tromyography of fatigue.
Rabiner, L. (1989). A tutorial on hidden markov models and
selected applications in speech recognition. In Proc.
of the IEEE, Vol. 77, No. 2, pp. 257-286.
Ricker, S., Sarkar, N., and Rudie, K. (1996). A discrete-
event systems approach to modeling dextrous manip-
ulation.
Sadoyama, T. and Miyano, H. (1981). Frequency analysis
of surface emg to evaluation of muscle fatigue.
Sekizawa, S., Inagaki, S., Suzuki, T., Hayakawa, S.,
Tsuchida, N., Tsuda, T., and Fujinami, H. (2007).
Modeling and recognition of driving behavior based
on stochastic switched arx model.
FATIGUE RECOGNITION USING EMG SIGNALS AND STOCHASTIC SWITCHED ARX MODEL
207
