
PERIODIC DISTURBANCES REDUCTION IN THE
CONTINUOUS CASTING PROCESS BY MEANS OF A
MODIFIED SMITH PREDICTOR
Karim Jabri, Alain Mouchette, Bertrand Bèle
MC Department, ArcelorMittal Research, Maizières-Lès-Metz, France
Emmanuel Godoy, Didier Dumur
Control Department, Supélec, Gif-sur-Yvette, France
Keywords: Smith predictor, Continuous casting, Periodic disturbances, H-infinity framework.
Abstract: In the continuous casting process, various control strategies are used to reduce the mold level fluctuations
which cause surface defects in the final product. This paper proposes a control structure able to improve the
reduction of the bulging effect on the mold level. It is based on the Aström’s modified Smith predictor
scheme which presents the advantage that the setpoint response is decoupled from the disturbance rejection
transfer function.
∞
H control theory is utilized to develop the controller of this second loop. Both the
disturbances rejection and the robust stabilization are considered in this design. Effective tuning rules are
also given. Simulation results confirm that the proposed design is more effective than the one based on the
PID control law currently implemented in several real plants.
1 INTRODUCTION
In the steel industry, the continuous casting is the
most used process to solidify the steel. Mold level
control strategies are a key factor in ensuring the
quality of the final product. Real implementation
remains however complex because the controllers
have to take into consideration the process
uncertainties, the operating point changes and the
disturbances affecting the casting. In order to lower
the level fluctuations, several control theories have
been applied in recent years. Some of them are
already implemented at real plants. For example, an
adaptive control law has been used to improve the
mold level control accuracy (Kurokawa et al., 1992).
Matoba et al. applied the LQ control in the case of
low speed casters (Matoba et al., 1990). In the
present paper, a new control design is proposed
aiming at reducing the bulging effect on the mold
within a guaranteed delay margin. The performances
are compared to those of the currently implemented
PID control law.
The paper is structured as follows. Next section
describes the continuous casting machine, the
phenomena disturbing the casting operations and
presents the plant model and the PID control law
implemented in the plants. Section III examines the
Smith predictor and its modified version. Based on
this one, the control structure designed using
∞
H
framework is presented. Section IV validates in
simulation the proposed structure showing its
efficiency compared to PID.
2 CONTINUOUS CASTING
MACHINE
2.1 Process Description
As shown in Figure 1, in the continuous casting
machine, molten steel flows from the ladle through
the tundish into the mold. The steel is solidified in
the mold cooled by the water. A solidified shell is
thus formed and continuously withdrawn out of the
mold until the outlet of the machine where the steel
fully solidified is cut into pieces used by different
manufacturing processes.
110
Jabri K., Mouchette A., Bèle B., Godoy E. and Dumur D. (2009).
PERIODIC DISTURBANCES REDUCTION IN THE CONTINUOUS CASTING PROCESS BY MEANS OF A MODIFIED SMITH PREDICTOR.
In Proceedings of the 6th International Conference on Informatics in Control, Automation and Robotics - Signal Processing, Systems Modeling and
Control, pages 110-115
DOI: 10.5220/0002206901100115
Copyright
c
SciTePress
Ladle
Mold
Tundish
Rolls
N
ozzle
Stopper rod
Figure 1: Continuous casting machine.
The steel level in the mold is a balance between
the flows in and out of the mold. In order to regulate
it, the actuator moves the stopper rod vertically to
control the flow into the mold while the casting
speed is kept constant. The controller uses also a
sensor which measures only local level variations.
During casting operations, several disturbances
occur and affect all the parts of the machine
including the mold level regulation loop. The
following two kinds of disturbances are dominant
(Jabri et al., 2008a).
2.2 Disturbances
The main disturbance considered here is the bulging
which occurs between rolls due to increasing
pressure inside the strand. Its profile is strongly
affected by the roll pitch and lightly by the cooling
conditions. Unsteady bulging generates important
level fluctuations in the mold (Yoon et al., 2002).
Frequencies of this phenomenon appear to be in the
range of 0.03-0.1Hz.
Other disturbances take place as the slow phase
of clogging followed by a sudden unclogging that
raises considerably the mold level (Thomas and Bai,
2001). There are also stationary surface waves of
molten steel in the mold. Their frequencies depend
on the mold width and are between 0.65 and 0.85Hz.
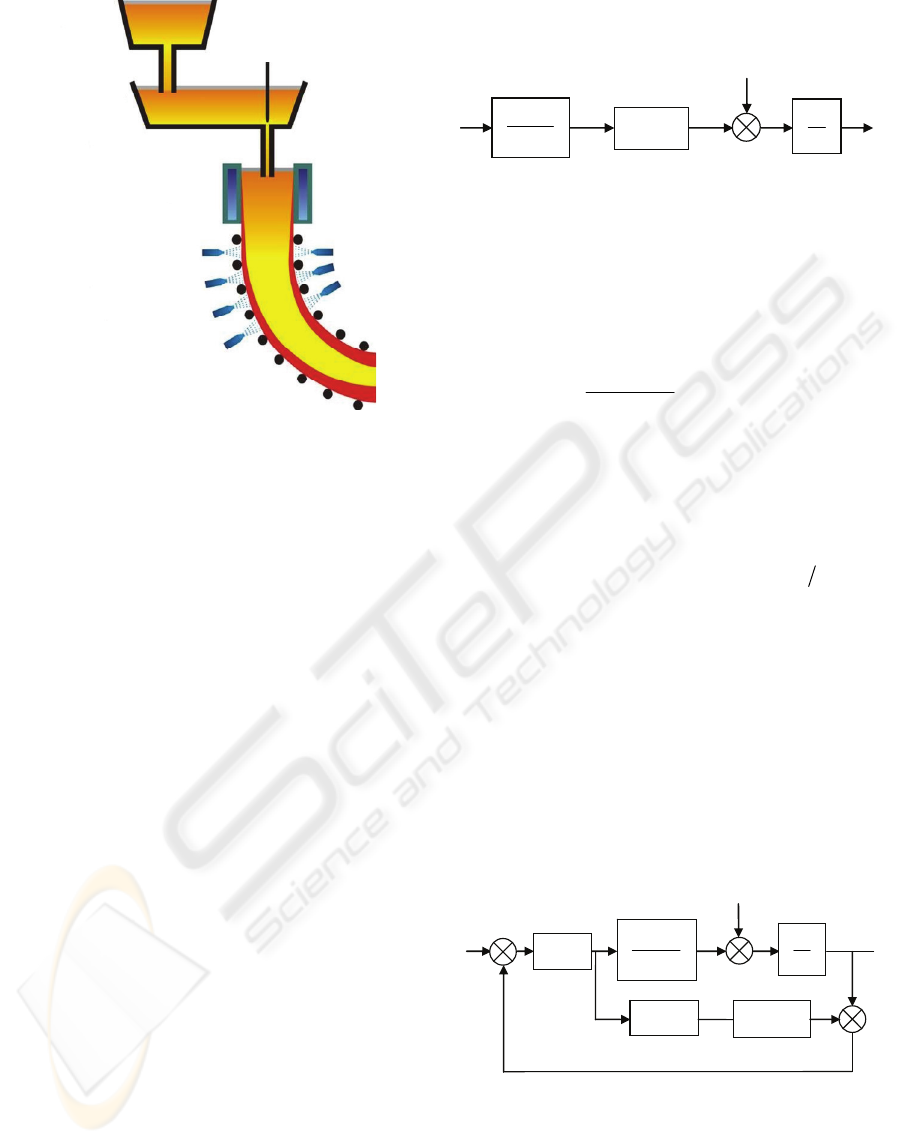
2.3 Plant model
Considering the description above and neglecting
the level sensor dynamics, the plant model
classically used for the design of the main control
law is shown in Figure 2, with
*
P
the control input,
P
the stopper position, N the mold level,
in
Q and
out
Q the flow-rate into and out of the mold.
s
a
τ
+1
1
s
n
n
eG
τ
-
Ss
1
*
P
P
in
Q
out
Q
N
+
-
Figure 2: Plant model.
The parameters of the transfer functions
appearing in the plant model are:
a
τ
the actuator
time constant,
n
G the stopper gain,
n
τ
the nozzle
delay,
S the mold section and
s
the Laplace varia-
ble. The process transfer function is thus given by:
s
a
s
n
n
n
eH
sSs
eG
H
τ
τ
τ
−
−
=
+
=
0
)1(
(1)
In the plants, the mold level is often regulated by
means of a PID controller which is not sufficient for
bulging rejection. This current control strategy will
be further used for comparison purposes. The tuning
parameters are as follows, where the time constant
of the derivative action filter is given by
β
d
T :
10s 2.0s 938.0 ==
=
=
β
di
TTK
3 SMITH PREDICTOR
CONTROL
3.1 Conventional Smith Predictor
The Smith predictor is widely used for the control of
systems with time delays. It is a highly effective
dead-time compensator especially for stable
processes whose time delay is known (Figure 3).
)(sC
s
eG
a
s
n
n
τ
τ
+
−
1
Ss
1
*
N
ε
*
P
in
Q
out
Q
N
-
+
-
+
+
+
)(
0
sH
s
n
e
τ
−
−1
Figure 3: Conventional Smith predictor.
As shown in the equation below where
0
H is the
delay free part of the plant model, the main
advantage of the Smith predictor is that the delay is
eliminated from the closed loop equation:
PERIODIC DISTURBANCES REDUCTION IN THE CONTINUOUS CASTING PROCESS BY MEANS OF A
MODIFIED SMITH PREDICTOR
111
s
n
e
sHsC
sHsC
N
N
τ
−
+
=
)()(1
)()(
0
0
*
(2)
If the flow out of the mold
out
Q is equal to zero,
the steady state error for a constant setpoint is equal
to zero too because the open loop contains an
integral term. However, the steady state error
imposed by a constant flow out of the mold
considered as a disturbance is not equal to zero
because at low frequencies, its Laplace transform is
given by:
out
n
s
out
s
Q
Q
S
Q
sHsCSs
esHsC
Ns
n
τ
ε
τ
0
0
0
))()(1(
1)1)(()(
)(
→
−
∝
+
+−−
=−=
(3)
In order to avoid this problem, several authors
have suggested modifications to the original Smith
predictor. Lim et al., 1990 proposes an extension
based on the introduction of an additional feedback
containing
nn
G
τ
in parallel with
)()(
0
sHsH
−
.
Although this structure cancels the steady state error,
it does not allow users to tune the disturbances
rejection which is a key factor in mold level control.
The following paragraph describes the solution
proposed by Aström to overcome this problem with
the capability of shaping the frequency
characteristics of the disturbances rejection (Chen et
al., 2007).
3.2 Aström’s Modified Smith Predictor
In (Aström et al., 1994), a two-degree of freedom
modified Smith predictor is presented for first order
integrative processes with dead time as shown in
Fig. 4. The Astrom’s Smith predictor decouples the
disturbance response from the setpoint one and
therefore can be independently optimized.
Therefore, we can tune the performance of either
setpoint tracking (through the transfer function
)(sC ) or disturbance rejection (through the transfer
function
)(sM ) without affecting the other.
C
s
eG
a
s
n
n
τ
τ
+
−
1
Ss
1
*
N
ε
in
Q
out
Q
N
-
+
-
+
-
+
0
H
+
s
n
e
τ
−
M
*
P
+
Figure 4: Aström’s modified Smith predictor.
In this configuration, the setpoint response is
given by:
s
n
e
sHsC
sHsC
N
N
τ
−
+
=
)()(1
)()(
0
0
*
(4)
and the disturbance response is given by:
)1(
1
0
s
out
n
eMHSs
Q
N
τ
−
+
−
=
(5)
In this work, the Aström’s Smith predictor
structure is used to reduce the influence of the
bulging on the mold level.
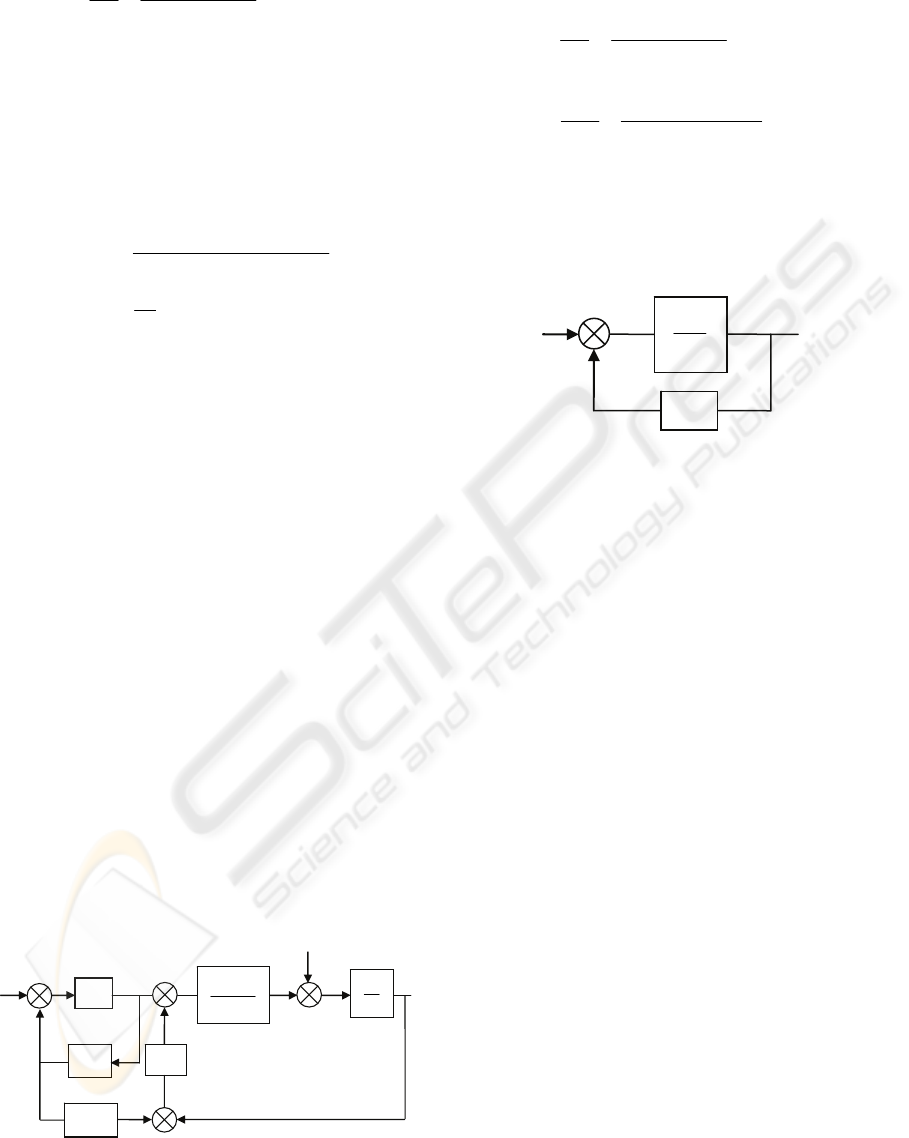
In (Guanghui et al., 2007), the proposed block
diagram
)(sM
is the following where )(
0
sM is the
transfer function containing the tuning parameters:
0
0
H
M
H
+
+
Figure 5: Proposed M(s) scheme.
Some tuning rules are given for )(
0
sM in order
to eliminate the steady state error with a step
disturbance. Unfortunately, this design does not
improve the bulging rejection. Moreover, it uses the
identification results of the gain and the delay and
depends thus upon uncertainties on these two
parameters.
Other simple forms of
)(sM , e.g. first order
function, have been investigated without success. In
this paper,
∞
H control theory is used to shape the
disturbance response by adjusting
)(sM . Finally,
the main controller
)(sC is chosen constant which is
sufficient to tune the closed loop response time.
3.3 M Design using
∞
H
Control
Theory
For simplicity reasons, Figure 6 shows only the
disturbance rejection loop. In order to achieve the
foregoing specifications, a
∞
H control problem,
described in Figure 7 and Figure 8, is established
(Zhang
et al., 1991). A second disturbance W
(which represents the standing waves actually) was
added to the initial bulging rejection loop to be able
to solve the
∞
H problem which requires several
assumptions. In the proposed scheme, two weighting
functions have been introduced. The first one
1
W is
chosen to reduce the bulging effect on the level. The
second one
2
W is tuned in order to achieve robust
stability under delay changes and uncertainties.
ICINCO 2009 - 6th International Conference on Informatics in Control, Automation and Robotics
112
Ss
1
M
s
eG
a
s
n
n
τ
τ
+
−
1
-
-
N
out
Q
Figure 6: Disturbance rejection loop.
According to Figure 8, it comes:
⎩
⎨
⎧
+=
+=
WsBsWQsBsWe
WsBsWQsBsWe
out
out
)()()()(
)()()()(
2222122
1211111
(6)
with
⎪
⎪
⎪
⎪
⎩
⎪
⎪
⎪
⎪
⎨
⎧
−+
=
+
−
=
++
−
=
−
=
+
−
=
)1()1(
)1()1()1(
1
1
)1(
11
22
0
21
1211
MH
M
s
G
B
MH
MH
MH
M
sSs
G
B
MH
B
MHSs
B
a
n
a
n
τ
τ
Considering the state space formalism of the
process described in Figure 7, the
∞
H control
problem is formulated as follows:
γ
≺
∞
⎟
⎟
⎠
⎞
⎜
⎜
⎝
⎛
)()()()(
)()()()(
222212
121111
sBsWsBsW
sBsWsBsW
(7)
M
Process
⎭
⎬
⎫
2
1
e
e
*
P
w
N
⎩
⎨
⎧
W
Q
out
Figure 7: Standard
∞
H problem.
In order to approximate the time delay effect, the
first order Pade function is used.
Since the bulging is described by a sinusoidal
function with a frequency band between 0.03 and
0.1Hz,
)(
11
sB should have a weak magnitude over
this frequency range. First,
1
W is thus selected so
that its gain is high over bulging frequencies and
high enough on the low frequency band in order to
eliminate the steady state error. In this work
1
1
−
W is
chosen as a phase lead compensator:
sTa
sT
KW
ww
w
w
11
1
1
1
1
1
1
+
+
=
−
with: 1
1
≺
w
a
(8)
Secondly,
2
W is tuned using the small gain
theorem in order to achieve robust stability under
delay changes. In fact, if the time delay changes less
than
n
τ
Δ
(this upper bound is assumed to be
known), the bulging rejection loop is stable if:
1
1
≺
∞
Δ
+
−
MH
HM
(9)
with
Δ
a multiplicative uncertainty given by:
)1(
Δ
+
=
HH
a
and
1−=Δ
⋅Δ s
n
e
τ
(10)
Knowing that:
00
HeHH
s
n
==
−
τ
(11)
(9) is equivalent to:
1
1
21
0
≺
∞
∞
Δ=Δ
+
−
B
MH
MH
(12)
As
Δ
satisfies the following inequality:
ωτ
ωτ
ω
j
j
j
n
n
⋅Δ+
⋅Δ
Δ
1
2
)( ≺
(13)
2
W is then chosen as:
ωτ
ωτ
ω
j
j
jW
n
n
⋅Δ+
⋅Δ
1
2
)(
2
(14)
The two filters
1
W and
2
W should be calculated
from equations (8) and (14). Finally, the
∞
H
problem is solved using the Glover-Doyle’s
algorithm (Glover et al., 1988).
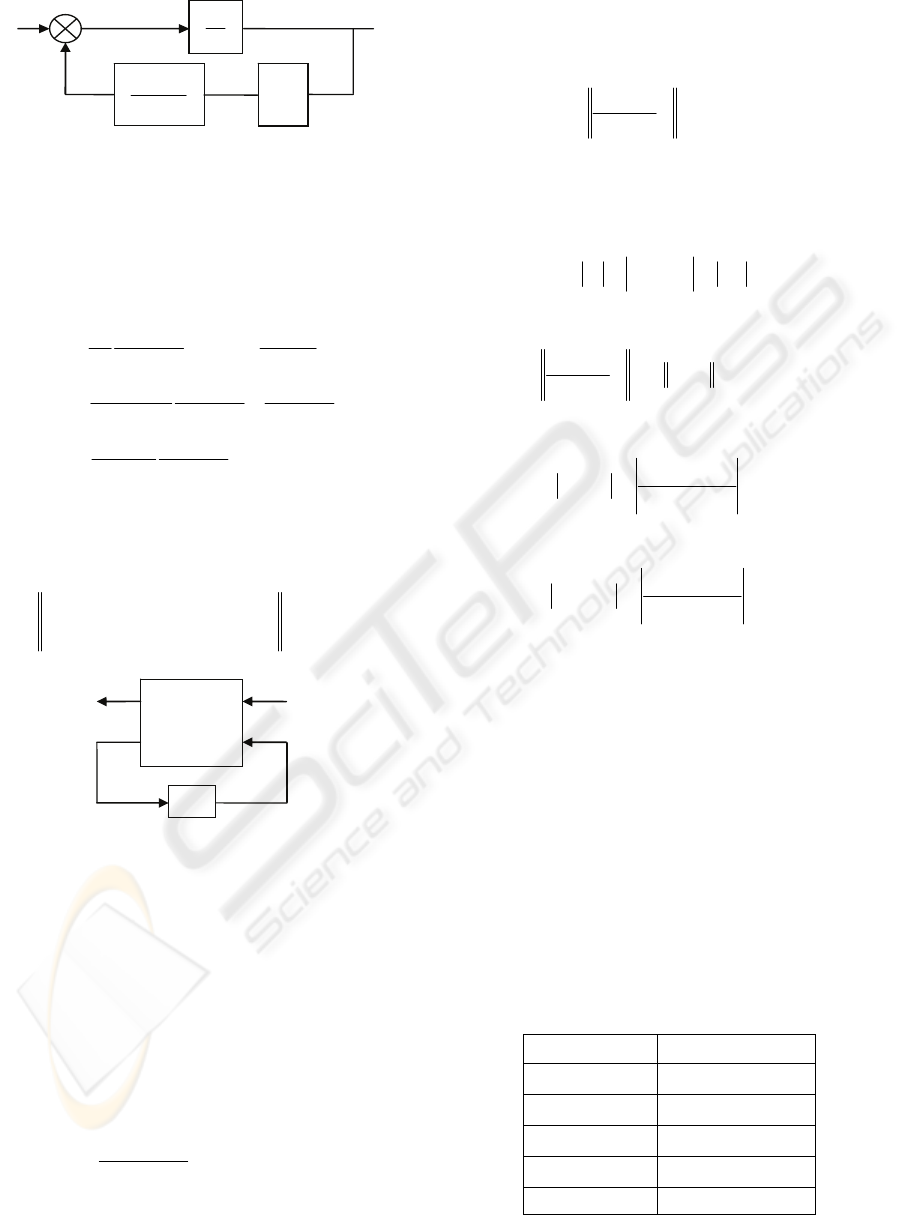
4 SIMULATION RESULTS
The control structure designed in this way is tested
by means of a mold level simulator developed with
parameters issued from a real plant (Table 1). The
previous tuning considers only the bulging rejection.
The standing waves rejection was not explicitly
taken into account.
Table 1: Plant model parameters.
Parameter Value
a
τ
s05.0
n
τ
s5.0
n
G
/s/mmmm10
36
S
2
mm2281600 ×
v
m/min5.1
PERIODIC DISTURBANCES REDUCTION IN THE CONTINUOUS CASTING PROCESS BY MEANS OF A
MODIFIED SMITH PREDICTOR
113
M
s
G
a
n
τ
+1
s
n
e
τ
-
Ss
1
W
w
N
*
P
out
Q
N
+
-
-
+
1
W
2
W
1
e
2
e
Figure 8: Block diagram of the proposed design.
The weight functions of the proposed design are:
s
s
W
58.132.0
5.01
1
+
+
=
s
s
W
+
=
1
7.2
2
2
W was selected according to equation (14) in
order to achieve a delay margin greater than the
identified delay value (0.5s). In this case, the
∞
H
controller is given by:
)2.0)(2.1)(9.9)(482(
)57.0)(1)(4)(20(27
1
++++
++++
=
ssss
ssss
M
The stability and the robustness of the system
controlled by the PID and the Aström’s modified
Smith predictor can be analyzed using the following
diagrams. They show the control laws actions when
the bulging occurs.
Figure 9 shows that the bulging rejection transfer
function was improved with the modified Smith
predictor. However, the steady state error is not
equal to zero. In order to overcome this problem, the
least of all the poles in
1
M was replaced by zero.
Therefore, the new controller is given by (see
Figure 10 for the new Bode diagram):
)2.1)(9.9)(482(
)57.0)(1)(4)(20(27
2
+++
++++
=
ssss
ssss
M
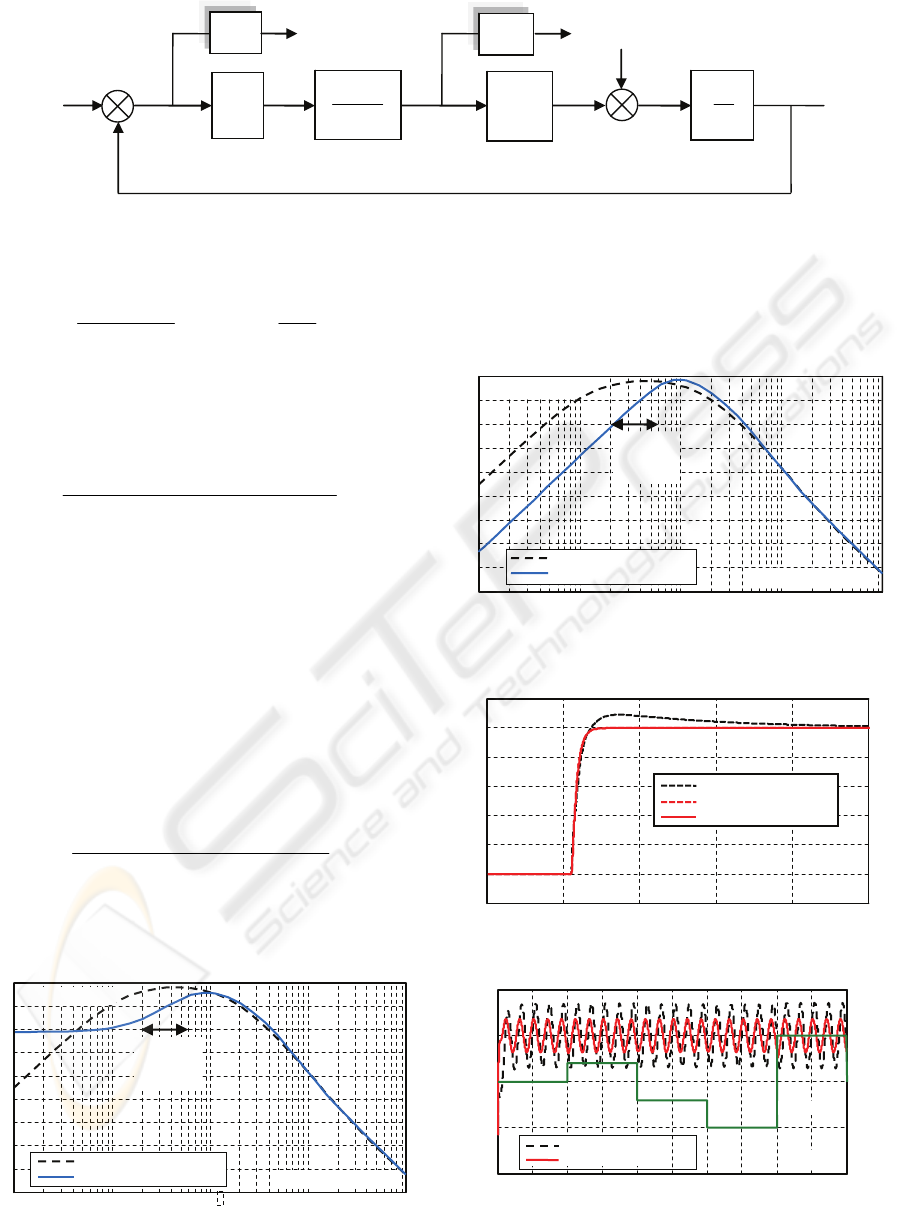
Figure 10 shows that the performances over the
bulging frequency band are not modified. Those
over lower frequencies are improved.
Figure 9: Bode diagram of the bulging rejection (case M
1
).
Considering
2
M , the main controller C was
adjusted to set the closed loop response time
(
1
=
C ). Figure 11 presents results obtained for a
level variation of 10 mm.
Figure 10: Bode diagram of the bulging rejection
(case M
2
).
0
Figure 11: Mold level (mm).
Figure 12: Mold level during bulging when delay changes.
10
‐2
10
‐1
10
0
10
1
10
2
‐35
‐30
‐25
‐20
‐15
‐10
‐5
0
5
10
Bulging
frequency
band
Magnitude(dB)
Frequency(rad/sec)
PID
Aströmpredictor(M1)
10
‐2
10
‐1
10
0
10
1
10
2
‐35
‐30
‐25
‐20
‐15
‐10
‐5
0
5
10
Magnitude(dB)
Bulging
frequency
band
Frequency(rad/sec)
PID
Aströmpredictor(M2)
0 50 100 150 200 250 300 350 400 450 500
‐80
‐60
‐40
‐20
0
050100 150 200 250 300 350 400 450 500
0
0.25
0.5
0.75
1
Delay(s)
Time(s)
Level(mm)
PID
Aströmpredictor(M2)
95 100 105 110 115 120
‐22
‐20
‐18
‐16
‐14
‐12
‐10
‐8
Time(s)
PID
Aströmpredictor(M2)
Aströmpredictor(M3)
ICINCO 2009 - 6th International Conference on Informatics in Control, Automation and Robotics
114
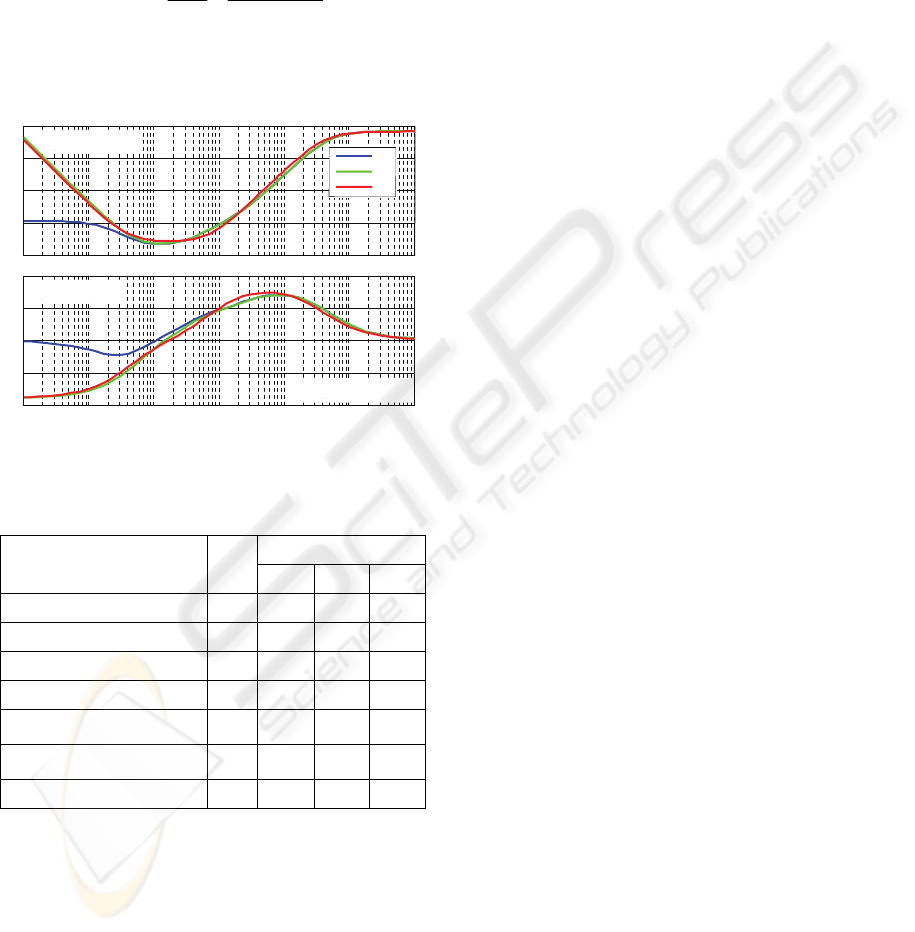
Figure 12 shows the mold level when the delay
changes during bulging whose frequency is 0.05Hz.
Using
2
M , the performances remain better than
those of the PID.
2
M can also be approached by a PID control law
(see Figure 13 for the Bode diagrams) as follows:
⎟
⎠
⎞
⎜
⎝
⎛
+
++=
s
s
s
M
0.00251
12.037.0
151.0
3
Finally, the performances of all the versions of
the Aström’s modified Smith predictor are summa-
rized and compared with those of the PID in Table 2.
Figure 13: Bode diagrams of all the versions of Aström
predictor.
Table 2: Performances of the proposed control laws.
Specifications PID
Aström predictor
1
M
2
M
3
M
Cutoff frequency (rad/s) 1.06 1.3 1.3
1.41
Gain margin (dB) 8.7
10.1 9.9 10.4
Phase margin (°) 66
54 46 42
Delay margin (s) 1.1
0.75 0.61 0.52
)(max
11
]Hz1.003.0[
ω
ω
jB
∈
(dB)
9
7.2 8.1 7.1
)(mi
n
11
]Hz1.003.0[
ω
ω
jB
∈
(dB)
8
2 -1.1 -0.6
Steady state error % outflow
0
small 0 0
5 CONCLUSIONS
This paper presents an effective method based on
∞
H control theory combined with the Aström’s
modified Smith predictor which enhances the
disturbance rejection performance compared to the
conventional Smith predictor. This one cannot
indeed be utilized in the mold level control process
since it leads to a steady state error as a response to a
step disturbance.
Using simple tuning rules, the level error was
reduced compared to the PID control with regards to
robust stability. Moreover, this technique allows
shaping the disturbance rejection independently
from the closed loop response time which is not the
case for PID. Further improvements may include
additional features as the introduction of observers
and feed-forward actions.
REFERENCES
Kurokawa, T., Kato, Y., Kondo T., 1992. Development of
CC mold level adaptive control system. Current
Advances in Materials and Processes, 5(2):354.
Matoba, Y., Yamamoto, T., Tozuda, M., Watanabe, T.,
Tomono, H., 1990. Instrumentation and control
technology for supporting high-speed casting. In 9
th
PTD Process Technol. Conf. Proc.
Jabri, K., Mouchette, A., Bèle, B., Godoy, E., Dumur, D.,
2008a. Disturbances estimation for mold level control
in the continuous casting process. In 5
th
International
Conference on Informatics in Control, Automation and
Robotics ICINCO, Funchal, Portugal.
Yoon, U-S., Bang, I.-W., Rhee, J.H., Kim, S.-Y., Lee, J.-
D., Oh, K.H., 2002. Analysis of mold level hunching
by unsteady bulging during thin slab casting. ISIJ
International, 42(10):1103-1111.
Thomas, B.G., Bai, H., 2001. Tundish nozzle clogging –
application of computational models. In 18
rd
PTD
Conf. Proc., Baltimore (US).
Lim, D.J., Jeong, H.S., Hong, D.H., 1990. A Study on the
Mold Level Control of Continuous Casting System.
Chen, Y.D., Tung, P.C., Fuh, C.C., 2007. Modified Smith
predictor scheme for periodic disturbance reduction in
linear delay systems. Journal of Process Control,
17:799-804.
Aström, K.J., Hang, C.C., Lim, B.C., 1994. A new smith
predictor for controlling a process with an integrator
and long dead-time. IEEE Trans. on Automatic
Control, 39(2):343-345.
Guanghui, Z., Feng, Q., Huihe, S., 2007. Robust tuning
method for modified Smith predictor. Journal of
Systems Engineering and Electronics, 18(1):89-94.
Zhang, F., Hosoe, S., Kouno, M., 1991. Synthesis of
robust output regulators via H
∞
control. In 13
th
SICE
Symp. Dynamical Syst. Theory.
Glover, K. et al, 1988. State space formula for all
stabilizing controllers that satisfy an H
∞
norm bound
and relations to risk sensitivity. Systems and Control
Letters, 11:167-172.
Jabri, K., Mouchette, A., Bèle, B., Godoy, E., Dumur, D.,
2008b. “Suppression of periodic disturbances in the
continuous casting process”. In Proc. Multi-
conference on Systems and Control MSC, San Antonio
(US).
10
-2
10
-1
10
0
10
1
10
2
10
3
10
4
-10
0
10
20
30
10
-2
10
-1
10
0
10
1
10
2
10
3
10
4
-100
-50
0
50
100
M1
M2
M3
Frequency (rad/sec)
Magnitude (dB)
Phase (degree)
PERIODIC DISTURBANCES REDUCTION IN THE CONTINUOUS CASTING PROCESS BY MEANS OF A
MODIFIED SMITH PREDICTOR
115
