AUTOMATIC EXTRACTION OF DISTANCE INFORMATION FROM
STEREO IMAGES USING TRACKING DATA
In the Scanning Electron Microscope
Christian Dahmen, Tim Wortmann, Robert Tunnell and Sergej Fatikow
Division Microrobotics and Control Engineering, University of Oldenburg, Oldenburg, Germany
Keywords:
SEM image processing, Stereo, Depth detection, Active contours.
Abstract:
This paper describes an approach to depth detection in scanning electron microscope images which aims at the
automation of nanohandling procedures. It incorporates simultaneous tracking of an object in a stereo image
pair, generated using a self-built magnetic lens for tilting the electron beam. Object depth is concluded from
the object displacement. The tracking procedure is based on the active contours method, adjusted by a region
based energy function. An automatic contour initialization is presented that makes use of edge detection. All
methods described have been implemented and tested extensively in the designated automation environment.
The approach is found to provide very accurate depth estimates even at a small level of magnification.
1 INTRODUCTION
The Scanning Electron Microscope (SEM) is widely
used as imaging modality for the handling of micro-
and nanoscale objects. Its special properties like fast
scanning speed and flexible magnification within a
great magnification range make it a very powerful
tool for this application. While teleoperated manipu-
lation of nanoscale objects has been shown already in
different scenarios, automated setups requiring mini-
mal user interactions to achieve a nanomanipulation
goal are still of current research interest. Problematic
for the processes is the lack of information concern-
ing tools and workpieces. Though in most cases axes
and actuators may deliver information about their po-
sition, the real position of the end-effectors is not
known exactly. The factors which contribute to this
are e.g. thermal drift and play, which may have effects
in the order of magnitude of the nanoscale manipu-
lation setups. These problems have been solved or
diminished by applying image processing algorithms,
specifically object tracking algorithms like in (Kra-
tochvil et al., 2007) or (Sievers and Fatikow, 2006),
to obtain a position information at least in the image
plane. A problem which still persists is the miss-
ing depth information of the imaged objects. The
SEM is only able to deliver two-dimensional images
which even exhibit a great depth of field, so that even
for teleoperated manipulation, a certain experience is
needed.
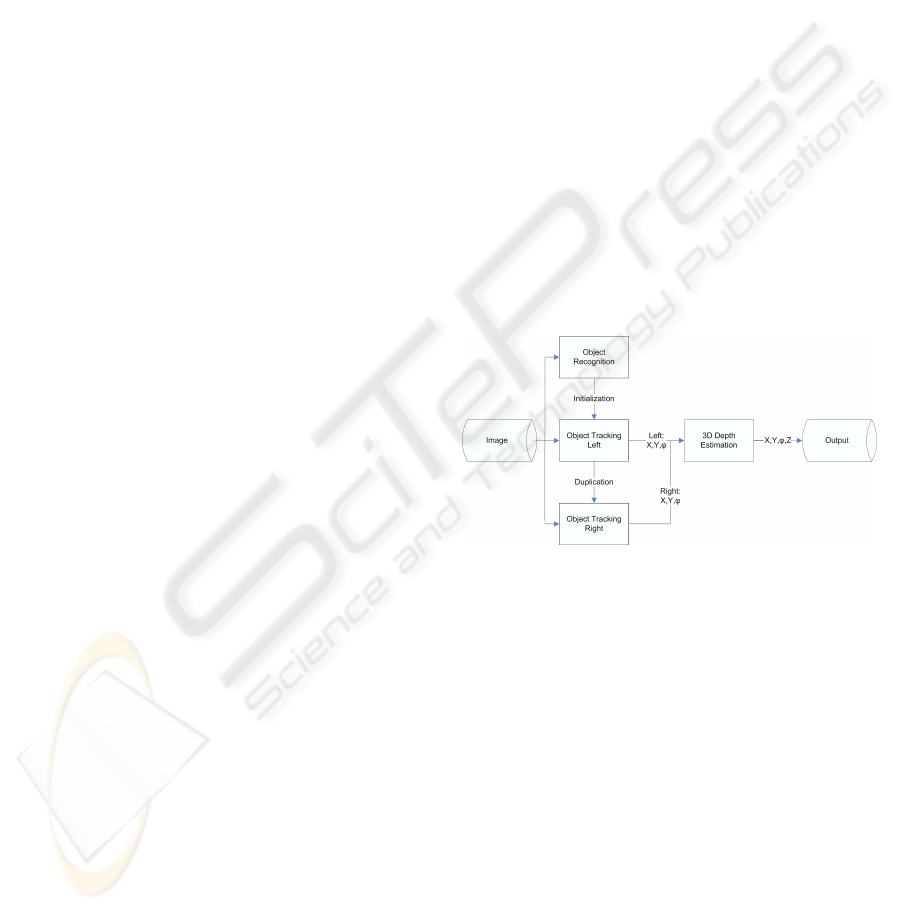
Figure 1: Overview of the proposed depth estimation algo-
rithm.
In order to obtain depth information, different ap-
proaches are used throughout the literature. Example
methods are depth from focus, depth from motion and
depth from stereo. In this paper we base our work
on the depth from stereo approach. Specifically we
present an approach for depth recovery using tracking
data from a stereo image pair.
One problem in depth from stereo approaches is
the solution of the correspondence problem. Differ-
ent methods exist to determine correspondencies, e.g.
pixel-based methods. Due to the slow calculation
of pixel-wise correspondences and the high amount
of ambiguity inherent in the solution, feature based
methods promise better performance. Due to the fact
that in most cases the objects of interest have to be
tracked anyways to determine their position in the im-
age plane, it is reasonable to make use of this fact also
for depth estimation. Tracking the object in parallel
79
Dahmen C., Wortmann T., Tunnell R. and Fatikow S. (2009).
AUTOMATIC EXTRACTION OF DISTANCE INFORMATION FROM STEREO IMAGES USING TRACKING DATA - In the Scanning Electron Microscope.
In Proceedings of the 6th International Conference on Informatics in Control, Automation and Robotics - Robotics and Automation, pages 79-85
DOI: 10.5220/0002209400790085
Copyright
c
SciTePress
in a stereo image pair means that the correspondency
problem is principally solved for the object.
The overall algorithm design can be seen in fig-
ure 1. In order to enable an automatic extraction of
the z-position and the position in the image plane, we
developed a recognition algorithm able to detect the
objects used in our experiments and deliver the neces-
sary initialization data for the tracking algorithm. The
tracking algorithm is split into separate algorithms for
each stereo pair image. The tracker for the left im-
age is in the first place minimized freely to segment
the object from the background. The contour data is
then duplicated to the right image tracker, which uses
just restricted transformations to determine the posi-
tion of the object in the right image. Both position
informations are fed to a depth estimation algorithm,
which analyzes the displacement of the two tracked
positions and determines the distance of the object.
2 ALGORITHM INITIALIZATION
A common drawback of active contour based ap-
proaches is the necessity for manual algorithm ini-
tialization. Usually a graphical user interface (GUI)
is used to present a dialog where the user is asked to
draw an initial estimate of the object’s shape. Instead
we choose another approach which allows automatic
initialization of the active contour. The proposed
method is based on the very popular edge detection
method of Canny (Gonzalez and Woods, 2008) and
an initial estimate of the object size. In the following
we will give a brief overview of Canny edge detection
and then show how it can be applied to our problem.
To reduce the effect of high frequency noise usu-
ally a Gaussian low-pass filter is applied to the input
image before edge detection. The main advantages
of the Gaussian low-pass are the efficient computabil-
ity and the good stopband attenuation (Forsyth and
Ponce, 2002). The convolution kernel is:
G
σ
(x,y) =
1
2πσ
2
exp
−
x
2
+ y
2
2σ
2
!
(1)
The actual contour detection algorithm consists of
the following steps:
1. Determination of edge points - A measure of im-
age gradient G in the direction of the image coor-
dinate axes x,y is needed. The Sobel- and Prewitt
operator (Jaehne, 1991) are two examples of first-
order derivative approximation filters. From the
filter responses G
x
,G
y
the local gradient magni-
tude g(x,y) and orientation α (x, y) are computed:
g(x,y) =
q
G
2
x
+ G
2
y
(2)
α (x,y) = tan
−1
(G
y
/G
x
) (3)
Edge points are obtained by finding the local max-
ima of g(x,y) in the direction of α (x,y).
2. Nonmaximal suppression - The prior step pro-
duces ridges along image edges that are not yet
necessarily a thin line. Nonmaximal suppression
removes pixels that are not on the top of the ridge
and leaves a thin line.
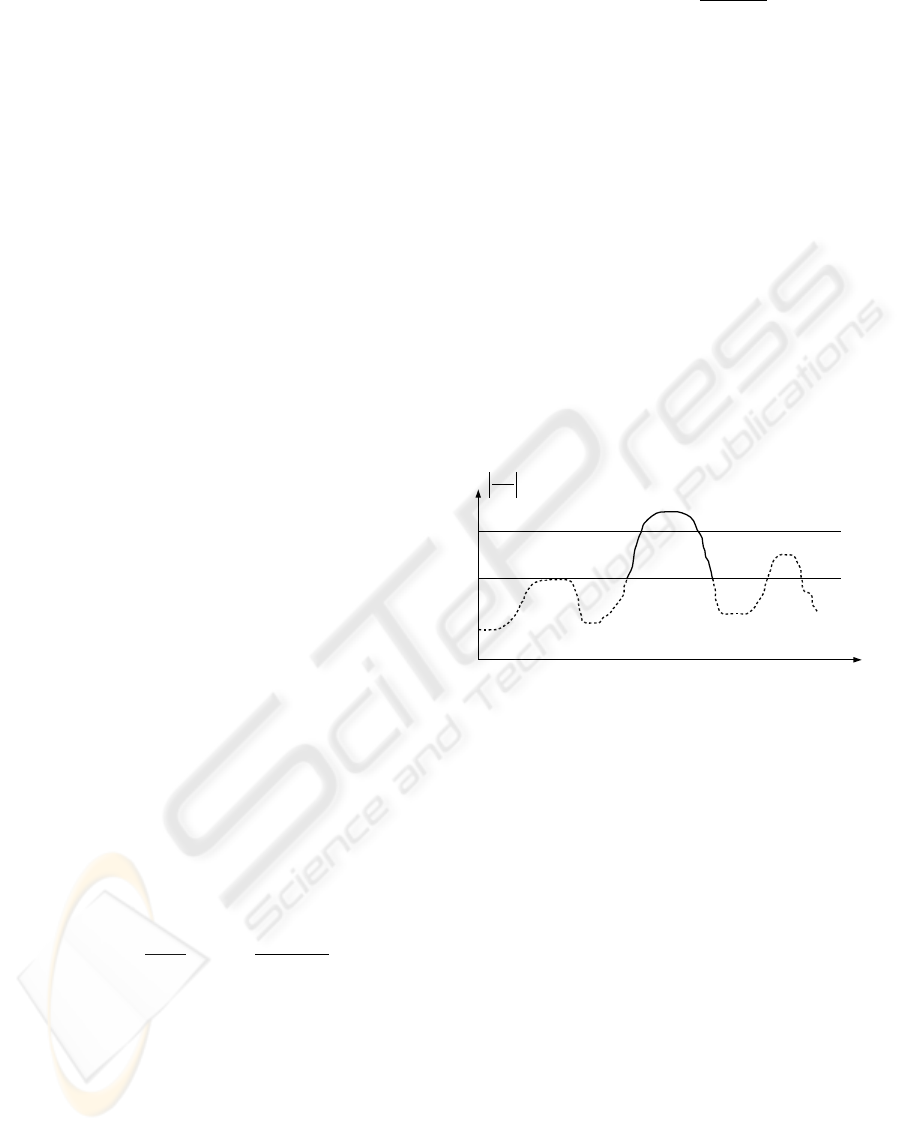
3. Hysteresis thresholding - Two threshold values T
1
and T
2
, with T
1
< T
2
are used to remove edges
of low strength. Initially, all edge pixels where
g(x,y) < T
1
are removed. The next step removes
all remaining pixels with T
1
< g(x,y) < T
2
that
are not 8-connected to an edge segment with
g(x,y) < T
2
. This procedure is depicted in
figure 2.
x
δI
δx
T
1
T
2
Figure 2: Hysteresis thresholding as used in Canny edge
detection, illustrated by a one-dimensional signal I. Only
connected line segments with derivative values higher than
T
1
and at least one segment higher than T
2
survive this step.
The methods as described above have been ap-
plied to a sample SEM image taken from the automa-
tion sequence (figure 3). The Sobel operator has been
chosen as edge emphasizing filter. It can be seen from
the result of the Canny edge detection that is not only
sensitive to the target object but also to background
structure. For retrieving the actual object shape that
is used to initialize the active contour we incorporate
three further steps:
4. Binary dilation - Lines in the binary edge image
are thickened to close gaps in the outer object hull.
For this operation a structuring element is needed
which is another binary image. A binary approxi-
mation of a circular disk is a common choice.
5. Contour retrieval - The dilated image is inspected
for contours which are point sequences that en-
close 8-connected binary objects. Only outer con-
tours which are not wrapped by a larger contour
are taken into account.
ICINCO 2009 - 6th International Conference on Informatics in Control, Automation and Robotics
80
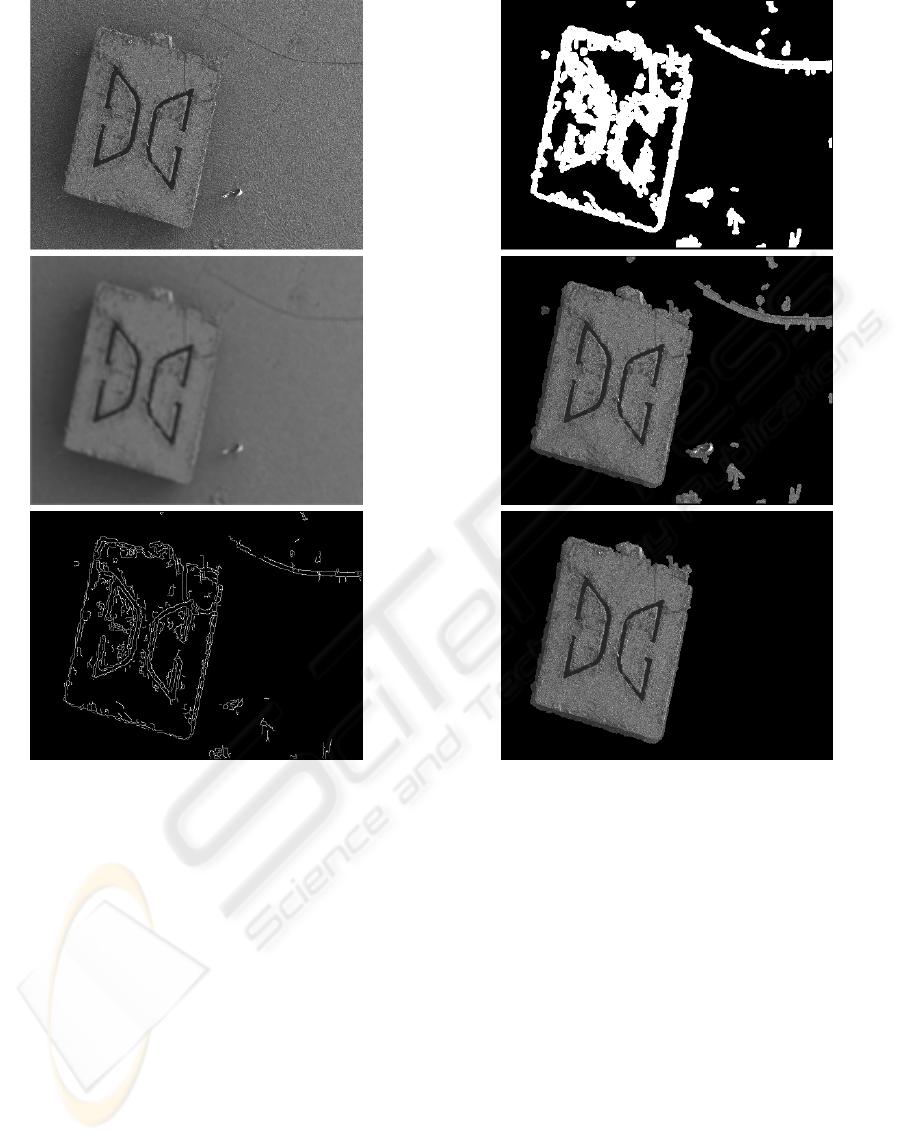
Figure 3: Processing steps: the initial image (top) after
Gaussian filtering (middle) and Canny edge detection (bot-
tom).
6. Size thresholding - From the outer object contours
the enclosed area and thus the object mass can be
derived directly. In this particular problem set-
ting the object in demand is the largest object in
the image scene. Also the physical dimensions
are well-known. All but the largest object are
dropped.
These processing steps have been applied to the
output of the edge detection and the results can be
seen in figure 4. The dilated image (top) points out
and connects the image edges. Outer contours are de-
tected and the enclosed regions are filled (middle im-
age, overlaid with the original image). Finally small
objects are removed from the image scene (bottom).
The object boundary pixels are output of the initial-
ization procedure and input to the active contour al-
gorithm.
Figure 4: Binary dilation with a circular structuring element
is applied (top). After region growing (middle), objects
which do not meet the expected size are removed (bottom).
3 OBJECT TRACKING
In order for generating input data for the depth esti-
mation, a tracking algorithm is used to track the po-
sition of the object not only in one image, but sepa-
rately in the two stereo images. The tracking algo-
rithm is based on active contours (for details on this
concept see (Kass et al., 1988) and (Blake and Isard,
2000)). Active contours are curves in the image plane
which segment the image into two regions, one en-
closed by the contour and one surrounding the con-
tour. The enclosed segment is the tracked object, the
surrounding segment the rest of the scene. For deter-
mining the segmentation, active contours exhibit an
energy function. This energy function is dependent
on certain properties of the contour, like length, com-
AUTOMATIC EXTRACTION OF DISTANCE INFORMATION FROM STEREO IMAGES USING TRACKING DATA
- In the Scanning Electron Microscope
81
pactness etc., and on properties of the image data, like
edges.
Though the original formulation of the active con-
tours like described in (Kass et al., 1988) depends on
edges for the energy function, it turned out that an en-
ergy function derived from image region statistics is
more robust for SEM images (for details see (Sievers,
2006) and (Sievers, 2007)). Especially this is the case
with very noisy images. The energy function used
here is defined as
E(C) = E
int
(C) + E
ext
(C) (4)
with
E
int
(C) =
L
3
A
(5)
with L the length of the contour, A the area enclosed
by the contour and
E
ext
(C) = N
a
f
1
N
a
∑
x∈a
x
!
+ N
b
f
1
N
b
∑
x∈b
x
!
(6)
with
f (z) = −zln(z) (7)
with a and b being the two regions in which the con-
tour segments the image.
The original algorithm has been used already for
the tracking of objects in SEM images. Important
in comparison to microscope is that the algorithm
has to be as robust as possible against certain effects
which may occur in SEM images, especially in SEM
nanomanipulations setups. It has shown to be robust
against:
• noise - due to fast SEM image acquisition during
manipulation
• partial occlusion - due to complex manipulation
setups
• grey level fluctuations - due to charge accumula-
tion and discharging effects in the SEM chamber
The implementation is fast enough to track objects in
SEM images with relatively high framerates. For the
initial minimization, the contour points are handled
individually, resulting in a deforming contour which
fits itself to the object. After the initial minimization
of the contour, the transformation for the subsequent
steps is restricted to euclidean transforms. This en-
ables the left image tracker to transfer the contour
points to the right image tracker, and is also the rea-
son for the robustness against occlusion. The transfer
and duplication of the contour leads to the same ob-
ject being tracked in both stereo images.
The steps executed in the minimization of the
whole contour are the following, executed in order:
1. Minimization by translation in X
2. Minimization by translation in Y
3. Minimization by rotation
In the original algorithm (described in (Sievers,
2007)), additional minimization by scaling was exe-
cuted, which is not used here due to coherency issues.
When adding the scaling minimization, the tracking
gets slightly more unstable, and a independent mini-
mization on the two separate images may lead to in-
coherent states of the tracker, e.g. different scaling
factors for the two images.
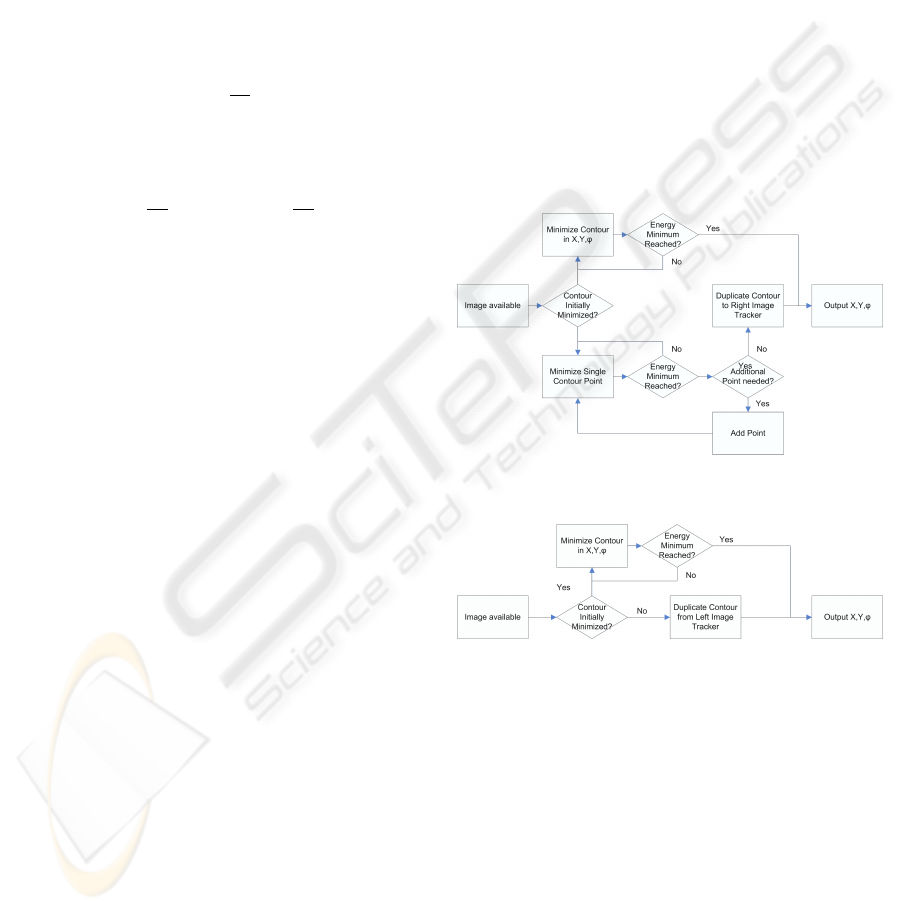
The modifications made to the algorithm mainly
deal with the duplication of the tracker for stereo
tracking. The left image tracker is extended with a
component duplicating the contour like shown in fig-
ure 5, the right image tracker does not need an own
free minimization of the contour, but is initialized by
the left image tracker with the contour data as shown
in figure 6.
Figure 5: The tracking algorithm for the left image.
Figure 6: The tracking algorithm for the right image.
The active contour tracker itself is robust enough
to track the objects in the experiment, though some
parameter tuning was necessary due to the inhomoge-
neous appearance of the objects.
4 DEPTH ESTIMATION
Many modern applications use the well known ad-
vantages of SEMs. These applications often require
knowledge of the exact position of involved objects
or topographic information of a specimen. There-
fore, measurements for all 3 dimensions are required.
This requirement exceeds the possibilities of standard
ICINCO 2009 - 6th International Conference on Informatics in Control, Automation and Robotics
82
SEMs, because they are only capable of delivering 2-
dimensional images of a scene. Typical applications
are grabbing and assembling processes such as the
manipulation of carbon nanotubes (CNT).
There are different approaches to obtain 3-
dimensional measurements in scanning electron mi-
croscopy. Beside tactile sensors and laser-based mea-
suring methods, focus-based methods are popular in
image processing. Due to problems with the standard
methods over the last years stereoscopy-based meth-
ods in SEM applications gained in importance. The
advantage of stereoscopy techniques is the ability to
display dynamic processes in real time in contrast to
focus-based methods which need to acquire a series
of images for depth calculation.
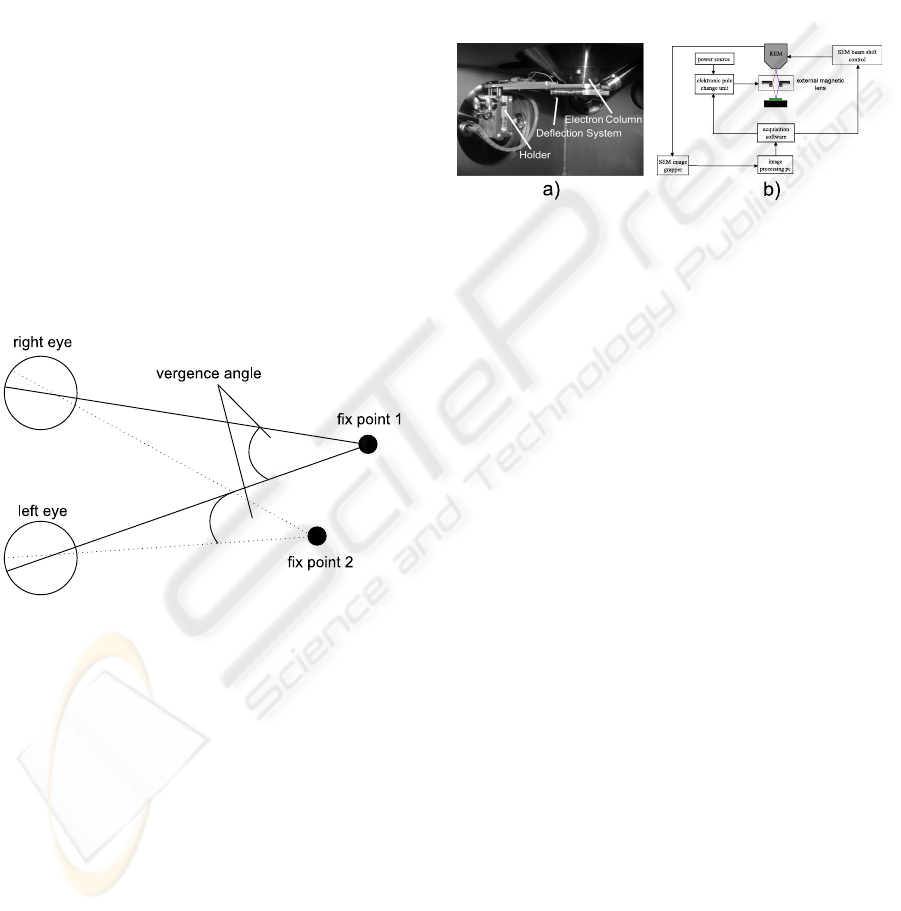
The application of the stereoscopy principle in the
SEM is similar to the application in the macro world.
Different z-positions lead to different displacements
between the two stereo images. This displacement
leads to z-position dependent disparities of the cor-
responding points. The disparity is used to calculate
the original z-position. The angular displacement be-
tween the two views is also called vergence angle (fig-
ure 7).
Figure 7: The principle of stereoscopy using the example of
human vision.
The stereoscopy approach consists of two main
parts: the stereo image acquisition and the stereo anal-
ysis. Different methods to acquire stereo images ex-
ist. Research currently follows the three following ap-
proaches:
• Dual-beam scanning electron microscope
• Specimen table tilting
• SEM beam deflection
The first two approaches have some disadvan-
tages. Dual-beam scanning microscopes are very ex-
pensive and far away from being the standard in most
SEM environments. A standard specimen table is al-
ready able to perform the required shift and tilt move-
ments for the second method, but the experimental
setup of many applications is not compatible with the
tilting of the specimen table, e.g. setups for manipula-
tion processes with mobile robots. These are core rea-
sons why our group follows the approach of electron
beam deflection (see also in (Jahnisch and Fatikow,
2007)). The beam is deflected by two units:
• Internal SEM beam shift unit
• External self-built-magnetic lens
The advantage of this setup is the easy integration
of the system into standard SEMs.
Figure 8: a) An image of the integrated external magnetic
lens in the SEM vacuum chamber. b) A sketch of the prin-
ciple of electron beam deflection and the control system of
the stereo image acquisition in the SEM.
To acquire stereo images, special software was
written to synchronize the SEM beam shift control
and the external magnetic lens. Figure 8 shows the
principle and control flow of the stereo image acqui-
sition. The disadvantage and main difference of stere-
oscopy in the SEM to macro world stereoscopy is the
small vergence angle due to technical limits imposed
by the construction of the acquisition system. This is
one of the reasons why there are special requirements
to the stereo image analysis in the SEM. The main
challenge of the analysis is to solve the correspon-
dence problem. The solution is derived by finding the
corresponding points or objects in the stereo image
pair.
Currently there are just a few analysis methods
to solve correspondence in the scanning electron mi-
croscopy. The algorithm used in our vision feedback
group (see (Jahnisch and Fatikow, 2007)) is based on
the human visual cortex and is able to calculate dis-
parities without any previous knowledge of the speci-
men. This procedure is a pixel-based correspondence
solving algorithm. On the one hand this method is
very versatile, but on the other hand the algorithm
needs almost noise free stereo input images and a very
long computation time to create reliable disparities.
Current research is looking for new methods to cal-
culate the correspondence in SEM stereo images with
the following features:
• Fast calculation for real-time applications
• High noise robustness
AUTOMATIC EXTRACTION OF DISTANCE INFORMATION FROM STEREO IMAGES USING TRACKING DATA
- In the Scanning Electron Microscope
83
• High reliability and accuracy for automation ap-
plications
Feature-based correspondence analysis is interest-
ing due to its flexibility. Therefore, common methods
for image tracking, recognition and classification are
reviewed with respect to their capability of calculating
correspondence under SEM-specific conditions. Due
to the experience with the application of active con-
tours (see section 3) in SEM applications, their high
noise robustness and the fast calculation time after an
initialization step, they are a promising candidate for
correspondence analysis. The principle is to initialize
the active contour based tracking algorithm on one of
the two stereo images and use the derived contour to
initialize the tracking algorithm on the other stereo
image. Due to the small vergence angle and the small
acquisition time difference of a stereo image pair the
correspondence between objects can be solved.
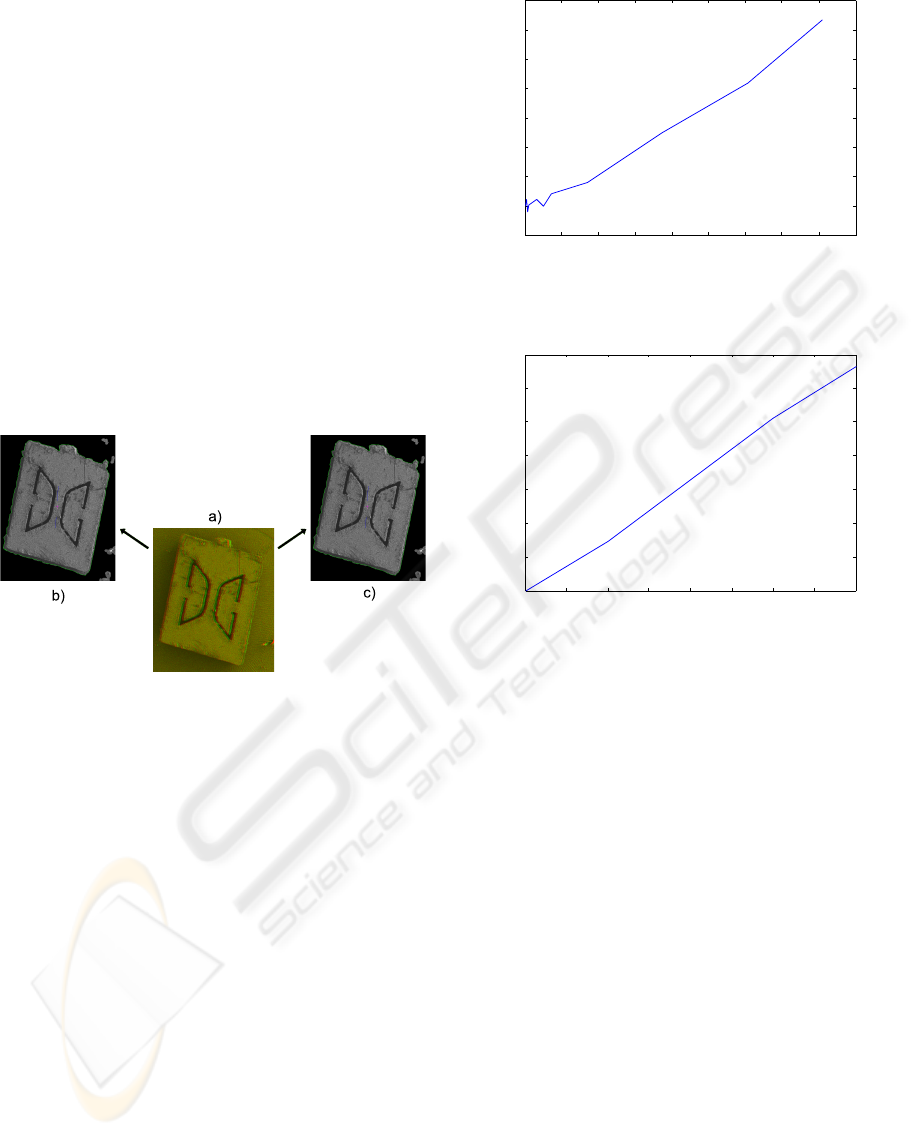
Figure 9: a) Shows the red green image of the stereo image
pair. b) Preprocessed left image with active contour. c)
Preprocessed right image with active contour initialized by
the right image contour.
In the following step, the center points and the
orientations of both contours are used to calculate
the disparity and to calculate the angle difference be-
tween the contours. This difference reflects the z posi-
tion and orientation of the specimen. To validate this
new procedure, a series of stereo images with differ-
ent z-positions of a specimen in the SEM were taken.
The following two diagrams show two series of mea-
surement with different SEM scan speeds.
Figure 10 shows a series of small z-differences
with their corresponding disparities. Due to the
small magnification of 60x the resolution of the
stereo images is insufficient to detect disparities to z-
displacements of a few µm. That is the reason for the
noise with small displacements. Thanks to the fea-
tures of SEMs and the scalability of the active con-
tours algorithm, the disparity calculation of small z-
displacement is still possible in high magnifications.
This new feature-based correspondence problem
is just limited by the resolution and the vergence an-
0 50 100 150 200 250 300 350 400 450
0.5
1
1.5
2
2.5
3
3.5
4
4.5
Displacement in Z direction [µm]
Relative disparity
Figure 10: Graph shows small z-displacements with corre-
sponding disparities.
0 0.5 1 1.5 2 2.5 3 3.5 4
0
2
4
6
8
10
12
14
Displacement in Z direction [mm]
Relative Disparity
Figure 11: Graph shows z-displacements in the range of 0,5
to 4 mm with corresponding disparities.
gle. Recently, the algorithm was tested with CNTs
using a magnification of 1000x with the ability to de-
tect z displacement in the single-digit µm domain. In
the future, it is planned to build a new SEM scan gen-
erator to increase the stereo image resolution and to
build new lens systems to get a higher vergence an-
gle.
5 SUMMARY
In this paper, we have shown a new approach for
depth estimation using SEM images. The use of a
duplicated two-dimensional tracking algorithm gener-
ates data which can be used to determine depth. The
algorithm is initialized and then duplicates the con-
tour information to process both images from a stereo
image pair. The displacements detected are a mea-
sure of depth. The results of this algorithm are very
promising and further effort will be made to improve
the approach. Even with the results obtained already,
the featured algorithm shows to be a promising tool
for the automation of nanohandling processes. With
ICINCO 2009 - 6th International Conference on Informatics in Control, Automation and Robotics
84

magnifications as low as 60x which has been used
in this experiment, depth differences in the order of
50µm can be detected.
REFERENCES
Blake, A. and Isard, M. (2000). Active Contours. Springer.
Forsyth, D. and Ponce, J. (2002). Computer Vision: A Mod-
ern Approach. Prentice Hall.
Gonzalez and Woods (2008). Digital Image Processing.
Prentice Hall.
Jaehne, B. (1991). Digital Image Processing. Springer.
Jahnisch, M. and Fatikow, S. (2007). 3-D vision feedback
for nanohandling monitoring in a scanning electron
microscope. International Journal of Optomechatron-
ics, 1(1):4–26.
Kass, M., Witkin, A., and Terzopoulos, D. (1988). Snakes:
Active contour models. International Journal of Com-
puter Vision, 1(4):321–331.
Kratochvil, B. E., Dong, L. X., and Nelson, B. J. (2007).
Real-time rigid-body visual tracking in a scanning
electron microscope. In Proc. of the 7th IEEE Conf.
on Nanotechnology (IEEE-NANO2007), Hong Kong,
China.
Sievers, T. (2006). Global sensor feedback for automatic
nanohandling inside a scanning electron microscope.
In Proc. of 2nd I*PROMS NoE Virtual International
Conference on Intelligent Production Machines and
Systems, pages 289–294.
Sievers, T. (2007). Echtzeit-Objektverfolgung im
Rasterelektronenmikroskop. PhD thesis, Univer-
sity of Oldenburg.
Sievers, T. and Fatikow, S. (2006). Real-time object track-
ing for the robot-based nanohandling in a scanning
electron microscope. Journal of Micromechatronics,
3(3-4):267–284.
AUTOMATIC EXTRACTION OF DISTANCE INFORMATION FROM STEREO IMAGES USING TRACKING DATA
- In the Scanning Electron Microscope
85
