
MAMMOGRAPHIC IMAGE ANALYSIS FOR BREAST CANCER
DETECTION USING COMPLEX WAVELET TRANSFORMS
AND MORPHOLOGICAL OPERATORS
V. Alarcon-Aquino, O. Starostenko, R. Rosas-Romero, J. Rodriguez-Asomoza, O. J. Paz-Luna
K. Vazquez-Muñoz and L. Flores-Pulido
Communications and Signal Processing Research Group, Department of Computing Electronics, and Mechatronics
Universidad de las Americas Puebla, Sta. Catarina Martir, Cholula, Puebla. 72820, Mexico
Keywords: Breast cancer, Mammography, Microcalcifications, Dual-tree complex wavelet transforms, Wavelets.
Abstract: This paper presents an approach for early diagnostic of Breast Cancer using the dual-tree complex wavelet
transform (DT-CWT), which detect micro-calcifications in digital mammograms. The approach follows four
basic strategies, namely, image denoising, band suppression, morphological transformation and inverse
complex wavelet transform. The procedure of image denoising is carried out with a thresholding algorithm
that computes recursively the optimal threshold at each level of wavelet decomposition. In order to
maximize the detection a morphological conversion is proposed and applied to the high-frequencies sub-
bands of the wavelet transformation. This procedure is applied to a set of digital mammograms from the
Mammography Image Analysis Society (MIAS) database. Experimental results show that the proposed
denoising algorithm and morphological transformation in combination with the DT-CWT procedure
performs better than previous reported approaches.
1 INTRODUCTION
A mammography exam, called a mammogram, is
used to aid in the diagnosis of breast diseases in
women. A mammogram is a specialized X-ray
exam in which a set of plates are taken from breast
tissue to detect suspect tissue and
microcalcifications (MCs). The main reason to
perform a mammogram is the detection of clinically
hidden breast cancer at early time. The early
detection of breast cancer with a mammogram is
difficult due to the fact that small tumors and MCs
are very similar to normal glandular tissue.
Recently, tools for computer-aided diagnosis have
been developed especially in the image processing
field that permits an easy visualization of
mammograms. In this way the wavelet transform
(WT) has an important merit, since it has been
employed to eliminate noise in mammogram’s
image. The results have shown an improvement of
the image, making easy the visualization of
suspicious lesions (Akay, 1997). Wavelets have
been applied to biomedical signals because they
provide an analysis of non-stationary signals that
contains a high among of complex frequencies, and
have also been applied to detect MCs in digital
mammograms. In this regard, several approaches
have been proposed. A system based on fuzzy logic
has been reported in (Cheng, 1998), a mathematical
morphologist study is reported in (Zhao, 1993), and
several methods based on wavelet transforms are
reported in (Strickland, 1996; Wang, 1998; Melloul,
2002; Sebri, 2007; Mencattinni, 2008; Jamarani,
2006; Karahaliou, 2008). Strickland (1996)
introduced a two stages method for detection and
segmentation of MCs. The first stage is based on
the use of undecimated wavelet transform and the
segmentation process is realized with matched
filters. Wang (1998) reported an approach to detect
MCs using the decimated wavelet transform so that
suppression in the low-frequencies band is
performed. The visualization of MCs is improved
using a non-linear threshold based on arctan
method. Finally, Melloul (2002) reported detection
of MCs in two steps. The first consists in total
elimination of background’s mammogram with
multi-scale morphological filtering then an optimal
threshold (entropy threshold) is applied to the
segmentation step. In this paper we present an
approach to detect microcalcifications in digital
79
Alarcon-Aquino V., Starostenko O., Rosas-Romero R., Rodriguez-Asomoza J., J. Paz-Luna O., Vazquez-Muñoz K. and Flores-Pulido L. (2009).
MAMMOGRAPHIC IMAGE ANALYSIS FOR BREAST CANCER DETECTION USING COMPLEX WAVELET TRANSFORMS AND MORPHOLOGICAL
OPERATORS.
In Proceedings of the International Conference on Signal Processing and Multimedia Applications, pages 79-85
DOI: 10.5220/0002236400790085
Copyright
c
SciTePress
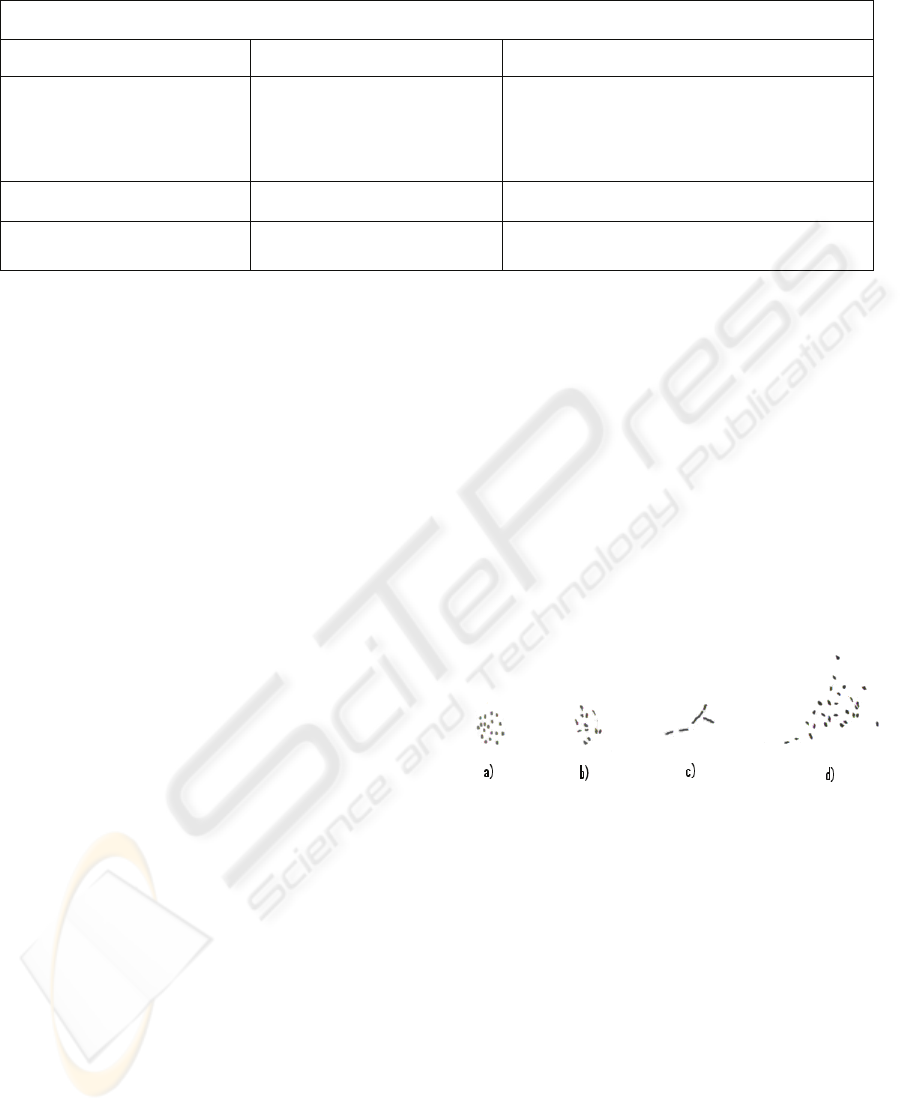
Table 1: Mammogram’s information format (Suckling, 1994).
mdb209 G CALC M 647 503 87
1
st
column 2
nd
column 3
rd
column
Reference number from MIAS
database. The database
includes 322 mammograms.
Type of tissue:
F-Fatty,
G-Fatty-Glandular,
D-Dense-Glandular.
Class of abnormality: CALC-Calcification,
CIRC-Circumscribed masses, SPIC-Spiculated
masses, MISC-others, ill-defined masses,
ARCH - Architectural distortion, ASYM-
Asymmetry, NORM-Normal.
4
th
column 5
th
& 6
th
column 7
th
column
Severity of Abnormality:
B – Benign, M – Malign.
(x, y) image-coordinates of
centre of abnormality.
Approximate radius (pixels) of a circle
enclosing the abnormality.
mammograms using the dual-tree complex wavelet
transform. The approach consists of four stages:
image denoising by optimal thresholding, band
suppression of low frequencies, morphological
transformation, and inverse complex wavelet
transform. The remainder of this paper is organized
as follows. In Section 2 a brief description of MCs
and the MIAS database is presented. Section 3
presents an overview of wavelet transforms. The
proposed approach to detect microcalcifications is
presented in Section 4. Experimental results are
reported in Section 5. Conclusions and future work
are discussed in Section 6.
2 DESCRIPTION OF MCS IN
MAMMOGRAMS
Initially, the breast tissue study was performed in
radiology field by analogical images including all
kind of image modalities such as magnetic
resonance image and nuclear medicine. The basic
idea for using different image methods was to
detect and diagnose at early stage the breast cancer
tissue when the probability of cure was greater and
the treatment was less aggressive. It helped to
decide the best therapy for each lesion. Currently,
mammogram screening is the only way for
detection at a short period of time. The objective of
a mammogram is to produce detailed images of the
internal structures in breast tissue to make earlier
cancer detection. Due to the need of details, high
quality spatial images are requested because the X-
ray attenuation between normal and abnormal tissue
is very small. Conventional mammogram uses film-
screen detectors to record the photons that go
through breast tissue, and it produces an analogical
image. Due to large amount of data that need to be
stored, a piece of film is an excellent storage
medium. Unfortunately, it is not possible to perform
modifications in the image to improve the
visualization of present elements. In order to
overcome the intrinsic limitations of conventional
mammograms the use of digital mammograms is
preferred. One of the fundamentals benefits present
in a digital mammogram is the capability to modify
the information present in the image. Breast micro-
calcifications are commonly discovered in the
radiological study on asymptomatic women. These
are deposits of calcium at the thickness of
mammary tissue and are represented as little white
dots, and normally show the first sign of cancerous
process. Figure 1 shows different types of grouped
MCs.
Figure 1: Types of MCs, a) y b) Grouped or clusters MCs,
c) Linear MCs and d) Linear MCs & clustered.
In order to assess the performance of the proposed
approach the Mammography Image Analysis
Society (MIAS) database is used (Suckling, 1994).
Table 1 shows the available information at the
database for each mammogram that includes type of
tissue, class of abnormality and strictness. In this
work only mammograms classified as CALC and
NORM are analyzed. The size of each image is
1024x1024 pixels and it is centered in the matrix,
and the list of images is presented in pairs. That is,
even numbers correspond to left breast
mammogram, while odd numbers correspond to
right breast mammogram.
SIGMAP 2009 - International Conference on Signal Processing and Multimedia Applications
80

3 WAVELET TRANSFORMS
The Wavelet Transform (WT) is a mathematical
tool that provides building blocks with information
in scale and time of a signal (Burrus, 1998). These
building blocks are generated from a single fixed
function called mother wavelet by translation and
dilation operations. The process of wavelet
transform of a signal is called analysis, and the
inverse process to reconstruct the analyzed signal is
called synthesis. The analysis generates different
sub-band blocks (multi-resolution analysis, MRA)
(Burrus, 1998), so different levels can be generated
as the application requires. This process is also
known as sub-banding coding (Burrus, 1998).
3.1 Discrete Wavelet Transform
The Discrete Wavelet Transform (DWT) is a time-
scale representation of a digital signal, obtained
with digital filtering techniques. The signal to
analyze is passed through several filters with
different cut-frequencies at different scales. The
wavelet’s family is generated by a mother wavelet
)(x
ψ
defined by
()
⎟
⎟
⎠
⎞
⎜
⎜
⎝
⎛
−
=
j
k
j
kj
a
bx
a
x
ψ
ψ
1
,
(1)
where
j
a
denotes the scale parameter,
k
b
represents
the translation parameter, the term
j controls scale
and term k controls translation. The discrete
parameters a and b are sampled in a dyadic grid
into time-scale plane and by the sampling process
with the dyadic grid an orthonormal wavelet’s
family is obtained
()
()
kxx
j
j
kj
−=
−
−
22
2
,
ψ
(2)
The DWT is thus defined by (Burrus, 1998;
Alarcon-Aquino, 2003):
()
()
dxkxxsd
j
j
kj
∫
−=
−
−
22
2
,
ψ
(3)
where s(x) is the signal to be analyzed.
3.2 Two Dimensional Discrete Wavelet
Transform (2D-DWT)
The two-dimensional discrete wavelet transform
analyze digital images by separation of rows and
columns, in this way the horizontal, vertical, and
diagonal details are separated. In the first stage, the
rows of an image
NN × are filtered by one-
dimensional (1D)-DWT analysis and then the same
process is applied to the columns (Gonzalez, 2001).
The previous process generates three different
detailed sub-images HH, HL and LH. These
correspond to three different directions (diagonal,
vertical and horizontal, respectively) and a sub-
image LL, known as approximation matrix, is used
to the multi-level decomposition process. To
reconstruct the image through the sub-images
results of two-dimensional-DWT, details are
recombined with the low-pass approximation and
the up-sampling processes (Gonzalez, 2001). If
(
)
y
ψ
is an one-dimensional wavelet associated
with the one-dimensional scaling function
(
)
y
φ
,
then the three two-dimensional wavelets associated
with the three sub-images are defined by
(
)
(
)
(
)
1
,
x
yxyLH
ψ
φψ
=→
(4)
(
)
(
)
(
)
2
,
xy
x
y
HL
ψψφ
=→
(5)
(
)
(
)
(
)
3
,
x
yxyHH
ψ
ψψ
=→
(6)
where
(
)
yx, represents height and width of the
image. Note that the DWT is the non-redundant and
compact representation of a signal in the wavelet
domain. The down-sampling process makes the
DWT time variant and produces shifting. The
stationary wavelet transform (SWT) is the
redundant, non down-sampling and full time
invariant version of WT. The SWT has the same
length of wavelet coefficients for each
decomposition level. In addition, the SWT does not
have sensibility but it is computationally complex.
The computational complexity of the SWT is O(n
2
)
, where n denotes the length of samples in the signal
(Alarcon-Aquino, 2003). The redundant
representation of SWT does not present shifting.
This is ideal for applications as contour detection,
noise reduction, and data fusion (Taswell, 2000).
3.3 Complex Wavelet Transform
(CWT)
The Complex Wavelet Transform is used to avoid
the limitations of DWT and to obtain phase
information. The CWT employs a complex value
filtered analytically to decompose pure real signals
and real signals with complex components into real
and imaginary parts in the wavelet domain. Real
and imaginary coefficients are used to compute
amplitude and phase information, needed to
describe precisely the energy localization of
oscillating sources. Recent investigations in the
CWT field are addressed to the design of complex
MAMMOGRAPHIC IMAGE ANALYSIS FOR BREAST CANCER DETECTION USING COMPLEX WAVELET
TRANSFORMS AND MORPHOLOGICAL OPERATORS
81
bank filters, in which the outputs are wavelet
coefficients (real and imaginary). It is desirable that
filters form pairs of Hilbert’s Transform on each
decomposition level.
The CWT is classified into two groups:
Redundant-CWT (RCWT) and Non-redundant-
CWT (NR-CWT), and these are a powerful tool to
image compression (Shukla, 2003). The RCWT is
presented in two variants, namely, the Dual-Tree
Complex Wavelet Transform of Kingsbury (DT-
CWT (K)) and the DT-CWT of Selesnick (DT-
CWT (S)) (Selesnick, 2005). Both of them are
redundant due to a similar bank filter structure with
the DWT, but in this case the banks operate in
parallel and in quadrature. The filter’s structure is
the same in both variants; the difference is the
method that generates the wavelet and scaling
coefficients. Both DT-CWT variations generate
phase information, are insensible to shifting, and are
directional. The CWT follows the same principle of
DWT, and at the output there are the same number
of samples n that at the input, additionally, the
computational complexity is only twice of the
DWT, O(2n) (Shukla, 2003; Selesnick, 2005).
Although, both DT-CWT have the same bank filter
structure of DWT, the difference is that real filters
are replaced by analytical filters in order to obtain
complex solutions. It is similar of two parallel bank
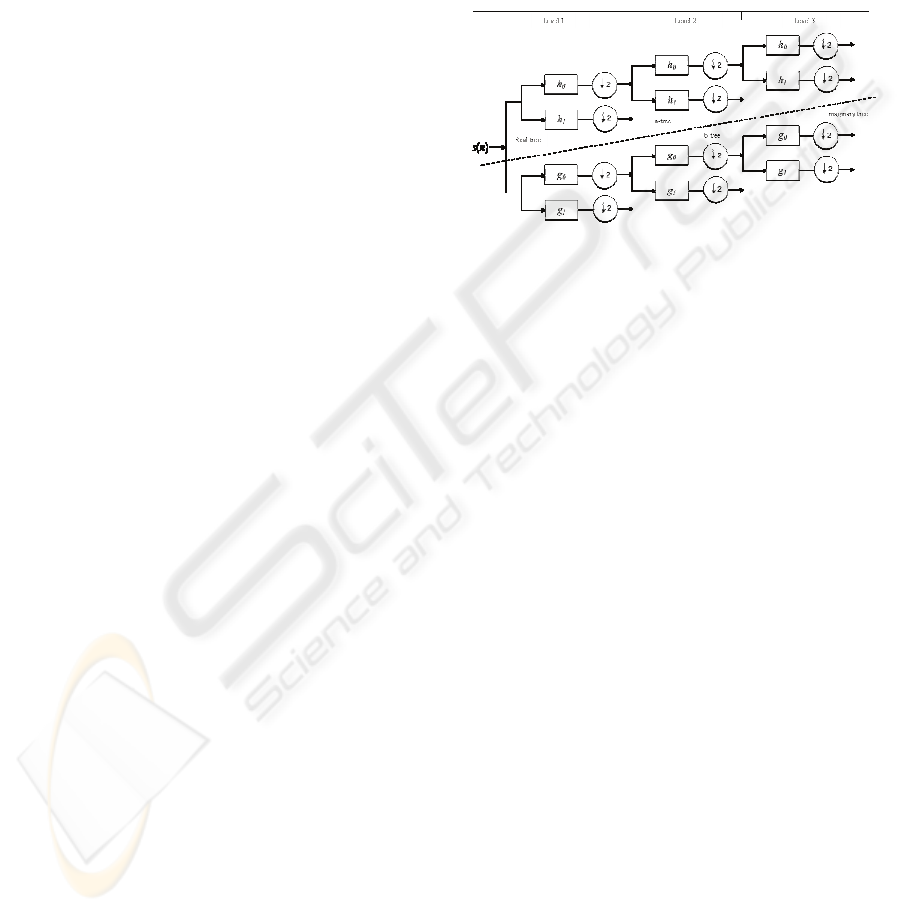
filter structures in the DWT (Shukla, 2003). Figure
2 shows the bank filter structure to DT-CWT
analysis at three level of decomposition in one-
dimension.
The form of the conjugated filters for one-
dimensional DT-CWT is defined by Equation (7),
where
n
h
is the set of filter
{}
10
, hh
and
n
g
is the
set
{}
10
, gg
. Filter
0
h
and
1
h
correspond to low-pass
and high-pass filter respectively for real part, in the
same way filter
0
g
and
1
g
are in the imaginary
part. The synthesis bank filter is realized with the
pairs
10
~
,
~
hh
and
10
~
,
~
gg
.
() ( )
nn
ighns += (7)
4 DETECTION OF
MICRO-CALCIFICATIONS
In this section an approach to detect MCs in digital
mammograms using the DT-CWT(S) is proposed.
The performance of the SWT is also reported. The
DWT disadvantages decrease its efficiency in
digital image processing; in addition there is an
inconvenient using the DWT for MCs detection due
to the down-sampling process that eliminates details
in the image, especially when MCs are details in the
high-frequency band. The SWT increases
significantly MCs detection to overcome the DWT
disadvantages. However, the computational
complexity of the SWT is O(n
2
) (Shukla, 2003). In
order to overcome the limitations of the DTW and
the SWT we use the Dual-Tree Wavelet Complex
Transform (DT-CWT).
Figure 2: Bank filter for 1D DT-CWT analysis.
4.1 Proposed Approach
MCs are small deposits of calcium that appear as
diminutive white dots in the mammogram. Due to
microcalcification’s size, the non-homogeneous
background of mammogram (breast glandular
tissue) and noise present, detection of MCs is
difficult (Melloul, 2002). In the work reported in
this paper we propose an approach based on the
hypothesis that MCs that are present in
mammograms can be obtained using a transform
that locate image characteristics into the wavelet
transform domain. The WT allows the multi-
resolution analysis and image decomposition in
sub-band frequencies, in which the low-band
frequencies are image’s background and high-
frequencies correspond to image’s detail. MCs
correspond to the high-frequencies of mammogram
spectrum (Wang, 1998). The five steps that
conforms the method to detect MCs are as follows:
Mammogram’s Sub-band Frequency
Decomposition. The original mammogram is
decomposed into a sub-band set, each band with
different resolution and frequency contents. This
process is performed with the DT-CWT proposed
by Selesnick. There are two variants of the DT-
CWT(S), the DT-CWT (Real) and the DT-CWT
(Complex). Both of them have wavelets oriented in
six directions; the difference is that the DT-CWT
(Complex) uses two wavelets for each direction,
one interpreted as the real part and the other as the
imaginary part. Due to the complex version there
SIGMAP 2009 - International Conference on Signal Processing and Multimedia Applications
82
100 200 300 400 500 600 700 800 900 1000
100
200
300
400
500
600
700
800
900
1000
g
580 600 620 640 660 680 700 720 740
760
780
800
820
840
860
880
900
920
(a) (b)
580 600 620 640 660 680 700 720 740
760
780
800
820
840
860
880
900
920
580 600 620 640 660 680 700 720 740
760
780
800
820
840
860
880
900
920
(c) (d)
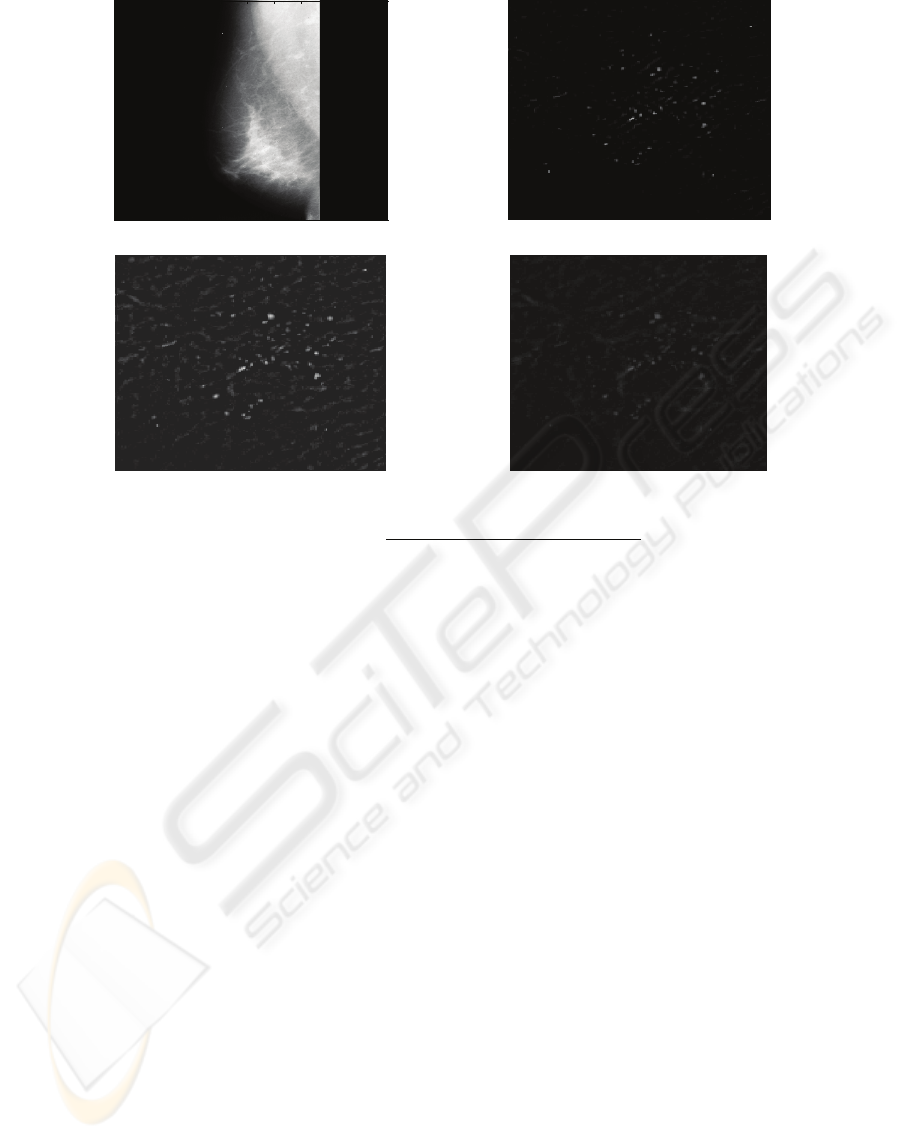
Figure 3: Experimental results of the mammogram mdb233 G CALC M *NOTE 3*. (a) Original mammogram, (b)
Mammogram with MCs using the DT-CWT, (c) Mammogram with MCs using the SWT, and (d) Mammogram with MCs
using the Top-Hat filtering.
are double numbers of wavelets than the DT-CWT
(Real); the DT-CWT (Complex) is 4 times
expansive and the DT-CWT (Real) is 2 times
expansive (Shukla, 2003; Selesnick, 2005). The
complex wavelet transform used in this work to
detect MCs is the DT-CWT (Real).
Mammogram’s Noise Reduction. The noise
reduction in the mammogram is realized into
transform domain by an optimal threshold
algorithm that modifies the signal’s representation
coefficients according to each decomposition level.
The method used to obtain the optimal threshold
consists in the stages of initialization, iteration, and
convergence. The main objective is to implement a
method to remove image’s noise using a non-linear
and recursive algorithm called optimal threshold
algorithm (Jansen, 1999; Azzalini, 2005) with CWT
theory. Threshold application on wavelet
coefficients is an efficient method for noise removal
in a signal (Taswell, 2000; Azzalini, 2005). A
quasi-optimal threshold method depends on
sampled signal’s length and noise’s variance that
generally is unknown.
Suppression of Bands containing Low-
frequencies. To eliminate mammogram’s
background that difficult visibility of MCs the
suppression of bands that contain mammogram’s
low-frequencies is performed. This objective is
achieved by discarding the low-frequencies
subbands from real and imaginary parts of the DT-
CWT(S) (Vazquez-Muñoz, 2006).
Dilatation of High-frequency Components. It is
necessary to stand out the sub-bands components
that contain high frequencies in which MCs are
present. This is achieved by a morphological
operation of dilatation (Melloul, 2002; Vazquez-
Muñoz, 2006).
Mammogram’s Reconstruction. Finally, DT-
CWT synthesis is applied to the filter bank and the
DT-CWT sub-bands previously processed with the
described methods of image denoising, low-
frequencies sub-band suppression and high-
frequencies components dilatation, in which is
obtained the mammogram that contains only the
MCs.
5 EXPERIMENTAL RESULTS
To evaluate the performance of the proposed
approach experimental results using the SWT and
the Top-Hat transformation are also presented. The
results after applying these methods in
mammograms from the MIAS database are
reported. In the SWT case, the fourth order
MAMMOGRAPHIC IMAGE ANALYSIS FOR BREAST CANCER DETECTION USING COMPLEX WAVELET
TRANSFORMS AND MORPHOLOGICAL OPERATORS
83
gg
100 200 300 400 500 600 700 800 900 1000
100
200
300
400
500
600
700
800
900
1000
g
450 500 550 600 650
350
400
450
500
550
600
650
(a) (b)
g
450 500 550 600 650
350
400
450
500
550
600
650
450 500 550 600 650
350
400
450
500
550
600
650
(c) (d)
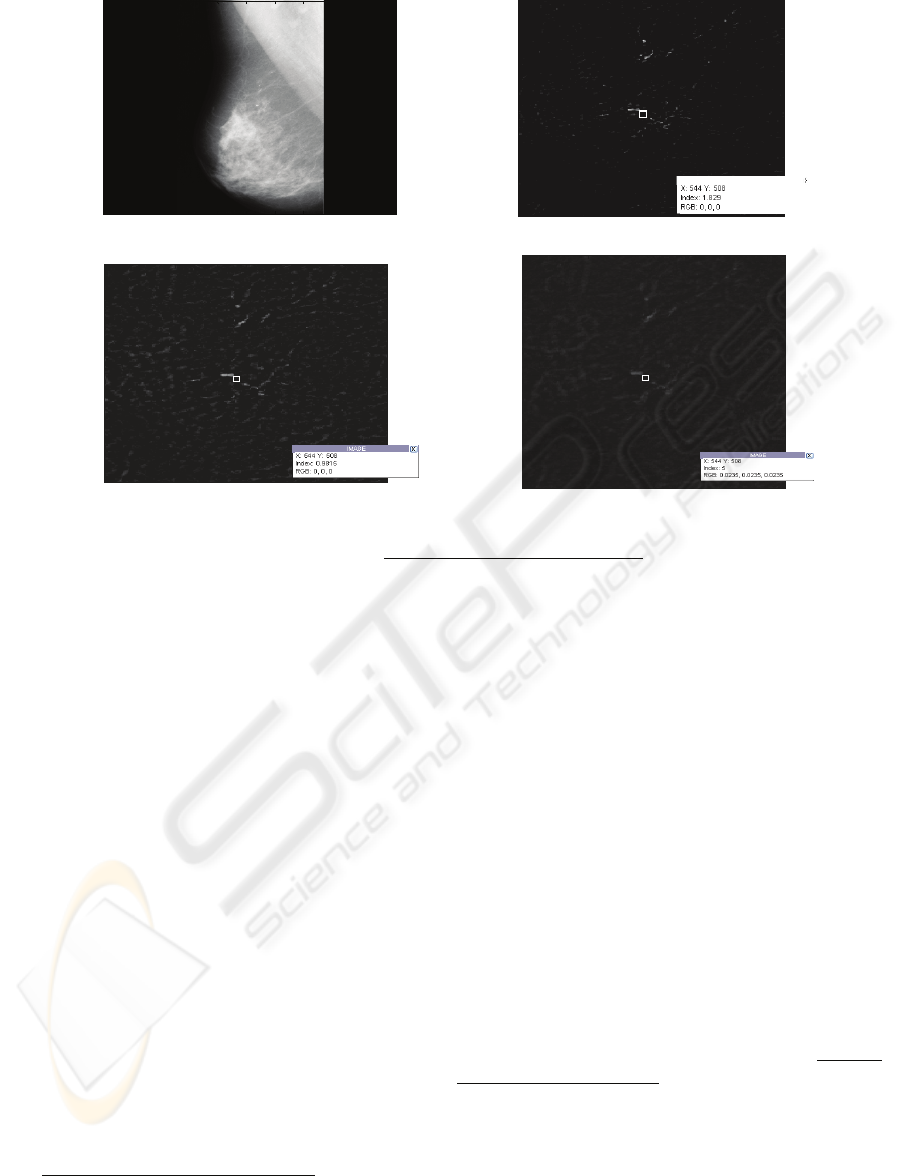
Figure 4: Experimental results of the mammogram mdb249 D CALC M 544 508 48. (a) Original mammogram, (b)
Mammogram with MCs using the DT-CWT, (c) Mammogram with MCs using the SWT, and (d) Mammogram with MCs
using the Top-Hat filtering.
Daubechies wavelet is used. Other wavelets may
also be considered. Note that the detection of MCs
using the SWT is accomplished by setting low-
frequencies subbands to zero before the
reconstruction of the image. The Top-Hat
transformation is largely employed for detail
extraction in images. There are two kinds of Top-
Hat transformation. The White Top-Hat
transformation for brighten detail’s extraction and
the Black Top-Hat transformation for dark detail’s
extraction (Melloul, 2002). Because MCs are present
as bright particles rounded by a black background,
then White Top-Hat transformation is used. The
Top-Hat transformation consists on recover the
structures eliminated in the open or closed process.
Using a structuring element with adequate shape,
size and orientation it is possible to filter the image
and eliminate particular elements of the original
image. The White Top-Hat transform is the residue
between original image and the morphological open.
The results obtained with the SWT, the proposed
approach and the White Top-Hat transformations are
reported. Figure 3 shows an original mammogram
called mdb233 G CALC M *NOTE 3*
. According
to Table 1 this mammogram corresponds to a
glandular tissue and contains a set of malign MCs.
NOTE 3 denotes that when calcifications are
present, centre locations and radii are applied to a
group of MCs rather than individually. As can be
seen in Figure 3, when using the SWT the MCs
(brighten points) are appreciable, but its visibility is
difficult because other image’s details appear (tissue
and breast glands), and the computational
complexity is high, O(n
2
). With the proposed
approach using the DT-CWT better results are
obtained, MCs are more visible and other objects
presented by the SWT disappear, in addition the DT-
CWT has lower computational complexity, O(2n).
The results obtained with the Top-Hat
transformation show that this is the worst method to
detect MCs. This is due to the fact that other tissues
and breast’s glands are not filtered and appear
together with MCs, which are not significantly
appreciated as in the cases of the two other
simulated methods. In the same way, results are
interpreted for the case of the mammogram mdb249
D CALC M 544 508 48 shown in Figure 4. In this
case a set of MCs are present at the approximate
center of image (544, 508). Again it is observed that
using the DT-CWT a better detection of MCs
without inherent mammogram’s characteristics is
obtained. This is not possible with the SWT because
there are not tissue and glandular filtering.
SIGMAP 2009 - International Conference on Signal Processing and Multimedia Applications
84

6 CONCLUSIONS AND FUTURE
WORK
In the work reported in this paper we have proposed
an approach to detect MCs in digital mammograms
using the DT-CWT. The approach consists of the
DT-CWT application to obtain a mammogram’s
subband decomposition, mammogram’s denoising
by applying an optimal threshold at each
decomposition level, suppression of mammogram’s
low-frequencies, application of morphological
operators to enhanced MCs visualization, and
finally, the reconstruction of the mammogram. The
results obtained using the DT-CWT are compared to
the results obtained using the SWT and the Top-Hat
transformations. The proposed approach shows the
best performance to detect MCs in mammograms.
The SWT detects the MCs but other details are also
observed as MCs. Another inconvenient presented
by the SWT is the computational complexity, O(n
2
),
in contrast, the computational complexity of the DT-
CWT is O(2n) only. From results obtained
morphological filtering is the worst method to detect
MCs, because MCs are not well appreciated, in
addition tissue and breast glands are presented in the
reconstructed mammogram. The approach presented
in this work can be used as a basis to develop an
automatic diagnostic system to aid the results on
mammogram’s interpretation and to get an earlier
and opportune diagnostic for breast cancer.
REFERENCES
Akay, M., 1997. Wavelet applications in medicine, IEEE
Spectrum, 34(5).
Alarcon-Aquino, V. 2003. Anomaly Detection and
Prediction in Communication Networks using Wavelet
Transforms, PhD Thesis, Imperial College London,
UK.
Azzalini A., Farge M., Schneider K., 2005. Nonlinear
wavelet thresholding: A recursive method to determine
the optimal denoising threshold, Applied and
Computational Harmonic Analysis, Elsevier, 18, pp.
177– 185.
Burrus, C. S., Ramesh A. Gopinath, 1998. Introduction to
Wavelets and Wavelet Transforms, Prentice Hall.
Cheng, H., Lui, YM, Feiimanis, RI., 1998. A novel
approach to microcalcification detection using fuzzy
logic techniques. IEEE Transactions on Medical
Imaging, 17 (6).
Gonzalez, Rafael C., Richard E. Woods, 2001. Digital
Image Processing, Second Edition, Prentice Hall.
Jamarani, S.M.H.; Rezai-rad, G.; Behnam, H.; 2006. A
Novel Method for Breast Cancer Prognosis Using
Wavelet Packet Based Neural Network”. IEEE-EMBS
Engineering in Medicine and Biology Society, 27th
Annual International Conference
Jansen M., Bultheel A.,1999. Asymptotic behavior of the
minimum mean squared error threshold for noisy
wavelet coefficients of piecewise smooth signals,
Katholieke Universiteit Leuven. Department of
Computer Science. Belgium.
Karahaliou, A. N., et al., 2008. Breast Cancer Diagnosis:
Analyzing Texture of Tissue Surrounding
Microcalcifications, IEEE Transactions on
Information Technology in Biomedicine, 12 (6).
Melloul, M., Joscowicz, L., 2002. Segmentation of
microcalcification in X-ray mammograms using
entropy thresholding, In Proceedings of the 16th
International Congress on Computer-Assisted
Radiology and Surgery CARS/Springer.
Mencattinni, A., M. Salmeri, R. Lojacono, M. Frigeno, F.
Caselli, 2008. Mammographic Images Enhancement
and Denoising for Breast Cancer Detection Using
Dyadic Wavelet processing, IEEE Transactions on
Instrumentation and Measurement, 57 (7).
Sebri, A., J. Malek, R. Tourki, 2007. Automated Breast
Cancer Diagnosis based on GVF-Snake Segmentation,
Wavelet Features Extraction and Neural Networks
Classification, Journal of Computer Science 3(8), 600-
607.
Selesnick, I., Baraniuk, R.G., Kingsbury, N.G., 2005. The
Dual-Tree Complex Wavelet Transform, IEEE Signal
Processing Magazine.
Shukla P. D. 2003. Complex Wavelet Transforms and
Their Applications. M.Phil. Thesis, University of
Strathclyde. Scotland, UK.
Strickland, R., Hahn., 1996. Wavelet Transforms for
Detecting Microcalcifications in Mammograms. IEEE
Transactions on Medical Imaging, 12 (4).
Suckling, J et al., 1994. The Mammographic Image
Analysis Society Digital Mammogram Database
Exerpta Medica. International Congress Series 1069
pp375-378
Taswell C. 2000. The What, How and Why of Wavelet
Shrinkage Denoising, Computing in Science &
Engineering.
Vazquez-Muñoz, K. 2006. Detection of
Microcalcifications in Digital Mammograms Using
the Dual-Tree Complex Wavelet Transform, BSc
Thesis, Universidad de las Americas Puebla.
Wang, T., Karayiannis, N., 1998. Detection of
microcalcification in Digital mammograms using
wavelets. IEEE Transactions on Medical Imaging, 17
(4).
Zhao, D., 1993. Rule-based morphological feature
extraction of microcalcifications in mammograms.
Proceedings of SPIE. Vol. 1905.
MAMMOGRAPHIC IMAGE ANALYSIS FOR BREAST CANCER DETECTION USING COMPLEX WAVELET
TRANSFORMS AND MORPHOLOGICAL OPERATORS
85
