
AGENT-BASED DIVISION OF WATER DISTRIBUTION
SYSTEMS INTO DISTRICT METERED AREAS
J. Izquierdo, M. Herrera, I. Montalvo and R. Pérez-García
CMMF, Universidad Politécnica de Valencia, Cno. de Vera, s/n, 46022, Valencia, Spain
Keywords: Multi-agent, Water supply, Decision support system, Water leaks.
Abstract: Water distribution systems are extremely complex assets. The complexity of these systems is continually
increasing from the point of view of technical management. Most water companies do not have the
necessary global vision of their production and distribution, and lack suitable tools to control and operate
their systems. As a result, an increasing number of projects examining suitable methods to divide water
distribution networks into district-metered areas (DMA) are in progress in many cities worldwide. Division
into DMAs aims at splitting large interconnected distribution network into smaller and virtually independent
networks. Division into DMAs enables action to be taken to improve the control of important aspects of
water distribution, such as leaks and water quality. Due to the complexity of the problem, especially for
large systems, efficient techniques are required. In this paper, we introduce a multi-agent approach that
takes advantage of the distributed nature of water distribution systems. This approach has been applied to a
real network with promising results.
1 INTRODUCTION
Water supply is one of the more recognizable and
important public services contributing to quality of
life. It exhibits a number of characteristics that are
quite different from those of other public services.
Its distribution is irregular, both in temporal and
spatial terms. In addition, its operation can be
analyzed from very different perspectives. As water
is for consumption, aspects related to health need to
be considered: water quality and the appropriate
control measures to maintain quality during
residence time in the network. However, water
systems suffer a number of operational and
environmental conditions, which lead to progressive
and insidious deterioration. There are a variety of
factors involved: loss of pressure, due to increasing
inner roughness of pipes; breakage or cracking of
pipes, caused by corrosion and mechanical and
thermal charges; and loss of water (leaks), due to
pipe breaks and cracks, with their corresponding
economic loss, and third party damage. All these
factors can create a risk of contamination. Because
of the complexity of water systems, mainly due to
the interconnected nature of sources and
consumption points, it is extremely difficult to
balance production and distribution, that is to say, to
control the water supplied and consumed. Division
of the network into DMAs follows a divide-and-
conquer strategy that splits a large and highly
interconnected distribution network into smaller and
virtually independent networks – each supplied by a
pre-fixed number of sources.
Independence can be physically achieved in a
number of ways: by closing valves in existing pipes,
by sectioning existing pipes, by introducing new
pipes that redistribute the flow, etc.
Manageable DMAs will enable action to be
taken to improve the control and management of
important aspects of water distribution, such as
water quality and the intensity and spatial and
temporal distribution of leaks. DMAs will help
reduce unaccounted-for water loss and improve the
water-tightness of the system – thereby saving huge
amounts of water and preserving water quality.
Substantial water savings can be forecasted if
sectorization is enforced systematically.
Real water distribution systems may consist of
thousands of consumption nodes interconnected by
thousands of lines, as well as the necessary elements
to feed the network. These networks are not usually
the result of a unique process of design, but the
consequence of years of anarchic response to
continually rising demands. As a consequence, their
83
Izquierdo J., Herrera M., Montalvo I. and Pérez-García R. (2009).
AGENT-BASED DIVISION OF WATER DISTRIBUTION SYSTEMS INTO DISTRICT METERED AREAS.
In Proceedings of the 4th International Conference on Software and Data Technologies, pages 83-90
DOI: 10.5220/0002237800830090
Copyright
c
SciTePress

layouts lack a clear structure from a topological
point of view. This fact renders these networks
difficult to understand, control, and manage. In the
case of small networks, simple techniques,
sometimes of a visual character, enable division into
a few DMAs. But this task is unthinkable for very
large networks because their complexity renders the
problem virtually unfeasible. As a consequence, new
algorithmic capabilities, not implicitly contained in
the hydraulic model, would be of great interest.
The main objective of creating DMAs (or
sectorization) is to obtain the distributed and
manageably scaled information necessary to perform
key actions in each sector (AVSA, 2009). These
actions include:
• audit the hydraulic efficiency or NRW (non-
revenue water),
• characterize the demand curve, especially the
night flow,
• quickly detect possible leaks by analyzing the
evolution of the night minimum flow,
• check the results of search campaigns and
repair leaks quickly,
• detect fraud, under-registration, or diverse
errors of measurement,
• reduce maintenance costs,
• plan investments when guiding supply to the
sectors with more NRW.
The procedure to define the hydraulic sectors
implies (Tzatchkov et al., 2006):
1. Obtaining the number of independent sectors
in a network layout. A sector of the network is said
to be independent when it is supplied exclusively
from its own water sources, and is not connected to
other sectors in the network.
2. Obtaining the set of network nodes belonging
to each individual sector.
3. Revising proposed sectorization actions, such
as valve closing or pipe sectioning, in case such
actions may cut the water supply for some parts of
the network.
4. Defining the area served by each water source,
and the contribution of each source to the
consumption of each network node.
The first and third of these four tasks are crucial
for detecting errors in the network layout and in
proposed sectorization decisions. The second task is
essential for water audits, and the fourth task is
important for defining and visualizing any proposed
sectorization.
A District Metered Area (DMA) is a part of the
water distribution network that is hydraulically
isolated, temporally or permanently, and ideally has
just one supply node equipped with a flow meter.
DMAs are small zones of the system and usually
contain between 500 and 3000 service connections.
The concept of DMA management was first
introduced to the UK water industry in the early
1980s (Morrison, 2004), and it has been used as an
instrument to monitor and reduce the level of leaks
in water supply systems. The technique was mainly
developed in Europe, and has been used in Latin
America from the 1990s, while it is less often used
in the United States and Canada. The development
of DMAs has been strongly empirical, being based
on technical experience and with very few scientific
contributions. It is necessary to highlight the
contributions in UKWIR (1999) and IWA (2007).
Recently, some proposals have been presented for a
conceptual and scientific framework – such as
Hunaidi (2005) relative to the periodic acoustic
surveys in a DMA; or Tzatchkov et al. (2006), in
applying graph theory to establish the division of
DMAs.
In this paper, we explore the division of a water
supply system into DMAs by using a multi-agent
approach. Multi-agent techniques have proven to be
highly efficient in the solution of very complex
problems of a distributed nature – an example of
which is shown below. In the water field, in
particular, there has been a tendency in recent years
to include multi-agent techniques as an interesting
alternative for solving complex problems that differ
from the problem addressed in this article. See, for
example, (Izquierdo et al. 2008) on multi-agent
applications in urban hydraulics; (Maturana et al.
2006) on water and waste water control system
architecture; (Kotina et al. 2006) on control systems
for municipal water; (Nichita and Oprea 2007) on
water pollution diagnosis; (Feuillette et al. 2003) on
water demand management for a free access water
table; (Hai-bo et al. 2005) on water quality; (Becu et
al. 2001) on water management at catchment scale;
(Cao et al. 2007) on optimization of water networks;
(Mikulecký et al. 2008) on water management at
river basin scale; and (Hailu and Thoyer 2005) on
allocation of scarce water, among others.
Complex problems, such as the problem
considered in this article, can be resolved using
distributed agents because the agents can handle
combinatorial complexity in a real-time suboptimal
approach (Maturana et al., 2004).
The structure of this paper is as follows. Firstly,
we introduce the agent-based ingredients, then
describe the used implementation, and finally,
present the main results. A conclusions section
closes the paper.
ICSOFT 2009 - 4th International Conference on Software and Data Technologies
84
2 MULTI-AGENT METAPHOR
In the study of complex systems, computer programs
have played an important role. However, the actual
process of writing software is a complicated
technical task with much room for error. Multi-agent
philosophy adopts a modelling formalism based on a
collection of independent agents interacting through
discrete events. Simulation of discrete interactions
between agents stands in contrast to continuous
system simulations, where simulated phenomena are
quantities in a system of coupled equations.
An agent is any actor in a system: any entity that
can generate events that affect itself and other
agents. In the problem we consider below, agents are
consumption nodes, connecting pipes, supply
sources, ground and underground patches containing
the network; as well as district metered areas, which
are set of nodes, pipes, sources, and patches. Even
the whole network is an agent following specific
scheduled actions. In these last two cases, agent
behaviour is defined by the emergent actions of the
agents they contain.
Agents define the basic objects in the system –
the simulated components. The simulation occurs in
the modelled world itself, and it is frequent to speak
of agents as living in an environment, which, in its
turn, can be an agent itself.
Once agents have been defined and their
relationships established, a schedule of discrete
events for these objects defines a process occurring
over time. Individual actions take place at some
specific time; and time only advances alongside
events scheduled at successive times. A schedule is a
data structure that combines actions in the specific
order in which they should execute. The passage of
time is modelled by the execution of the events in
some sequence. Instructions are given to hundreds or
thousands of independently operating agents. This
makes it possible to explore the connection between
the micro-level behaviour of individuals; and the
macro-level patterns that emerge from the
interaction of many individuals.
A final step consists in observing the model and
recording what is happening. Observers perform
these actions. In most platforms there are also agents
with specific tasks, such as plotting, storing data,
monitoring and displaying certain variables, etc.
Agents should possess the following properties:
autonomy, mobility, reactivity, pro-activity,
adaptability, communicativeness, robustness,
learning ability, task-based orientation, and goal-
based orientation (Lee, 2006).
The agent-based approach is worthwhile
(Wooldridge and Jennings, 1995), (Wooldridge,
2002) when facing:
• open, highly dynamic, variable, poorly
structured, uncertain situations
• where the environment can be seen as a system
of autonomous, cooperative, or competitive entities
• data, control, or expertise is distributed
• the system can be divided into independent
components.
3 IMPLEMENTATION
NetLogo (NetLogo, 2007) is an environment for
developing complex, multi-agent models that evolve
over time. It is possible to create populations of
changing agents in a suitable grid of stable agents.
The evolution of agents can take different forms.
Agents can be created, move, change their
properties, change their behaviour, change their
nature or breed, and even die.
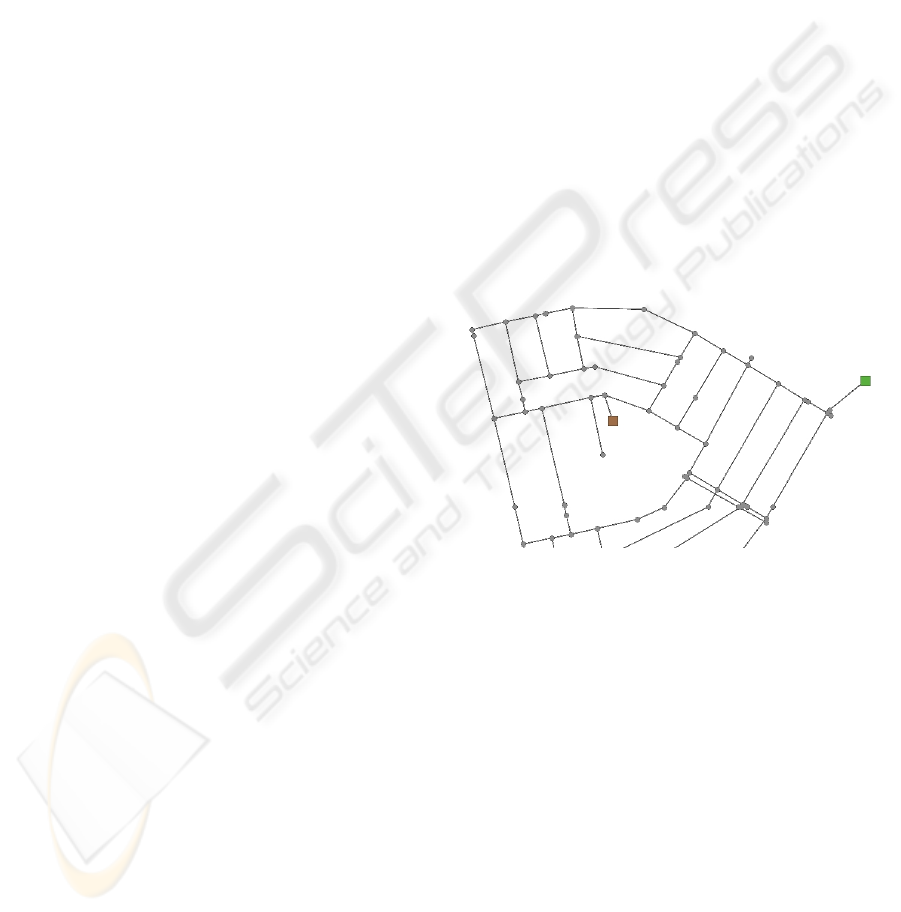
Figure 1: Detail of the network in NetLogo environment.
Our model is created from GIS data defining the
physical and topological network characteristics.
The experimental data was obtained from a GIS
model of a real moderately-sized network that has
been studied by the authors within a joint research
project with an international water company. This
network is a part of a water distribution system in a
Latin American capital.
The area is divided into squares (patches), which
gives some raster format to the environment. Patches
represent the ground (underground) where pipes and
nodes are buried. Figure 1 shows a section of the
network. Patches are used to define areas occupied
by the different divisions that will be created. As a
consequence, this raster structure cannot be observed
in Figure 1. Consumption nodes (small circles) are
agents (turtles) of a certain breed with a number of
associated variables. Among the user-defined
AGENT-BASED DIVISION OF WATER DISTRIBUTION SYSTEMS INTO DISTRICT METERED AREAS
85
variables, elevation and demand are the most
important. During the process, colour is used to
define the DMA that the agents belong to. Pipes
(grey lines) are links (in the problem under
consideration they are undirected links). Each pipe
connects two different nodes and also has some
associated variables. The main user-defined
variables are diameter and length. Source points
(coloured squares) are another breed of turtles,
whose variables are the average of the demand they
supply and the DMAs they feed. Patches, sources,
nodes, and pipes are spatially fixed agents in the
sense that, obviously, they do not change their
position with time. Instead, they change their
properties, especially colour, and as a result they
eventually belong to one DMA or another. Initially,
the sources, nodes, and pipes are presented in light
grey, since no district structure is available at the
setup.
In this model, the user decides the number of
DMAs to be built. Then, randomly the same number
of source points are selected to be the seeds for the
corresponding districts. Upon setup, these turtles
start a process of probing their neighbouring nodes
and checking the likelihood of their neighbours
being assimilated into the same would-be DMA as
themselves. This likelihood is derived from a
number of tests, which are performed on the basis of
sources, nodes, and pipe properties:
• the total length of the current DMA must be
bounded by minimum and maximum values for the
total length of the set of its members,
• the elevation of a new candidate must be in a
certain range around the average elevation of the
current DMA,
• the total demand of the sector must be between
certain pre-fixed limits,
• the associated sources must be able to meet that
demand,
• the geometrical properties of the area occupied
by a DMA must exhibit certain basic requirements
(connectivity, convexity, etc.),
• other properties.
Nodes and pipes passing these tests are
assimilated to the winning DMA, and the process is
repeated again. The process is able to find good
solutions for the connectivity between DMAs. As a
consequence, the number and location of the closure
valves is optimized for a given layout. In addition,
nodes are assigned to sectors in a remarkably stable
way that further stabilizes during the evolution of
the process. Also, the best partitions can be found
with frequency during different runs of the process.
As a result, by repeating the process a certain
number of times, the engineer can make a final
decision that may, or may not, coincide with any of
the obtained partitions – these being used as a basis
for the decision.
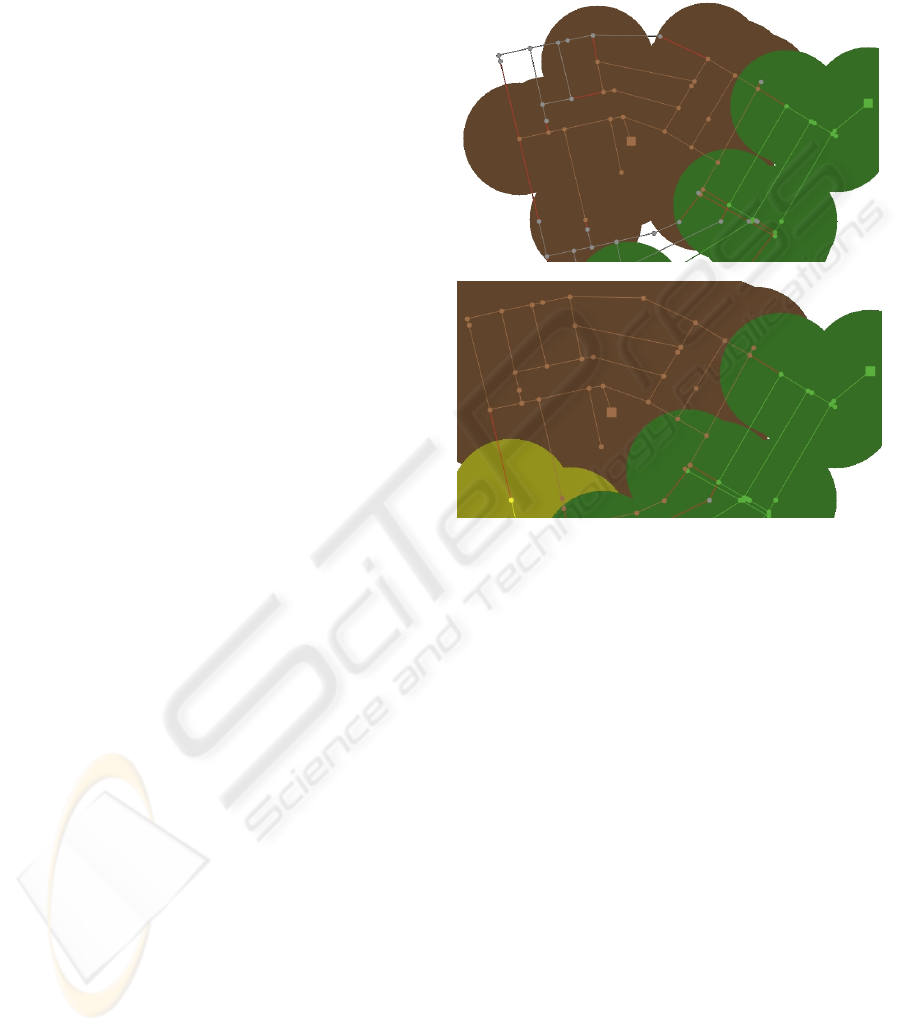
Figure 2: Two stages of the sectorization process.
Neighbouring nodes for every hydraulic sector or
division are explored in each step of the algorithm.
These nodes are given a certain probability of
belonging to a given district. This probability
reflects the difference between the elevation of the
node and the average elevation of the district; and
the difference between its demand and the average
demand of the sector. In this way, the simple greedy
competition based on minimum distance among the
districts is improved, and this adds increased
probabilistic richness to the process. As a result, the
model agents, performing a mixture of individual
and collective actions, can explore good network
sectorization layouts.
From the point of view of Logo programming,
the functions self and myself are essential to define
the list of inputs of the agent (set of agents) to be
interrogated, and the agent (set of agents) making
the enquiry. In other words, nodes are assigned to a
given sector after some dialectic process of
neighbouring enquiries among different sectors
competing for the node (see Figure 2 showing two
stages of the process). In the upper part of the figure,
a number of nodes (coloured) have already been
ICSOFT 2009 - 4th International Conference on Software and Data Technologies
86
assigned to specific sectors, while others (grey) are
still unassigned. Regarding pipes, grey means
unassigned, and red is used to identify pipes
connecting two different sectors.
to add-to-cluster
ifelse any? link-neighbors with [color != [color] of
myself and shape != "square"]
[ask one-of link-neighbors with [color != [color] of
myself and shape != "square"][
let color1 color
set color [color] of myself
if zoning [splotch]
ask my-links [set color [color] of myself]
let elevation-cluster mean[elevation] of turtles
with [color = [color] of myself]
let demand-cluster mean[demand] of turtles with
[color = [color] of myself]
let resist weight-elevation * ([elevation] of self -
elevation-cluster) + weight-demand *
([demand] of self - demand-cluster)
if random 100 < resist [
set color color1
ask my-links [set color color1]
if zoning [splotch]
build-cluster]
]
]
[stop ]
end
Figure 3: Assignment procedure.
Figure 3 shows the assignment procedure that
decides the assignment of nodes for a calling sector.
Firstly, neighbouring nodes for the calling sector are
scanned. Then a decision is made about the colour to
be assigned to a neighbouring node. This decision is
performed by weighting the difference between the
node’s elevation and demand with regard to the
average elevation and demand of the calling sector
(bold line in Figure 1). This weighted difference
provides a resistance degree (resist) in terms of the
probability of making a decision about joining the
calling hydraulic sector. The weights influencing
this difference are selected by the user through the
slider called ‘weight-demand’ (see Figure 4). Once a
new configuration has been built, other requisites
(sector size, connectivity, etc.) are checked before
validating the configuration. Borders between
sectors – which can be fuzzy – are identified by red
pipes, showing the location of cut-off valves, which
are used to isolate the sectors during operation.
The natural consequence of this process is that
different DMAs are built and minimal sets of
sectioning lines are identified. Nevertheless, some
nodes may end up disconnected and borders between
sectors may be poorly defined. The main objective is
the identification of DMAs and sectioning lines. The
information about disconnected nodes and overlaps
between nodes and pipes of certain colours with
sectors of a different colour (lower part of Figure 2)
can also be used by the network manager. These
circumstances, which show that the desired balance
is still undergoing some debate regarding
assignations, can be used to detect errors in network
data, propose candidate areas for sensitivity
analyses, and encourage various actions aimed at
improving the layout and/or the topology of the
network.
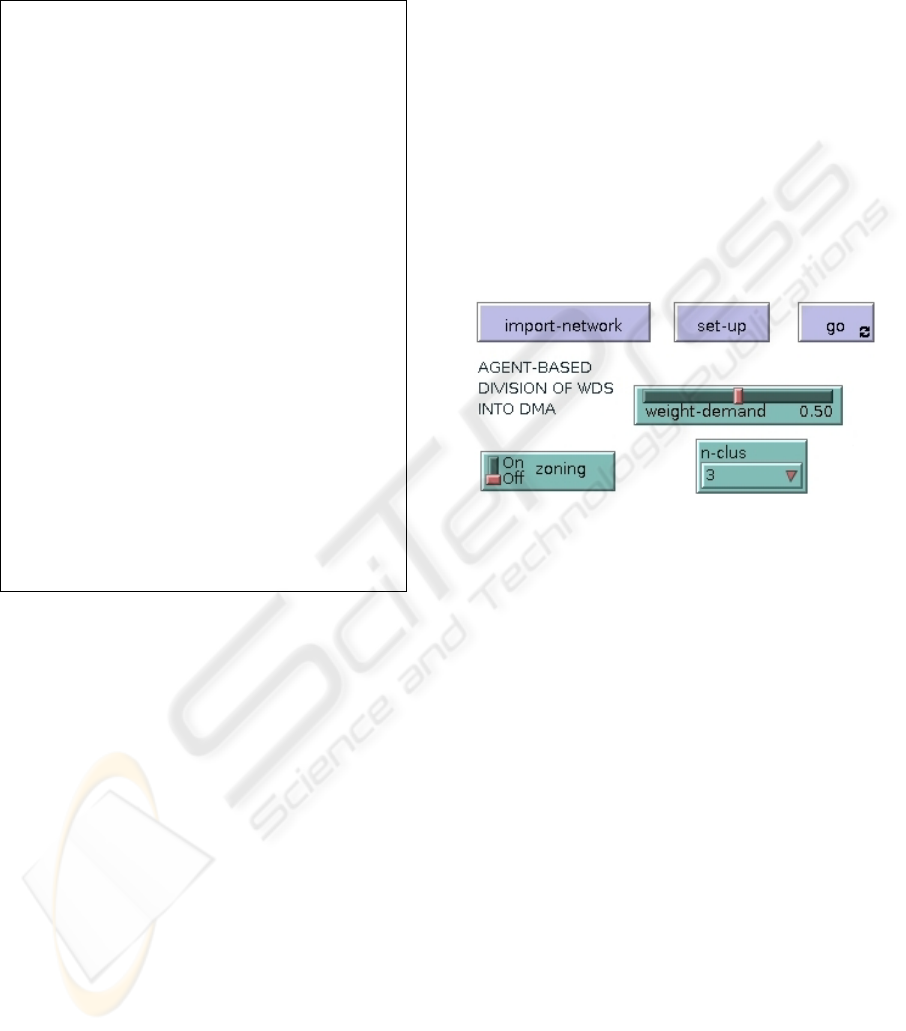
Figure 4: The interface elements.
Through additional interface elements, the user
can manage the course of the simulation by
changing different parameters (see Figure 4). The
membership probability measurements of a node
with respect to a district depend on elevation and
demand. As stated earlier, the user can modify the
weight of these elements by using the slider labelled
‘weight-demand’. The default for this value is 0.5,
and the sum of the weights corresponding to
elevation and demand is 1.
The user can decide a priori the number of
hydraulic sectors to be built by selecting an option
from the chooser labelled ‘n-clus’. By using switch
‘zoning’ the user can also ask the program to colour
the patches occupied by the different hydraulic
sectors. This option, as well as offering an
interesting visual value, enables the user to decide if
the built districts exhibit good topological properties.
Certain convexity and/or compactness properties are
desirable for the districts. By default (option off), the
different colours for the pipes and nodes make clear
the division of the hydraulic network into districts.
By flipping the switch to ‘on’, patches are coloured
according to the colour of the nodes and pipes they
contain. This option is useful for revealing overlaps
AGENT-BASED DIVISION OF WATER DISTRIBUTION SYSTEMS INTO DISTRICT METERED AREAS
87
between sectors which, as explained before, can be
used to produce suitable sensitivity analyses.
Finally, those pipes that enable
isolation/communication between two sectors are
represented in red, and provide the engineer with
useful information about the candidate pipes for
sectioning and where to install cut-off valves to
isolate the districts.
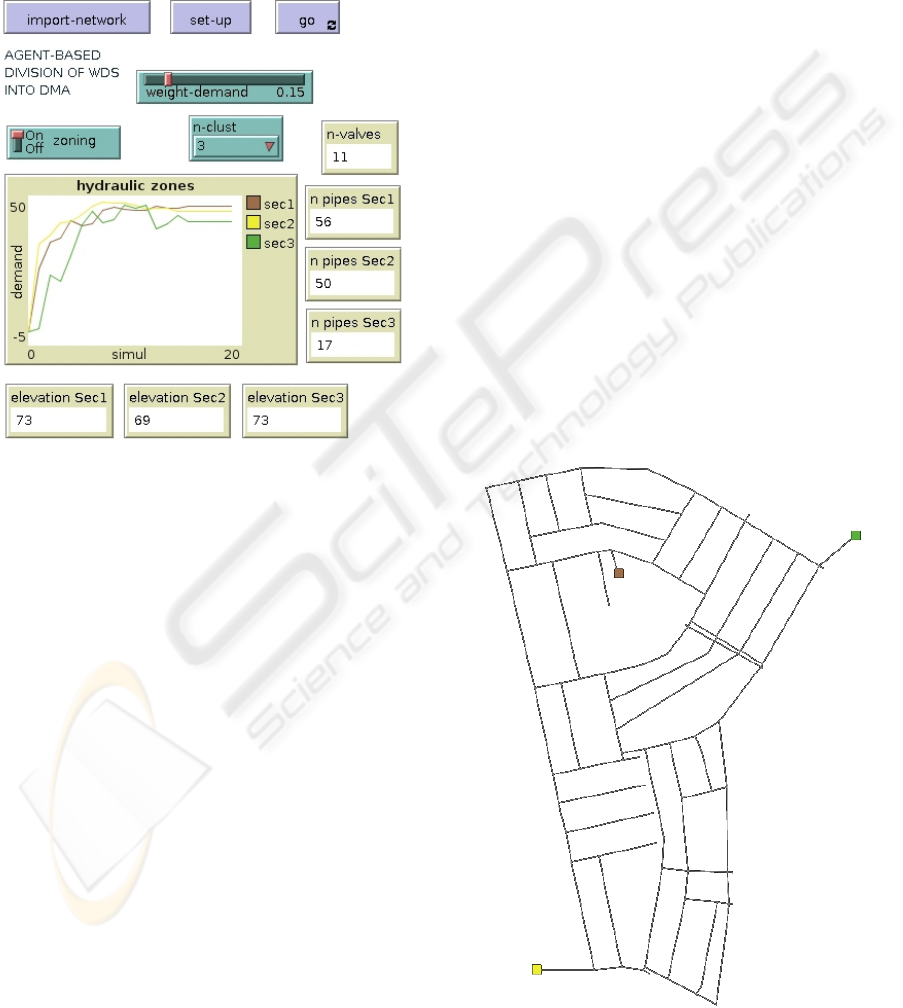
Figure 5: Interface including monitors.
The simulation results can be visualized on
screens, plots, and graphs; and data can be stored for
further processing in hydraulic simulation software
and for decision-making support.
Figure 5 presents several displays showing some
of the used parameters, such as the average elevation
of the different sectors and the number of pipes in
the sectors. Of special importance is the display
labelled ‘n-valves’ which shows the number of
sectioning links connecting different sectors; and
corresponds to closing valves for the given partition.
Engineers must take important decisions about the
need to install closing valves in existing pipes, and
about sectioning those pipes, and/or introducing new
pipes that redistribute the flow in more a reasonable
manner.
Our simulation model helps managers
communicate with domain experts, because they can
perform their reasoning by solving modelled
situations. The model is based on simple physical
principles, but its large-scale modification is
straightforward.
4 RESULTS
To show the performance of the presented process,
we present the results for a network (see Figure 6)
fed by three reservoirs and made of 132 lines and
104 consumption nodes; its total length being
9.055km, and the total consumed flowrate
amounting to 47.09l/s.
After 20 runs of the model simulating the
partition of this network into hydraulic sectors, the
configuration shown in Figure 7 was obtained in
80% of the cases. As a result, three sectors have
been obtained that are isolated through 11 cut-off
valves (links shown in red). These sectors have 56,
50, and 17 pipes, respectively. All of these sectors
satisfy the requirements for becoming valid
hydraulic sectors in terms of maximum and
minimum total pipe lengths.
The average elevations for these sectors are 73m
for the brown sector, 69m for the yellow sector, and
again 73m for the green sector. As shown by the
plots in Figure 5, the architecture of the sectors
stabilizes during the simulation. In this case, it is the
evolution of the average sector demand that is
represented. We have chosen this graph since it
shows the main reason why the green sector appears
as a genuine sector, despite the fact that its average
elevation coincides with that of the brown sector.
Figure 6: Layout of the studied network.
ICSOFT 2009 - 4th International Conference on Software and Data Technologies
88

Finally, it is noteworthy that the validity of the
district division has been checked using EPANET2.
The analyses performed show that the proposed
division effectively cuts the water supply for the
desired parts of the network. Also, the entire
network and individual sectors maintain all their
design requirements. As a consequence, the
proposed division into DMAs is perfectly feasible
and reliable.
5 CONCLUSIONS
The multi-agent metaphor has been used with
success in different areas and is reasonably
applicable in the water management field. In
addition to the traditional centralized architecture of
a single reasoning agent (the computing counterpart
of human decision support), it is possible to use
systems of reasoning agents, or to apply multi-agent
simulations to verify hypotheses about the various
processes in water distribution. Partial
implementations of multi-agent applications are
expected to simplify communication with domain
experts during the process of modelling the expert
knowledge, identifying needs, and summarizing
requirements for final application operation. Among
the various scenarios using multi-agent systems in
the scope of decision support for a water
management company, we have focused on the
division of a network into district metered areas.
Division into DMAs helps the decision-making
process, as well as the implementation of suitable
actions to improve the control of a network and give
solutions for important aspects of water distribution
management – such as leaks and water quality.
Figure 7: Final distribution of hydraulic sectors.
We will be researching various lines of research
in the future. One line of action will be addressed to
exploiting the presented model in a number of ways:
adding new conditions to cluster building; refining
the implemented clusters; and generally improving
the performance of the model. An interesting
improvement would consider starting the process
automatically, instead of waiting for the user to
define a priori the number of sectors, thus
performing the division into an optimum number of
sectors. The model must also be applied to larger
networks. Nevertheless, taking into account that the
considered network is medium-sized and running
times are slow (ranging between 10 and 20 seconds
on a PC with an Intel Core 2 Duo T5500 (1.66 GHz)
processor for the case considered), no added
difficulties are foreseen. Another line of research
will focus on the development of other scenarios for
multi-agent applications in the water supply field,
including aspects related to water quality and other
managerial issues.
ACKNOWLEDGEMENTS
This work has been performed with support from
grants BES-2005-9708 and MAEC-AECI
0000202066, awarded to the second and third
authors, respectively, by the Ministerio de
Educación y Ciencia and the Ministerio de Asuntos
Exteriores y Cooperación of Spain.
REFERENCES
Tzatchkov, V.G., Alcocer-Yamanaka, V.H., Bourguett-
Ortíz, V., 2006. Graph Theory Based Algorithms for
Water Distribution Network Sectorization Projects.
8th Annual Water Distribution Systems Analysis
Symposium, Cincinnati, Ohio, USA, August 27-30.
Izquierdo, J., Montalvo, I., Pérez, R., 2008. Aplicaciones
de la inteligencia colectiva (multiagente) para la
optimización de procesos en hidráulica urbana. Invited
talk at VIII Seminario Iberoamericano – SEREA
Influencia sobre el Cambio Climático, la eficiencia
energética, de operaciones y Sistemas de Seguridad en
el abastecimiento y el drenaje urbano.
Maturana, F.P. et al., 2004. Real time collaborative
intelligent solutions, SMC (2) 2004, 1895-1902.
Maturana, F.P., Kotina, R., Staron, R., Tichý, P., Vrba, P.,
2006. Agent-based water\waste water control system
architecture. IADIS International Conference Applied
Computing.
AGENT-BASED DIVISION OF WATER DISTRIBUTION SYSTEMS INTO DISTRICT METERED AREAS
89

Nichita, C., Oprea, M., 2007. Water Pollution Diagnosis
with a Multi-Agent Approach. In Proceedings,
Artificial Intelligence and Soft Computing.
Kotina, R., Maturana, F.P., Carnahan, D., 2006. Multi-
agent control system for a municipal water system.
Proceedings of the 5th WSEAS International
Conference on Artificial Intelligence, Knowledge
Engineering and Data Bases, Madrid, Spain, 464-469.
Feuillette S., Bousquet F., Le Goulven P., 2003. SINUSE:
a multi-agent model to negotiate water demand
management on a free access water table.
Environmental Modelling and Software, 18(5), 413-
427.
Hai-bo, L., Guo-chang, G., Jing, S., Yan, F., 2005. Multi-
agent immune recognition of water mine model.
Journal of Marine Science and Application, 4(2), 44-
49.
Becu, N., Perez, P., Walker, A., Barreteau, O., 2001.
CatchScape: An integrated multi-agent model for
simulating water management at the catchment scale, a
northern Thailand case study. In: Ghassemi, F. et al.
(Eds). Integrating Models for Natural Resources
Management Across Disciplines, Issues and Scales.
International Congress on Modelling and Simulation,
Canberra, Australia, 1141-1146.
Cao, K., Feng, X., Ma, H., 2007. Pinch multi-agent
genetic algorithm for optimizing water-using
networks. Computers & Chemical Engineering,
31(12), 1565-1575.
Mikulecký, P., Bodnárová, A., Olševičová, K., Ponce, D.,
Haviger, J., 2008. Application of multi-agent systems
and ambient intelligence approaches in water
management. 13th IWRA World Water Congress,
Montpellier (France).
Hailu, A., Thoyer, S., 2005. Multi-Unit Auctions to
Allocate Water Scarcity Simulating Bidding
Behaviour with Agent Based Models. LAMETA
Working paper 2005-01, EconWPA.
NetLogo homepage, 2007 [online]
http://ccl.northwestern.edu/netlogo/
Wooldridge, M., 2002. An introduction to MultiAgent
Systems. John Wiley & Sons, Chichester, UK.
Wooldridge, M., Jennings, N., 1995. Intelligent agents:
theory and practice. In: The Knowledge Engineering
Review 10(2), 115-152.
Lee, R.S.T., 2006. Fuzzy-Neuro Approach to Agent
Applications: From the AI Perspective to Modern
Ontology. Springer-Verlag.
Aguas de Valencia, (2009). Sectorización [online] URL:
https://www.aguasdevalencia.es/portal/web/Tecnologi
a/Tecnologia/GestionRedes/Sectorizacion.html
[accessed: 11 March 2009]
Morrison, J., 2004. Managing leakage by District Metered
Areas: a practical approach. Water 21, 44-46.
UK Water Industry Research Ltd, 1999. A Manual of
DMA Practice. London: UK Water Industry Research.
IWA Water Loss Task Force, 2007. District Metered
Areas: Guidance Notes. Version [online] URL:
http://www.waterlinks.org/upload_file/8f4be72e-
5027-cbe8-40ed-ee12d1fe6495.pdf, February 2007,
100 pp., [accessed: 11 March 2009]
Hunaidi, O., 2005. Economic comparison of periodic
acoustic surveys and DMA-based leakage
management strategies. Leakage 2005 Conference
Proceedings, Halifax, N.S., Canada.322-336.
ICSOFT 2009 - 4th International Conference on Software and Data Technologies
90
