
A PSYCHOACOUSTICALLY MOTIVATED SOUND ONSET
DETECTION ALGORITHM FOR POLYPHONIC AUDIO
Balaji Thoshkahna and K.R.Ramakrishnan
Dept of Electrical Engg, Indian Institute of Science, Bangalore, India
Keywords:
Moore’s loudness model, Psychoacoustics, Onset detection, Polyphonic audio.
Abstract:
We propose an algorithm for sound onset detection applying principles of psychoacoustics. A popular model
of loudness perception in human auditory system is used to compute a novelty function that allows for a more
robust detection of onsets. The psychoacoustics paradigm also allows us to define thresholds for the novelty
function that are both physically and perceptually meaningful and hence easy to manipulate according to the
application. The algorithm performs well with an overall accuracy of detection of 86% for monophonic audio
and 82% for polyphonic audio.
1 INTRODUCTION
A sound onset is a temporal event in an audio when
a new sound enters the auditory scene. Based on
either physical or perceptual properties onsets can
be classified as physical onsets (when a significant
sound is generated by a sound source) or perceptual
onsets (when the onset is perceived). The problem of
detecting an onset is then to identify the time instant
of the sound’s entry in the audio stream.
To accomplish this, a common technique is to convert
the audio to a downsampled mid-level representation
called the detection / novelty function that highlights
the sound onsets as peaks while suppressing steady
state sounds(J.P.Bello et al., 2005). Onset detection
is achieved by picking local peaks in the detection
function. Onsets can also be classified as hard or soft
depending on the energy in the onset(J.P.Bello et al.,
2005), with hard onsets resulting from large energy
changes over a short time and soft onsets due to small
energy changes. A new onset can be the result of a
sudden change in the total signal energy or a shift in
the signal energy to a different set of frequencies.
To be able to detect an onset on account of either
of the above said reasons, an audio signal is usually
analyzed using a filterbank. A number of detection
functions are built separately for the subbands and a
joint decision is taken across the subbands to locate
onsets(J.P.Bello et al., 2005; N.Collins, 2005).
An onset is usually accompanied by a sudden change
in the subband signal energy. Using energy within
short time frames of the signal as the detection
function, onset detection can be performed (J.P.Bello
et al., 2005). Amplitude envelope differential too has
been used as a detection function (A.Klapuri, 1999)
in the place of signal energy. But the main problem
with this approach is that ’soft’ onsets are not well
detected by using energy alone(M.Gainza et al.,
2005). A new algorithm(Zhou and J.D.Reiss, 2007)
uses a decision based technique to detect onsets using
a time-frequency analysis tool for determining hard /
soft onsets using either energy or pitch.
To overcome this problem, usually signal phase
based features have been used either alone(J.P.Bello
and M.Sandler, 2003) or in tandem with the energy
feature (J.P.Bello et al., 2004; C.Duxbury et al.,
2003). The phase of the signal changes abruptly at an
onset while it tends to remain relatively stable during
the steady state.
A few newer methods of solving the onset detection
problem include using linear prediction on the signal
(Lee and Kuo, 2006), using comb filters to find the
spectral flux of the signal across frames (M.Gainza
et al., 2005) and non-negative matrix factorization
based method on the magnitude spectrum (W.Wang
et al., 2006). A comprehensive list of onset detection
algorithms and their relative performances can be
94
Thoshkahna B. and R. Ramakrishnan K. (2009).
A PSYCHOACOUSTICALLY MOTIVATED SOUND ONSET DETECTION ALGORITHM FOR POLYPHONIC AUDIO.
In Proceedings of the International Conference on Signal Processing and Multimedia Applications, pages 94-99
DOI: 10.5220/0002238400940099
Copyright
c
SciTePress
found in (N.Collins, 2005; J.P.Bello et al., 2005;
S.Dixon, 2006).
One of the main disadvantages of the above men-
tioned techniques is the need to set thresholds at
many stages in the algorithm especially during the
peak picking stage and the need to jointly optimize
these thresholds for best performance. Most of the
times these thresholds are empirically selected for
specific databases or audio (like wind instruments or
percussion) . These thresholds do not always seem
to have a perceptual correspondence to the audio.(
Ex: Using α times the median energy as a thresh-
old(C.Duxbury et al., 2003) doesn’t always imply
that the onsets selected are perceptually relevant.
Also α is a constant that is empirically selected for a
particular class of audio.).
We propose a psychoacoustically motivated onset
detector that is a modification of our previous onset
detector(Thoshkahna and K.R.Ramakrishnan, 2008)
that picks perceptually relevant onsets. The algorithm
performs a normalization on every audio so that the
thresholds set remain the same for any input audio.
Our thresholding schemes have a strong physical
correlation to the signal. We compare our system
to a previous onset detection system by Klapuri
(A.Klapuri, 1999) and show that we improve on his
method.
The paper is organized as follows. Section 2 outlines
our method along with the model of loudness used
in this work. We discuss the differences between our
method and Klapuri’s method in section 3. Experi-
ments to show the performance of the proposed algo-
rithm are detailed in section 4.
2 LOUDNESS MODEL BASED
ONSET DETECTION
ALGORITHM
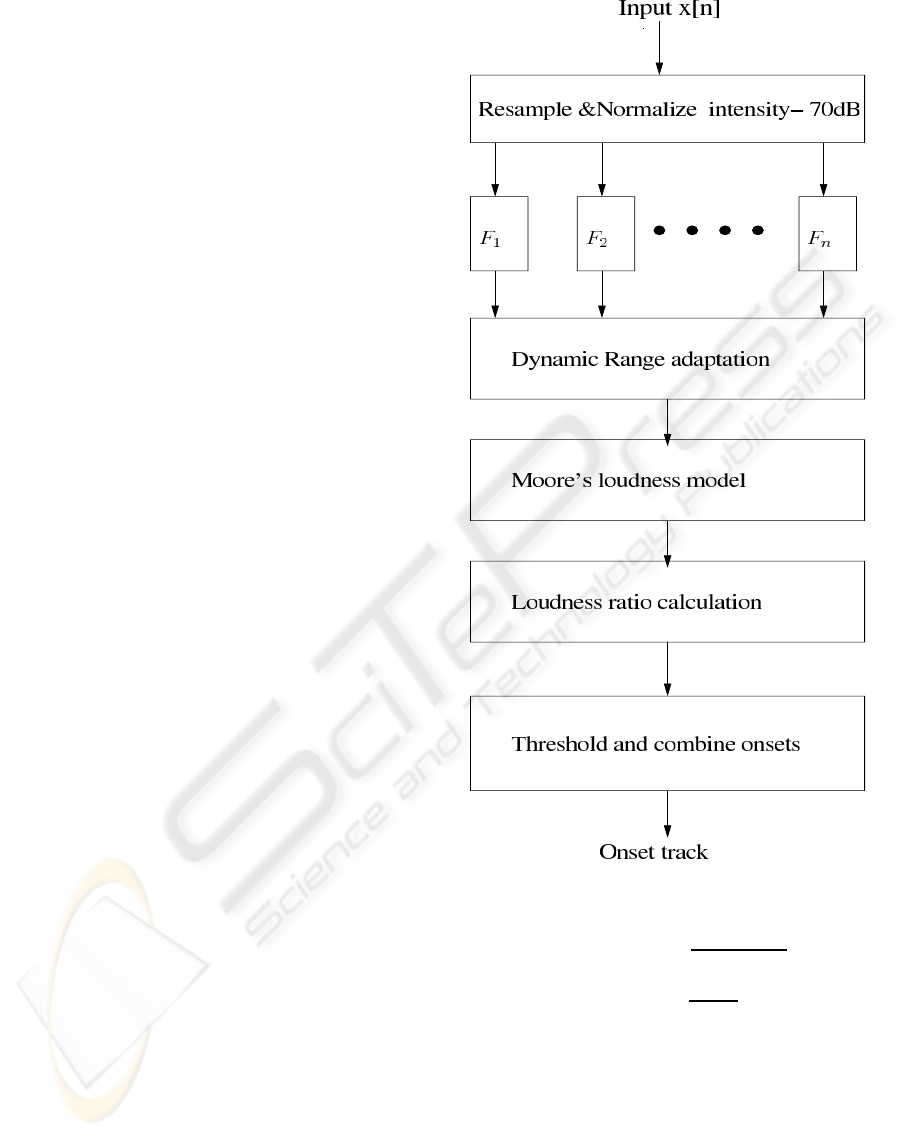
A block diagram of our system is shown in Fig.1 and
we explain each of the blocks in detail below.
2.1 Normalization of Input Audio
This first step takes care of various recording and sam-
pling conditions. All audio are resampled to 16kHz
and their rms(root mean squared) SPL( sound pres-
sure level) scaled to 70dB to simulate a comfortable
hearing level among humans(A.Klapuri, 1999). We
have,
Figure 1: Onset detector.
X
rms
= 20∗ log
10
∑
N−1
0
x[i]
2
N ∗ 0.00002
!
(1)
A
norm
= 10
70−X
rms
20
(2)
x
′
[n] = A
norm
.x[n] (3)
where X
rms
is the rms of the signal x, and A
norm
is the
normalization factor used to scale the audio and N is
the number of samples in the signal.
A PSYCHOACOUSTICALLY MOTIVATED SOUND ONSET DETECTION ALGORITHM FOR POLYPHONIC
AUDIO
95

2.2 ERB (Equivalent Rectangular
Bandwidth) Filterbank
We follow a frame based processing to allow for the
dynamic nature of hum signals. The normalized au-
dio is split into frames of 30ms with an overlap of
10ms to ensure a smooth variation in signal charac-
teristics. This signal is passed through an ERB fil-
terbank stretching from 50Hz to 8kHz. There are
126 uniform 0.25 ERB apart filters in the ERB scale
in the frequency range of interest. Signal rectifica-
tion and energy integration within the 30ms window
is performed to simulate the workings of the inner
ear(B.C.J.Moore et al., 1997). Each frame of audio
now has 126 excitation energy features that are fed to
the range adaptation block that simulates a time local-
ized dynamic range adaptation.
2.3 Dynamic Range Adaptation
A large window of 5 secs is chosen to adjust the
dynamic range of hearing. Within each 5 second
window there are 2500 frames of audio. Each frame
of audio has 126 bins called the T-F bin. To simulate
the dynamic range adaptation, we choose the T-F
bin that has the maximum energy over a 5s window.
Even though humans have a huge dynamic range
of over 100dB, the dynamic range within the 5
second window is restricted to 35dB, by choosing the
maximum energy bin and neglecting all audio bins
below 35dB of this. This enables us to neglect low
energy bins that may experience a substantial change
in partial loudness but would be inconsequential for
the total loudness that is finally perceived(See .2.4
for details).
Furthermore, for each frame in this 5s window, we
choose a maximum T-F bin and retain only those
T-F bins whose energies are within 25dB of this
maximum and make the rest of the T-F bin energies
zero. This step has the effect of neglecting low
energy sub-bands from contributing to the actual
onset detection process. We clarify this step with
an example. Let us say sub-band j of frame i has a
loudness of 0.05 sones, while the maximum loudness
in frame i is 1 sone contributed by sub-band k. Let,
for frame i + 1 the loudness in sub-bands j and k
are 0.1 and 1.5 respectively. Then, as explained in
Sec.2.5, unless we weigh the sub-bands or even if
we take relative changes, the loudness change in
sub-band j is more significant than that in sub-band
k. But it is obvious that sub-band k contributes more
than sub-band j to the total loudness at frame i and
hence is more appropriate to consider the changes
occurring there.
This dynamic range adaptation gives us around 7%
improvement in onset detection for polyphonic au-
dio over a previous version of the same algo-
rithm(Thoshkahnaand K.R.Ramakrishnan, 2008) and
hence this step was retained even though the ear does
not display such a short term adaptation phenomenon
that we know of. The empirical values of 35dB and
25dB were arrived at after testing on a variety of au-
dio. This modified audio signal is used as the ex-
citation signal to the loudness model(B.Moore and
B.Glasberg, 1983). We use the model of loudness
for human auditory system proposed by Moore et
al(B.C.J.Moore et al., 1997) to detect onsets in poly-
phonic audio.
2.4 Moore’s Model of Loudness
We have used the modifications done by Timoney et
al (J.Timoney et al., 2004) to the Moore’s loudness
model with certain changes as explained below. The
equation to compute loudness within each subband is
as follows;
L
i
(k) = C.(E
sig
(i, k)
α
− E
th
(i)
α
) (4)
where L
i
(k) is the partial loudness in the i
th
sub-
band of the ERB filterbank for the k
th
frame, E
sig
(i, k)
is the excitation of the i
th
subband of the k
th
frame
and E
th
(i) is the excitation due to the threshold of
hearing at the i
th
subband. We get the E
th
(i) by pass-
ing pure sinusoids ( of rms MAF ( Minimum Audible
Field ) values at the filter centres ) through the ERB
filterbank. The constant α does the audibility range
compression that occurs in the human auditory sys-
tem and has a value of 0.093 and the constant C is
used to calibrate the model and has a value of 0.583.
Calibration involved the same procedure provided in
(J.Timoney et al., 2004), except that the model is
adapted to our requirements of a higher sampling rate
and lower ERB filter distance. The model finally pro-
vides the loudness in sones and positive values ( i.e
only L
i
> 0) from each subband is weighed by the
ERB distance and added to provide the total loudness
of the frame.
2.5 Using the Loudness Lodel for Onset
Detection
As noted in section.1, the output loudness of each sub-
band is used to find the potential onsets. Since the
loudness in each subband is specified in sones, an on-
set will be seen as a sudden change in the partial loud-
ness. Thus we find the increase in subband loudness
SIGMAP 2009 - International Conference on Signal Processing and Multimedia Applications
96
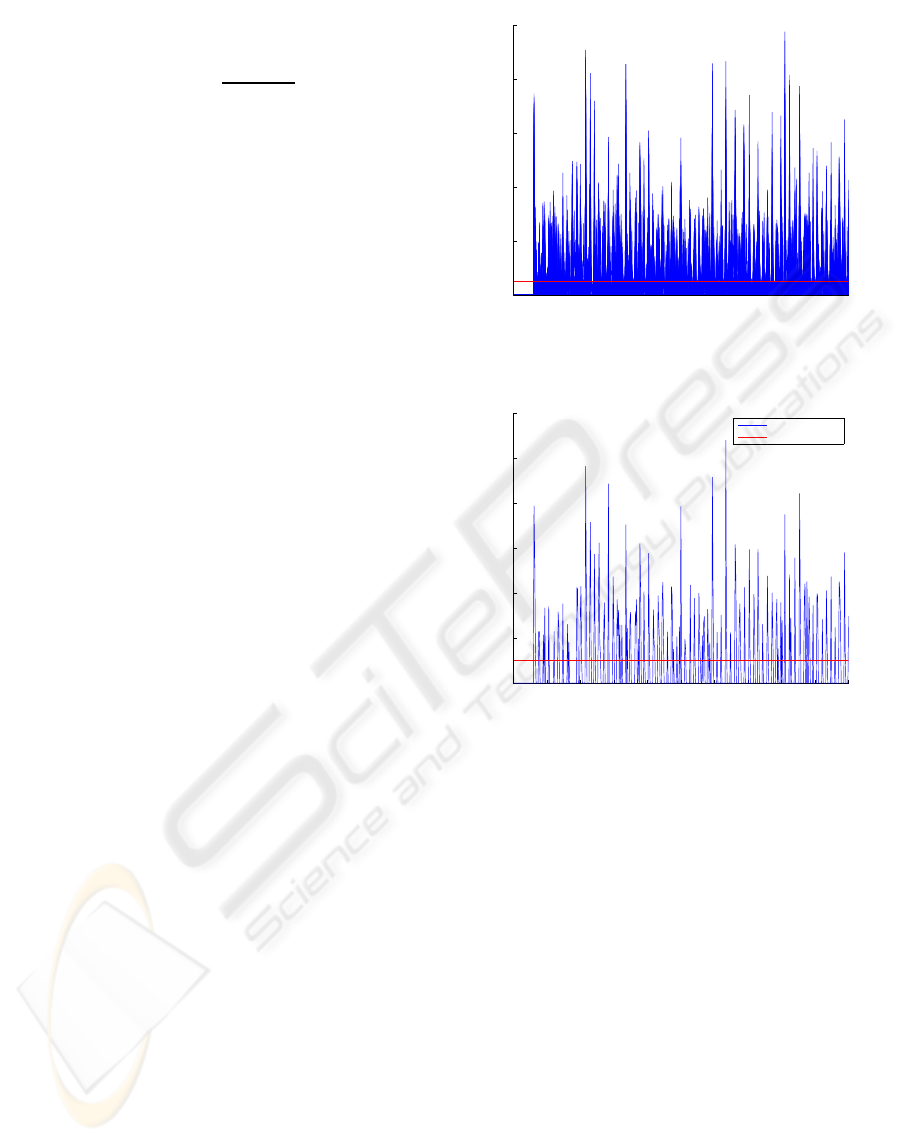
from (k− 1)
th
frame to the k
th
as our detection func-
tion SLR
i
for the i
th
subband as shown in Fig.2.
SLR
i
(k) =
L
i
(k)
L
i
(k− 1)
(5)
SLR
i
(k) > Thr
loud
(6)
We now choose a suitable threshold (a threshold of
Thr
loud
= 1.25 i.e the current frame is 1.25 times
louder than the previous frame which indicates an on-
set in the current frame) to search for potential onsets.
Only frames k that satisfy the threshold condition are
retained and grouped as potential onsets. A second
thresholding method is implemented to eliminate the
modulation effects that might be present only in cer-
tain subbands. This is done by summing the detection
function across the subbands as follows;
F
onset
(k) =
126
∑
i=1
SLR
i
(k) (7)
N
filt
(k) >= Thr
filt
(8)
F
onset
(k) > Thr
final
(9)
We now consider an onset to have occurred only
if F
onset
has significant contributions from multiple
subbands ( meaning that the sound onset is simul-
taneously occurring at different frequencies- like
say a new note on a violin). A significant loudness
change in atleast 15 subbands is used as the threshold
for this step. Monophonic sounds have sufficient
spectral disturbance when a new sound is generated.
We found that generally 3 or 4 1-ERB separated
subbands experience spectral changes during an
onset. Thus, Thr
filt
= 15 subbands are chosen to
be the threshold ( since the filters have a heavy
frequency overlap, 3-4 1ERB filters span the same
frequency range as 12-16 0.25 ERB filters). We now
have a modified detection function from which we
choose only those peaks that have a value greater
than Thr
final
= 24 ( We desire an effective doubling
of loudness in atleast 12 subbands. This 12 is the
lower limit on the number of subbands that would
experience a significant loudness change, as noted in
the previous statement). Using the F
onset
as our new
detection function we now retain only those frames
which satisfy the threshold given in Eqn(10) as the
onset locations (Fig.3). Onsets lying within 50msecs
of each other are grouped and represented by the
onset with the highest loudness as shown in Fig.4.
This final set of onsets are declared as the output
onsets for the audio.
The only thresholds that need to be set are Thr
loud
,
Thr
filt
and Thr
final
. Thr
loud
denotes how strong an
onset we wish to choose, while Thr
filt
describes the
0 50 100 150 200 250 300 350 400 450 500
0
5
10
15
20
25
Subband Loudness Ratio function
SLR value
Frame number
Figure 2: Detection function S
i
, superimposed for all the
126 bands.
0 50 100 150 200 250 300 350 400 450 500
0
50
100
150
200
250
300
Frame number
Detection function value
Detection function
Detection function
Threshold
Figure 3: Detection function F
onset
-the threshold is also
shown.
spectral spread of the onset generating source ( fre-
quency localized sounds/musical instruments need to
have a lower Thr
filt
to be detected while the con-
verse is true of texture rich instruments ).Similarly
the Thr
final
indicates what total loudness change we
wish to detect and is an indicator for the spectral dis-
turbance that occurs during sound / note onsets. A
higher value indicates that timbre rich onsets only are
detected while a lower value indicates even relatively
shallow sounds/ musical instruments can be detected.
3 DIFFERENCES WITH
KLAPURI’S WORK
Klapuri (A.Klapuri, 1999) proposed an onset detec-
tor based on psychoacoustics that used the amplitude
envelope difference function as the excitation input
to the loudness model. Since the loudness model is
A PSYCHOACOUSTICALLY MOTIVATED SOUND ONSET DETECTION ALGORITHM FOR POLYPHONIC
AUDIO
97
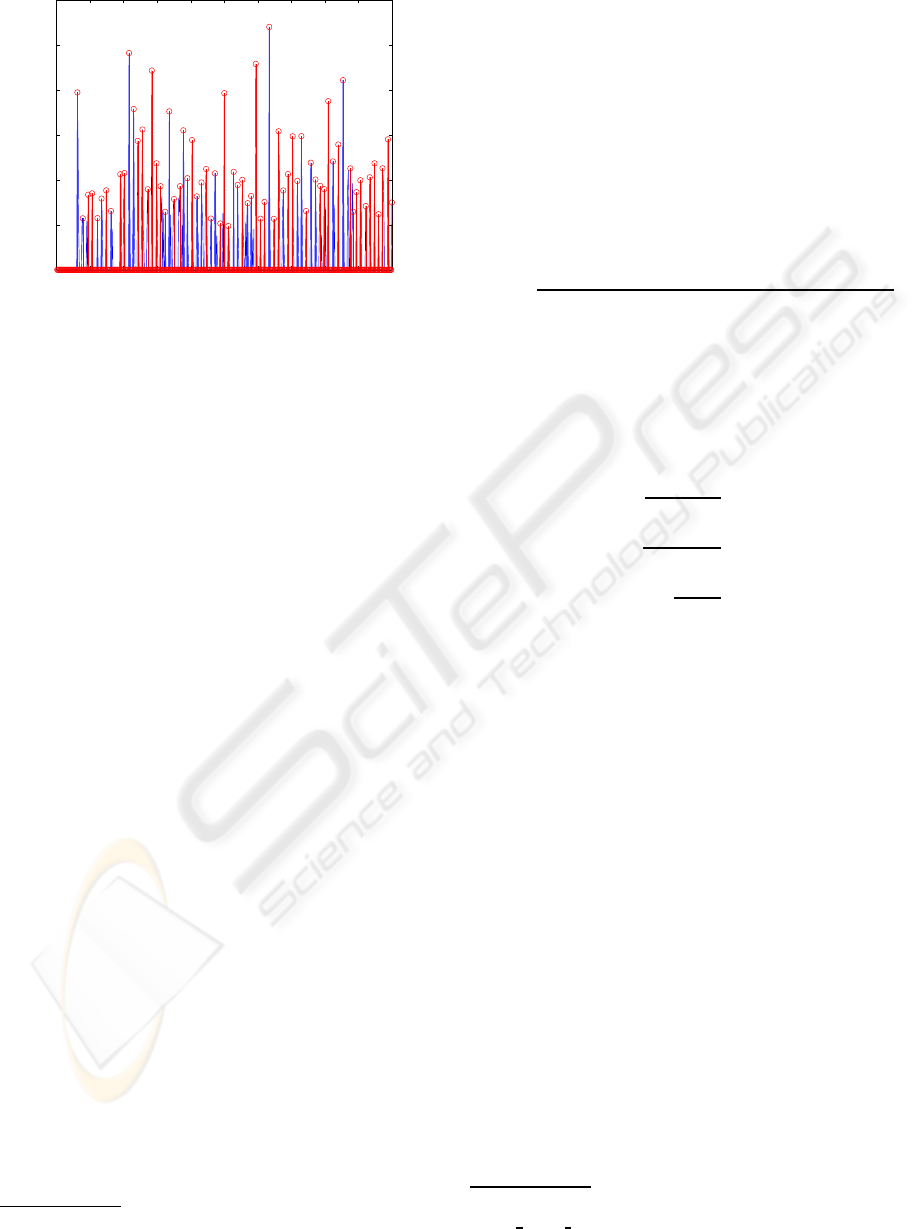
0 50 100 150 200 250 300 350 400 450 500
0
50
100
150
200
250
300
Final detection function
Frame number
Detection function value
Figure 4: Final onset locations marked by circles.
non-linear, it’s response to the envelope difference
function will not be the same as the difference of
the response to the envelope function. Thus the on-
set detection is not proportional to the actual onset
strength but only indicative of it. Another reason for
the above method to be only indicative of Moore’s
model is because the ear perceives sounds indepen-
dently without any of the pre-processing that is as-
sumed in (A.Klapuri, 1999) i.e the differencing oper-
ation on the envelope.
We did a few empirical simulations comparing both
Klapuri’s implementation and our method and found
that Klapuri’s method does not pick soft onsets that
well compared to our method in audio like Indian
classical music while our system seems to be con-
fused if there are moderate to heavy modulations in
a certain number of subbands.
4 EXPERIMENTS AND RESULTS
A database of recordings of various solo instruments
and polyphonic audio clips from CD recordings
was collected. We use a total of 18 monophonic
clips belonging to 6 classes of instruments, each of
length 10 seconds and 15 polyphonic clips of various
genres(film, pop, rock and Indian classical), each
of length 5 seconds to evaluate our algorithm. The
database has a total of 954 onsets, with an average of
33.4 onsets in each monophonic clip and 23.5 onsets
in each polyphonic clip. We have 33 audio files with
a total of 4.25 minutes of audio. Each of the database
audio clip was manually annotated using Praat
1
for
close analysis, after repeated listening by an amateur
musician using the gating technique(D.J.Hermes,
1
http://www.fon.hum.uva.nl/praat/
1990). The annotation was done independently three
times and only those onsets annotated atleast twice
were taken as true onsets.
For polyphonic audio, we changed the Thr
final
to 75
with the assumption that atleast 3 instruments would
be simultaneously active at any onset location, thus
leading to a three fold increase in the threshold ( The
remaining thresholds were unchanged).
The accuracy of the algorithm was calculated as fol-
lows(A.Klapuri, 1999);
Accu =
CorrectDetection(CD) − FalsePositive(FP)
ActualOnsets(AO))
(10)
To compare the performance of our algorithm with
standard procedures followed in the popular MIREX
competition
2
we also calculated the Precision ( P ),
Recall ( R ) and F- measure ( F ), with CD ( Correct
Detection ), FP ( False Positive ) and FN ( False Neg-
ative ) values as follows;
P =
CD
CD+ FP
(11)
R =
CD
CD+ FN
(12)
F =
2PR
P+ R
(13)
Results are tabulated in Table.1 and Table.2 for each
instrument class followed by overall performance for
monophonic and polyphonic clips.
On both the set of monophonic instrument clips and
polyphonic instrument clips the algorithm gave an ac-
curacy of 86.2% and 81.9% respectively..On wind
instruments like the flute that can have very ’soft’
onsets and quite a lot of subband modulations, the
accuracies were very low for certain audio pieces (
around 50%) but on most other instruments the ac-
curacies were above 90%. We achieved an average
P = 0.95, R = 0.91 and F = 0.93 for monophonic au-
dio and P = 0.89, R = 0.94 and F = 0.91 for poly-
phonic audio. These results better that of MIREX-
07 onset detection competition
2
. Our algorithm still
needs exhaustive testing since our database has only
4.25 minutes of total audio as against the 14 minutes
of MIREX-07 data.
5 CONCLUSIONS
In this paper we have presented a simple algorithm
using psychoacoustics to detect perceptually relevant
2
http://www.music-ir.org/mirex/2007/index.php/
Audio Onset Detection
SIGMAP 2009 - International Conference on Signal Processing and Multimedia Applications
98

Table 1: Accuracy of the onset detection algorithm.
Instrument class A.O CD FN FP Accu
WoodWind 80 64 16 3 76.25
BrassWind 52 47 5 2 86.45
Bowed String 134 117 17 0 87.31
Keyboard/Struck 141 136 5 7 91.94
Reedwind 96 82 14 4 81.25
Plucked String 99 99 0 10 89.9
Monophonic 602 545 57 26 86.21
Polyphonic 352 331 20 43 81.82
Table 2: P,R and F-measure of the onset detection algo-
rithm.
Instrument class P R F
WoodWind 0.96 0.81 0.88
BrassWind 0.96 0.9 0.93
Bowed String 1 0.87 0.93
Keyboard/Struck 0.95 0.96 0.96
Reedwind 0.95 0.85 0.9
Plucked String 0.91 1 0.95
Monophonic 0.95 0.91 0.93
Polyphonic 0.89 0.94 0.91
onsets in polyphonic audio. The same algorithm has
been modified to find offsets as well. This can be
used for the source separation problem in harmonic
mixtures of music. We have shown here that the al-
gorithm has a very good performance on a range of
instruments and music genres and hence is applicable
for the purpose of onset detection in a general sce-
nario. The algorithm has been modified to detect on-
sets in free singing for Query by Humming(QBH) ap-
plications and for percussion detection in polyphonic
audio.
REFERENCES
A.Klapuri (1999). Sound onset detection by applying psy-
choacoustic knowledge. IEEE Conference on Au-
dio,Speech and Signal Processing (ICASSP).
B.C.J.Moore, B.Glasberg, and T.Baer (1997). A model
for the prediction of thresholds,loudness and par-
tial loudness. Journal of Audio Engineering Soci-
ety(JAES),Vol.45,No.4.
B.Moore and B.Glasberg (1983). Suggested formulae for
calculating auditory-filter bandwidths and excitation
patterns. Journal of the Acoustical Society of Amer-
ica(JASA),Vol.74,No.3.
C.Duxbury, J.P.Bello, M.Davies, and M.Sandler (2003).
Complex domain onset detection for musical sig-
nals. International Conference on Digital Audio Ef-
fects(DAFx).
D.J.Hermes (1990). Vowel onset detection. Journal of the
Acoustical Society of America(JASA),Vol.87,No.2.
J.P.Bello, C.Duxbury, M.Davies, and M.Sandler (2004). On
the use of phase and energy for musical onset detec-
tion in the complex domain. IEEE Signal Processing
Letters,Vol.11,No.6.
J.P.Bello, L.Daudet, S.Abdallah, C.Duxbury, M.Davies, and
M.B.Sandler (2005). A tutorial on onset detection in
music signals. IEEE Transactions on Speech and Au-
dio Processing, Vol.13(No.5).
J.P.Bello and M.Sandler (2003). Phase based note onset
detection for music signals. IEEE Workshop on Ap-
plications of Signal Processing to Audio and Acous-
tics(WASPAA).
J.Timoney, T.Lysaght, M.Schoenwiesner, and L.McManus
(2004). Implementing loudness models in mat-
lab. International Conference on Digital Audio Ef-
fects(DAFx).
Lee, W.-C. and Kuo, C. (2006). Improved linear pre-
diction technique for musical onset detection. In-
telligent Information Hiding and Multimedia Signal
Processing(IIH-MSP).
M.Gainza, E.Coyle, and B.Lawlor (2005). Onset detection
using comb filters. IEEE Workshop on Applications of
Signal Processing to Audio and Acoustics(WASPAA).
N.Collins (2005). A comparison of sound onset detection
algorithms with emphasis on psychoacoustically mo-
tivated detection functions. Proceedings of Audio En-
gineering Society Convention.
S.Dixon (2006). Onset detection revisited. International
Conference on Digital Audio Effects(DAFx).
Thoshkahna, B. and K.R.Ramakrishnan (2008). A psy-
choacoustics based sound onset detection algorithm
for polyphonic audio. International Conference on
Signal Processing(ICSP).
W.Wang, Y.Luo, J.A.Chambers, and S.Sanei (2006). Non-
negative matrix factorization for note onset detection
of audio signals. IEEE International Workshop on
Machine Learning for Signal Processing(WMLSP).
Zhou, R. and J.D.Reiss (2007). Music onset detec-
tion combining energy based and pitch based ap-
proaches. Music Information Retrieval Evaluation eX-
change(MIREX).
A PSYCHOACOUSTICALLY MOTIVATED SOUND ONSET DETECTION ALGORITHM FOR POLYPHONIC
AUDIO
99
