
PRIORITIZATION OF SOFTWARE PROCESS IMPROVEMENTS
A COQUALMO-based Case Study and Derived Decision Support Scheme
Arne Beckhaus, Lars M. Karg
SAP Research Darmstadt, Germany
Christian A. Graf
∗
, Michael Grottke
∗‡
∗
imbus AG, Germany /
‡
University of Erlangen-Nuremberg, Germany
Dirk Neumann
University of Freiburg, Germany
dirk.neumann@is.uni-freiburg.de
Keywords:
Software process improvement, Decision support, Software quality assurance, COQUALMO.
Abstract:
Quality assurance has always been a major concern for software engineers. While a lot of work has been
devoted to technical quality assurance aspects, its economics have rarely been addressed. This is remarkable
in the light of the current endeavor of the software industry to learn from more mature industries and to
adapt their ‘lean’ and process improvement philosophies. We advance this debate by proposing a decision
support scheme. It facilitates the selection and prioritization of quality assurance activities for improvement
initiatives. The prioritizing order is based on the expected quality gains in terms of reduced number of defects
in the software product. Our scheme supports managers in their decision process, as shown in three industrial
case studies. It can be instantiated with low data-collection effort because it makes use of calibration data and
model characteristics of COQUALMO.
1 INTRODUCTION
For decades, users of software solutions have been
suffering from poor solution quality (Whittaker and
Voas, 2002). Estimates for the United States show an-
nual economic damages of billions of dollars (NIST,
2002). Recently, software vendors have attempted to
tackle this challenge by adapting the concepts of more
mature industries, such as manufacturing (Antony and
Fergusson, 2004). This trend can also be seen in qual-
ity assurance (QA) departments.
Software defects are typically traced by means of
different QA techniques. When attempting to im-
prove the QA process, management is often con-
fronted with the decision which technique to im-
prove first in order to achieve the highest possi-
ble quality gains. Software Process Improvement
(SPI) (Basili and Caldiera, 1995; El Emam et al.,
1998) promises to support quality managers in their
decision-making. It is a software-industry-specific
concept, defined as “changes implemented to a soft-
ware process that bring about improvements” (Ol-
son et al., 1989). However, a light-weight, context-
specific, and easy-to-apply SPI scheme has not yet
been proposed. We fill this research gap by develop-
ing an SPI decision support scheme. It provides qual-
ity managers with a toolkit to prioritize improvement
activities based on expected defect reduction.
Thereby, our approach relies on COQUALMO
(Chulani and Boehm, 1999). While COQUALMO’s
objective is defect prediction, our approach attempts
to prioritize process improvements. We start with the
same process assessment case study as COQUALMO,
but we focus on the defect removal part and neglect
defect introduction. Our optimization approach re-
uses calibration data elicited from industry experts
as provided in COQUALMO (Chulani and Boehm,
1999). It also adapts to COQUALMO’s definition of
the defect removal model in order to determine the
effect of the calibration constants on residual defects.
Since it relies on many pre-calculated values, the ap-
proach can be applied in a highly efficient way.
The remainder of this paper is structured as fol-
lows. Related work on SPI and COQUALMO is in-
139
Beckhaus A., M. Karg L., A. Graf C., Grottke M. and Neumann D. (2009).
PRIORITIZATION OF SOFTWARE PROCESS IMPROVEMENTS - A COQUALMO-based Case Study and Derived Decision Support Scheme.
In Proceedings of the 4th International Conference on Software and Data Technologies, pages 139-144
DOI: 10.5220/0002243801390144
Copyright
c
SciTePress

troduced in Section 2. Section 3 presents our findings
in form of the proposed optimization approach. The
applicability of this approach is demonstrated in three
industrial case studies in Section 4. Our findings are
summarized in Section 5, where we also give an out-
look on future research directions.
2 RELATED WORK
2.1 Software Process Improvement
Optimizing the processes of a company is one of the
core responsibilities of its management. In business
administration, various frameworks for business pro-
cess improvements have been developed. Deming
(Deming, 2000) with his Shewart cycle and Wom-
ack/Jones (Womack and Jones, 2003) with their Lean
Thinking approach are two prominent examples. Be-
sides targeting process improvement in general, these
two frameworks have a special focus on quality.
In the software industry, Software Process Im-
provement (SPI) has been developed as an industry-
specific concept (Basili and Caldiera, 1995; El Emam
et al., 1998). It addresses the peculiarities of software
engineering and is applicable to various kinds of soft-
ware projects as commercial-of-the-shelf or in-house
and custom software development.
A central part of SPI and other process improve-
ment concepts is measurement (DeMarco, 1982; Fen-
ton and Pfleeger, 1996; van Solingen and Berghout,
1999; Rifkin, 2001; Jones, 2008). Statistical process
control is necessary for both transparency of the sta-
tus quo and controlling the success of improvements
quantitatively.
Research on SPI often deals with change man-
agement practices and influence factors of SPI suc-
cess (e.g. (Stelzer and Mellis, 1998; Dyba, 2005)).
We therefore address an open research question by
proposing a light-weight decision support scheme for
the prioritization of quality assurance techniques ac-
cording to how much they are expected to benefit
from process improvement.
2.2 COQUALMO
The Constructive Quality Model (COQUALMO)
(Chulani, 1999; Chulani et al., 2003) is a quality
model aiming at the prediction of residual defects
in software development projects. It is an extension
of the project effort estimation model COCOMO II
(Boehm et al., 2000) which has successfully been im-
plemented in various industrial settings.
The basic idea behind COQUALMO is to pic-
ture software artifacts as reservoirs (tanks) connected
by pipes, similar to a water supply system. De-
fects are introduced and removed by additional pipes
representing processes that may introduce or remove
defects from the system—see Jones’ tank and pipe
model (Jones, 1975) and Boehm’s defect introduction
and removal model (Boehm, 1981).
COQUALMO models the introduction and the re-
moval of defects by two separate sub-models. The
defect introduction (DI) sub-model covers the intro-
duction of new (non-trivial) defects into the software
code. It uses a subset of the cost drivers from CO-
COMO II (Boehm et al., 2000) to derive a set of 21
parameters of defect introduction. These parameters
are multiplied with the size of the software artifact.
The output of the DI model is the predicted number
of requirements, design, and coding defects.
The defect removal (DR) sub-model covers the
identification and elimination of defects in later
phases of the software project. Both sub-models must
be applied in order to predict the number of residual
defects after test. Since the sub-models are separate,
it is possible to instantiate one without the other. We
make use of this model characteristic, because in the
context of our selection approach we are only inter-
ested in defect removal. In the following, we will
therefore merely discuss the DR sub-model in more
detail.
The defect removal sub-model relies on a mul-
tiplicative and influence factor based modeling ap-
proach. Residual defects are modeled separately for
each software artifact type. Like the DI sub-model,
the DR sub-model classifies defects according to the
process steps in which they were created as require-
ments, design, and coding defects. This classifica-
tion is named ‘artifact type’ in COQUALMO, and it
may easily be extended. The DR sub-model consid-
ers three different defect removal techniques, which
are called ‘profiles’ in COQUALMO:
• ‘Automated Analysis’ is a technique that statically
checks the source code of a piece of software.
• ‘Peer Reviews’ are code inspections performed by
people—hence the term ‘people reviews’ in (Chu-
lani, 1999).
• ‘Execution Testing and Tools’ can be seen as dy-
namic testing of the software product, potentially
by means of dedicated testing tools.
All these techniques can help detect defects from
all artifact types, although the defect may have been
introduced in a much earlier phase. In COQUALMO,
the number of residual defects of artifact type j is es-
timated as
ICSOFT 2009 - 4th International Conference on Software and Data Technologies
140
DRes
Est
j
= C
j
· DI
Est
j
·
3
∏
i=1
(1 −DRF
i j
)
with
j artifact type (requirements, design, or
coding), j ∈ {1,2,3};
DI
Est
j
number of defects of artifact type j,
estimated based on the DI sub-model;
C
j
baseline (calibration factor) calculated
from historical data;
i defect finding and removal techniques
(automated analysis, peer reviews,
and execution testing and tools),
i ∈ {1,2,3};
DRF
i j
defect removal factor modeling the
impact of the i-th technique on the j-th
artifact.
For each defect removal technique, six maturity levels
ranging from ‘very low’ over ‘low’, ‘nominal’, ‘high’,
and ‘very high’ to ‘extra high’ are defined based on
typical process characteristics. For each combination
of artifact type j and profile i as well as each maturity
level, (Chulani, 1999) reports a value of DRF
i j
deter-
mined by experts in a two-step Delphi study.
3 PROPOSED DECISION
SUPPORT SCHEME
3.1 Differentiation from COQUALMO
The optimization approach suggested in this paper is
directly derived from COQUALMO’s defect removal
sub-model. Our selection approach does not rely on
COQUALMO’s defect introduction sub-model. In-
stead, it is based on the weighting of influence factors
by experts in form of the aforementioned two-step
Delphi study. Besides the general characteristics of
the multiplicative model for defect removal, this data
set is the most important part of COQUALMO used
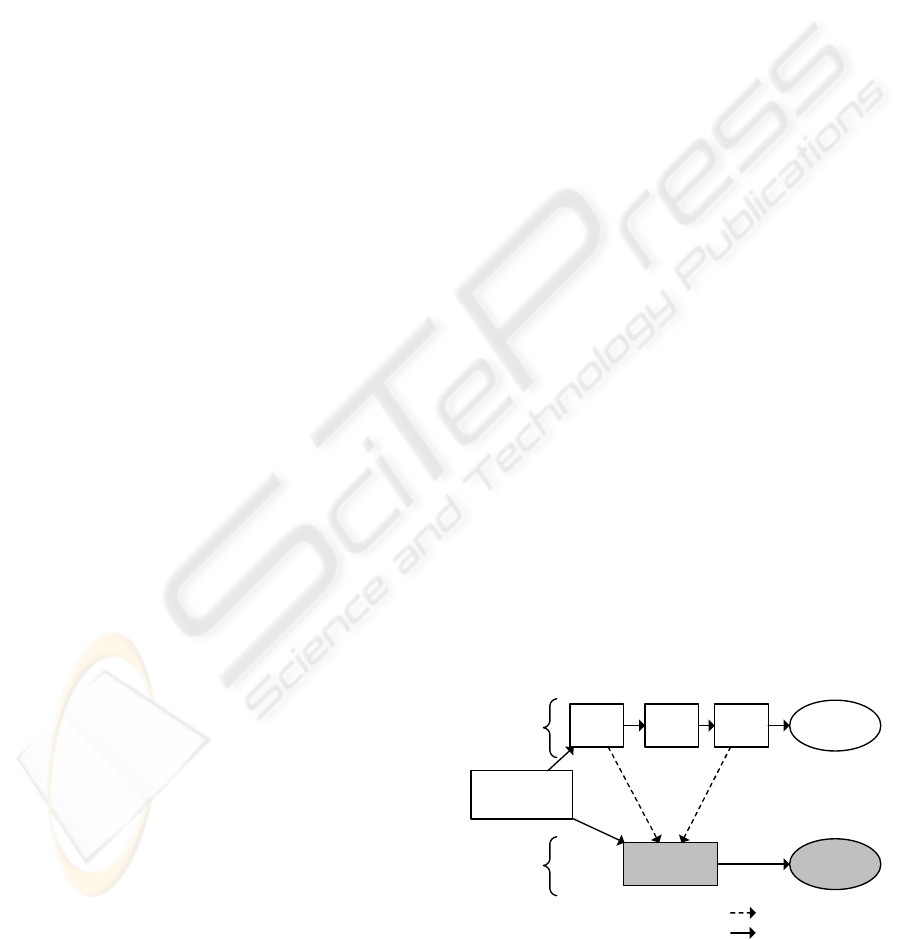
in this study. Figure 1 illustrates how COQUALMO
and our approach are linked.
In (Chulani and Boehm, 1999), the defect removal
factors are provided in table format. They are re-
flected in the model definition in form of the DRF
i j
factors. DRF
i j
can be interpreted as the fraction of de-
fects of artifact type j that can be removed by means
of defect removal technique i. (Note that in this study
COQUALMO’s concept of defect removal profiles is
referred to as defect removal techniques.) For exam-
ple, a DRF
i j
value of 0.1 means that 10% of the de-
fects of artifact type j can be removed via technique
i.
Due to the typical constraint in an industrial case
study that its findings must justify the data acquisi-
tion effort, usually only one artifact type j is taken
into account. In most cases this is coding, for obvious
reasons. Thus, DRF
i j
can be reduced to DRF
i
since
there is no further need to distinguish between artifact
types. However, this simplification of the model is not
necessary, and the selection approach as derived be-
low can easily be developed for multiple artifact types
as well.
Since DRF
i
(and DRF
i j
, respectively) are model
variables that are assigned values corresponding to
the maturity level m found when instantiating CO-
QUALMO, we additionally introduce the constants
DRC
i,m
where i is the defect removal technique and
m is its maturity level. The values of DRC
i,m
can di-
rectly be taken from (Chulani, 1999).
3.2 Definition
A qualitative pre-study revealed that quality managers
are very interested in prioritizing improvements of the
three techniques of automatic code analysis, peer re-
views, and execution testing and tools. Thus, our ap-
proach extends COQUALMO in a way that provides
quality management with the means to prioritize its
investments into process maturity. Since the software
industry is currently striving for a higher maturity of
its processes (Middleton and Sutton, 2005), managers
would like to know where to start in order to achieve
the biggest gains. In the field of quality management,
these gains can be quantified in terms of the reduction
in the number of defects. In other words: If a qual-
ity manager has to choose between process improve-
ments in the three techniques mentioned above, s/he
should pick the one that is expected to yield the high-
est reduction in defects remaining in the software.
In fact, the constants provided in COQUALMO
already contain all the information necessary for
COQUALMO
Our Approach
Delphi
Study
DI
Model
DR
Model
Defect
Prediction
Improv.
Prioritiz.
Optimization
Approach
Case Study
Process
Assessment
re-used in
flow of analysis
Figure 1: Association between COQUALMO and our ap-
proach.
PRIORITIZATION OF SOFTWARE PROCESS IMPROVEMENTS - A COQUALMO-based Case Study and Derived
Decision Support Scheme
141
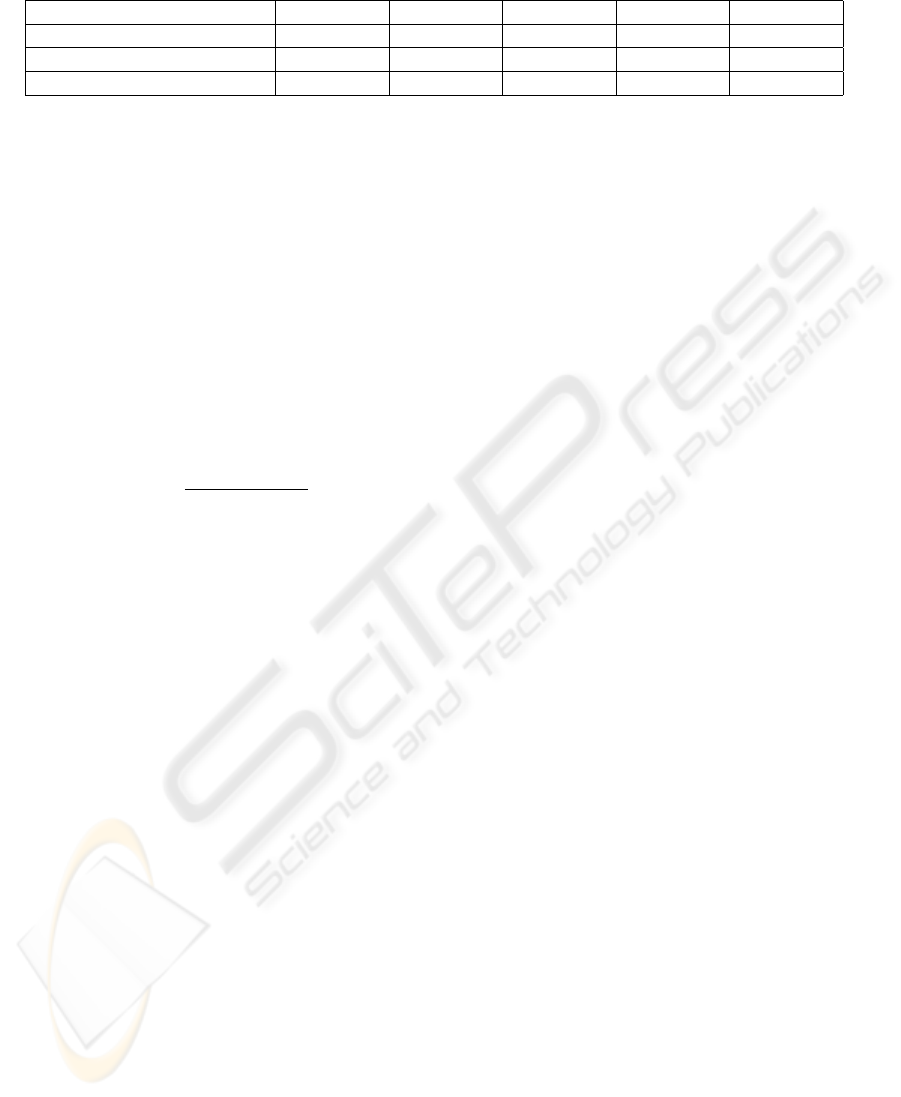
Table 1: Optimization Matrix.
Very Low Low Nominal High Very High
Automated Analysis 10% 11% 13% 25.7% 13%
Peer Review 30% 25.7% 23.1% 33% 37%
Execution Testing and Tools 38% 32% 26.2% 29% 45%
revealing the impact of moving a process to the
next maturity level. Let ∆
i,m
= DRes
Est(i,m)
−
DRes
Est(i,m+1)
be the estimated number of residual
defects remaining less in an artifact when the matu-
rity of defect removal technique i is upgraded from
level m to level m + 1. i ∈ {1,2,3} is one of the three
defect removal techniques, and m ∈ {1,...,5} repre-
sents one of the maturity levels except ‘extra high’,
which is excluded due to the impossibility of any fur-
ther improvement at this level.
Based on these concepts, we can derive opt
i,m
=
∆
i,m
/DRes
Est(i,m)
which is the estimated fraction by
which the number of residual defects is reduced when
upgrading the process from (i,m) to (i,m + 1). This
expression can be simplified to
opt
i,m
= 1 −
(1 − DRC
i,m+1
)
(1 − DRC
i,m
)
,
where DRC
i,m
denotes the constant defect reduction
factor for defect removal technique i on maturity level
m for the artifact type ‘coding’ as given in (Chulani,
1999). opt
i,m
is the optimization index for moving the
process for defect removal technique i from maturity
level m to m +1. As shown above, it represents the es-
timated fraction by which the total number of remain-
ing defects would be reduced when a specific process
is moved to the next maturity level. The optimiza-
tion index for the highest maturity level is undefined
since, by definition, at this level further improvement
is impossible.
Despite restricting our industrial case studies to
the artifact type ‘coding’, the above formula can eas-
ily be extended to support COQUALMO’s other two
artifact types as well. The only necessary modifica-
tion is the insertion of a third index j, denoting the
artifact type, to all variables.
Calculating the optimization index for all pairs
(i,m) yields an optimization matrix for process ma-
turity improvement. The optimization matrix shown
in Table 1 relies exclusively on the data provided by
Chulani in COQUALMO (Chulani, 1999). Therefore,
it can be calculated without any case-study-specific
data. It’s entries give the percentage by which the
number of residual defects in coding will be reduced
when raising the process maturity by one level for the
given defect removal technique.
Our selection approach will typically be instanti-
ated by a process assessment in order to derive the
current maturity levels of the three techniques. For
each technique i and its current maturity level m, the
value opt
i,m
is then looked up in the optimization ma-
trix provided in Table 1. An improvement of the tech-
nique with the highest value is expected to yield the
highest possible reduction of remaining defects and,
consequently, the best impact on quality according to
the COQUALMO model.
Note that we assume single steps of process im-
provement. This is due to our experience that it is
very difficult to implement process improvements,
and just as difficult not to fall back to the old prac-
tices over time. Our assumption is in line with the
recent debate of the establishment of lean thinking
and lean engineering principles in the software in-
dustry (Womack and Jones, 2003; Middleton and
Sutton, 2005). Recommeding jumps across multi-
ple levels, for example from ‘very low’ to ‘high’, in
one step would rather stem from the opposite school
of thought, namely business process re-engineering
(Hammer and Champy, 2003).
4 CASE STUDIES
In order to demonstrate the applicability and useful-
ness of our approach in practice, we conducted three
case studies. One of them was concerned with the
software development unit at a medium-sized enter-
prise. The quality assurance processes of the cho-
sen project were well established, but the project it-
self was rather small with a team of less than 20 de-
velopers. The other two industrial case studies were
conducted at a large European business software ven-
dor. Here, two different development projects were
chosen in an innovative line of business. The team
sizes were about 60 and 80 developers, respectively.
We consistently number these case studies by 1 to 3,
but due to confidentiality reasons we cannot provide
any information on which number belongs to which
development project.
Our research methodology is interview-based. For
each case study, we interviewed five project members.
Interviewees where chosen to cover a broad range
of roles within a project. For each case study, we
interviewed the quality manager responsible for the
project and covered in addition at least four of the fol-
ICSOFT 2009 - 4th International Conference on Software and Data Technologies
142
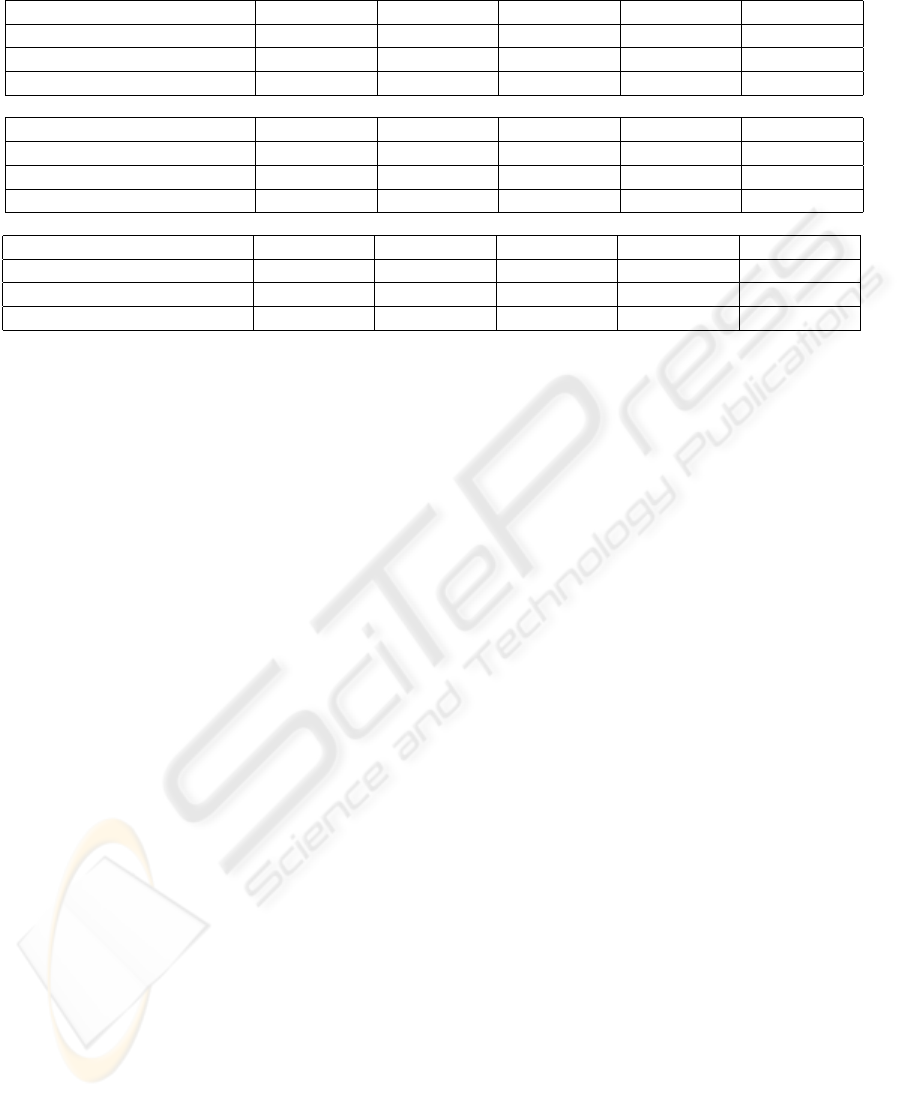
Table 2: Optimization Matrices for the Three Case Studies.
Case Study 1 Very Low Low Nominal High Very High
Automated Analysis 10% 11% 13% 25.7% → 3. 13%
Peer Review 30% 25.7% 23.1% 33% 37% → 2.
Execution Testing and Tools 38% 32% 26.2% 29% 45% → 1.
Case Study 2 Very Low Low Nominal High Very High
Automated Analysis 10% 11% → 3. 13% 25.7% 13%
Peer Review 30% 25.7% 23.1% → 2. 33% 37%
Execution Testing and Tools 38% 32% 26.2% 29% 45% → 1.
Case Study 3 Very Low Low Nominal High Very High
Automated Analysis 10% 11% 13% 25.7% 13% → 3.
Peer Review 30% 25.7% 23.1% 33% 37% → 2.
Execution Testing and Tools 38% 32% 26.2% 29% 45% → 1.
lowing job roles: developer, architect, tester, quality
specialist, and project lead.
The interview was based on a questionnaire de-
rived from the defect profile descriptions in (Chulani
and Boehm, 1999). Our experience with two pre-
studies conducted at projects 1 and 2 showed that
purely questionnaire-based research yields noisy data
in the form of a high variation in the process maturity
estimates. This is due to difficulties on the part of the
interviewees to rank their processes in an industry-
wide context. We therefore asked open questions re-
garding the processes to come up with a first restricted
set of possible maturity levels. In a next step, we pro-
vided our interview participants with examples tai-
lored to their context in order to achieve a common
understanding of the maturity levels. This methodol-
ogy appeared to be a critical success factor in low-
effort process maturity assessments, since our default
explanations of the different maturity levels where of-
ten only understood after providing context-specific
details and examples.
An alternative data acquisition method would
have been a CMMI appraisal. However, its effort
is very high compared to our approach and would
not have been justifiable in our setup. Nevertheless,
CMMI has gained popularity, and it is recommended
to check for existing appraisals prior to conducting
new interviews. Since it provides valuable input for
other business decisions, a new appraisal might also
be worth the effort when combining our approach
with others.
Participants of our case study praised our efficient
data acquisition methodology and voluntarily asked
us to repeat this assessment every six months for
benchmarking and controlling purposes. However,
a low-effort questionnaire-based process assessment
methodology may introduce a bias into the data ac-
quisition. We encourage considerate evaluation of the
data quality needs of a usage scenario prior to con-
ducting a survey.
According to the selection scheme discussed in
Section 3, we highlight the maturity levels of the de-
fect removal techniques in our optimization matrices
in Table 2. The improvement rank of the test activi-
ties is given to the right of the arrows. For example,
in case study 1, it would be best to invest into an im-
provement of execution testing and tools. Raising the
process maturity level from very high to extra high
is expected to yield a reduction of residual defects by
45%. Second-best is the improvement of peer reviews
with an improvement factor of 37%. The improve-
ment of the automated analysis technique from high
to very high process maturity ranks third with an esti-
mated improvement of 25.7%.
After conducting our three case studies, we asked
the participating quality managers whether or not they
agree with the prioritization derived by our approach.
This cross-check was successful, and most managers
accepted the finding that test execution environments
are an attractive area for attaining high returns on in-
vestment in improvement initiatives.
5 CONCLUSIONS
In this paper, we presented a decision support ap-
proach to prioritize three different quality assurance
techniques for selection in improvement projects. It
is based on the multiplicative model definition of
COQUALMO, as well as its calibration data gath-
ered in the course of a two-step Delphi study (Chu-
lani and Boehm, 1999). Our approach facilitates the
current advancement of the software industry in the
form of managed, lean processes. Quality managers
PRIORITIZATION OF SOFTWARE PROCESS IMPROVEMENTS - A COQUALMO-based Case Study and Derived
Decision Support Scheme
143

are able to prioritize process improvements based on
their expected effect on quality in terms of residual
defects. The approach can be instantiated with low
effort due to the re-use of COQUALMO constants.
It is also context-specific due to relying on process
assessments. Our approach’s applicability has suc-
cessfully been demonstrated in three industrial case
studies with a medium-sized enterprise and a global
player in the software industry.
Future research is needed in order to also quan-
tify the investment needed to raise process maturity
levels. Once these data are available, quality man-
agers are able to economically trade off between the
expected quality enhancement yield of an improve-
ment initiative on the one hand and its costs on the
other hand. Additionally, our approach should be val-
idated by conducting repetitive case studies after pro-
cesses have been improved and lifted to higher ma-
turity levels. In this way, the assumptions concerning
defect reductions inherent in the Delphi-study calibra-
tion data of COQUALMO can be cross-checked and
possibly refined.
ACKNOWLEDGEMENTS
Parts of the work presented in this paper have been
funded by the German Federal Ministry of Education
and Research (grants 01ISF08A and 01ISF08B).
REFERENCES
Antony, J. and Fergusson, C. (2004). Six sigma in the soft-
ware industry: results from a pilot study. Managerial
Auditing Journal, 19:1025–1032.
Basili, V. and Caldiera, G. (1995). Improve software quality
by reusing knowledge and experience. Sloan Manage-
ment Review, 37(1):55–64.
Boehm, B., Abts, C., Brown, A., Chulani, S., Clark, B.,
Horowitz, E., Madachy, R., Riefer, D., and Steece, B.
(2000). Software Cost Estimation with COCOMO II.
Prentice Hall.
Boehm, B. W. (1981). Software Engineering Economics.
Prentice-Hall.
Chulani, S. (1999). COQUALMO (COnstructive QUAlity
MOdel) a software defect density prediction model.
In Kusters, Cowderoy, Heemstra, and van Veenendaal,
editors, Project Control for Software Quality. Shaker
Publishing.
Chulani, S. and Boehm, B. (1999). Modeling software de-
fect introduction and removal: COQUALMO (COn-
structive QUALity MOdel). Technical report, Techni-
cal Report USC-CSE-99-510, University of Southern
California, Center for Software Engineering.
Chulani, S., Steece, B. M., and Boehm, B. (2003). Case
Studies in Reliability and Maintenance, chapter Deter-
mining Software Quality Using COQUALMO, pages
293–311. Wiley.
DeMarco, T. (1982). Controlling Software Projects: Man-
agement, Measurement and Estimation. Yourdon
Press, New York.
Deming, W. E. (2000). Out of the Crisis. MIT Press.
Dyba, T. (2005). An empirical investigation of the
key factors for success in software process improve-
ment. IEEE Transactions on Software Engineering,
31(5):410–424.
El Emam, K., Drouin, J.-N., and Melo, W., editors (1998).
SPICE: The Theory and Practice of Software Pro-
cess Improvement and Capability Determination. CS
Press.
Fenton, N. and Pfleeger, S. (1996). Software Metrics: A
Rigorous and Practical Approach. Int’l Thomson
Computer Press, London.
Hammer, M. and Champy, J. (2003). Reengineering the
Corporation. A Manifesto for Business Revolution.
Collins Business.
Jones, C. (1975). Programming defect removal. In Pro-
ceedings, GUIDE 40.
Jones, C. (2008). Applied Software Measurement: Global
Analysis of Productivity and Quality. McGraw-Hill,
3rd edition.
Middleton, P. and Sutton, J. (2005). Lean Software Strate-
gies. Productivity Press.
NIST (2002). The economic impacts of inadequte infras-
tructure for software quality.
Olson, T. G., Humphrey, W. S., and Kitson, D. (1989). Con-
ducting SEI-assisted software process assessments.
Technical report, Carnegie Mellon University, Tech-
nical Report CMU/SEI-89-TR-7, Pittsburgh.
Rifkin, S. (2001). What makes measuring software so hard?
IEEE Software, 18(3):41–45.
Stelzer, D. and Mellis, W. (1998). Success factors of
organizational change in software process improve-
ment. Software Process Improvement and Practice,
4(4):227–250.
van Solingen, R. and Berghout, E. (1999). The
Goal/Question/Metric Method: A Practical Guide
for Quality Improvement of Software Development.
McGraw-Hill, London.
Whittaker, J. A. and Voas, J. M. (2002). 50 years of soft-
ware: Key principles for quality. IT Pro, Nov/Dec:28–
35.
Womack, J. P. and Jones, D. T. (2003). Lean Thinking. Free
Press, 2nd edition.
ICSOFT 2009 - 4th International Conference on Software and Data Technologies
144
