
THE DEVELOPMENT OF A BRAKE BASED TORQUE
VECTORING SYSTEM FOR A SPORT VEHICLE
PERFORMANCE IMPROVEMENT
Leonidas Kakalis, Federico Cheli and Edoardo Sabbioni
Mechanical Department of Politecnico di Milano
Via la Masa 1, 20158 Milano, Italy
Keywords: Vehicle dynamics, Passive differential, Semi-active differentials, Active differentials, Controlled brake
system, Performance.
Abstract: In every driving condition powertrain and vehicle dynamics deeply influence each other. The main role of
powertrain influence is played by the differential, which transmit the driving torque mainly with respect to
wheel kinematics. Semi-active controlled versions of this device have been recently conceived to improve
vehicle handling basing their function on the wheels kinematical conditions. On the other hand, active
differentials allow to generate the most appropriate yaw moment controlling both the amount of transferred
torque and its direction. The application presented in this the paper aims at enhancing the dynamic behavior
of a rear-driven sport vehicle by creating the required yaw moment through brakes actuation and throttle
control; the examined car is equipped with free differential, thus the proposed system does not require the
introduction of additional devices. Performance measures relate to both open-loop and closed-loop driving
demands, and include limit handling maneuvers.
1 INTRODUCTION
The conventional free differential is a mechanism
that lets the driven wheels to assume different
speeds while cornering with a uniform distribution
of the driving torque on the two wheels of the same
axle; this device shows its main limit when the
adherence conditions of the two wheels are different:
in this case a free differential is not able to transfer
torque to the wheel with a higher adherence with the
consequent result of a really poor traction of the
vehicle. There are many examples of controlled
differential systems in the literature (Pedrinelli,
Cheli 2007) (Resta, Teuschl, Pedrinelli, Zorzutti
2005), (Zorzutti, Pedrinelli, Cheli, 2007). The vast
majority employ a limited slip differential (LSD)
similar to the passive gerodisc type where a friction
clutch is employed effectively to provide a
connection between the two drive shafts. The
distinguishing feature of this type of LSD is that it
will always transfer torque to the slower wheel. Such
control systems thus have no control over the
direction of torque transfer and are only able to
modulate the applied magnitude.
The advent of the “overdriven” differential
(Hancock, Williams, Gordon, Best, 2005),
(Granzow, Gruhle, Spiess, Denzier, Baasch, Peter,
2007), (Leffler, 2007), however (Figure 1), makes it
possible to control both the magnitude and direction
of torque transfer. This allows the direction of the
resulting yaw moment to be controlled and has led to
the development of active yaw control systems
(Tomari, Mori, Shibahata, 2005) which utilize
controlled torque transfer. a powertrain equipped
with an active differential system achieves an higher
degree of flexibility: an active differential is
designed to control both the locking torque
(equivalent to the semi active one) and its direction;
in this way it is possible to create a yaw moment
regardless of the kinematical condition of the driven
wheels, by transferring torque also from the slower
one to the faster one. This flexibility produces a
better compromise between traction and vehicle
dynamics performance.
298
Kakalis L., Cheli F. and Sabbioni E. (2009).
THE DEVELOPMENT OF A BRAKE BASED TORQUE VECTORING SYSTEM FOR A SPORT VEHICLE PERFORMANCE IMPROVEMENT .
In Proceedings of the 6th International Conference on Informatics in Control, Automation and Robotics - Intelligent Control Systems and Optimization,
pages 298-304
DOI: 10.5220/0002247502980304
Copyright
c
SciTePress
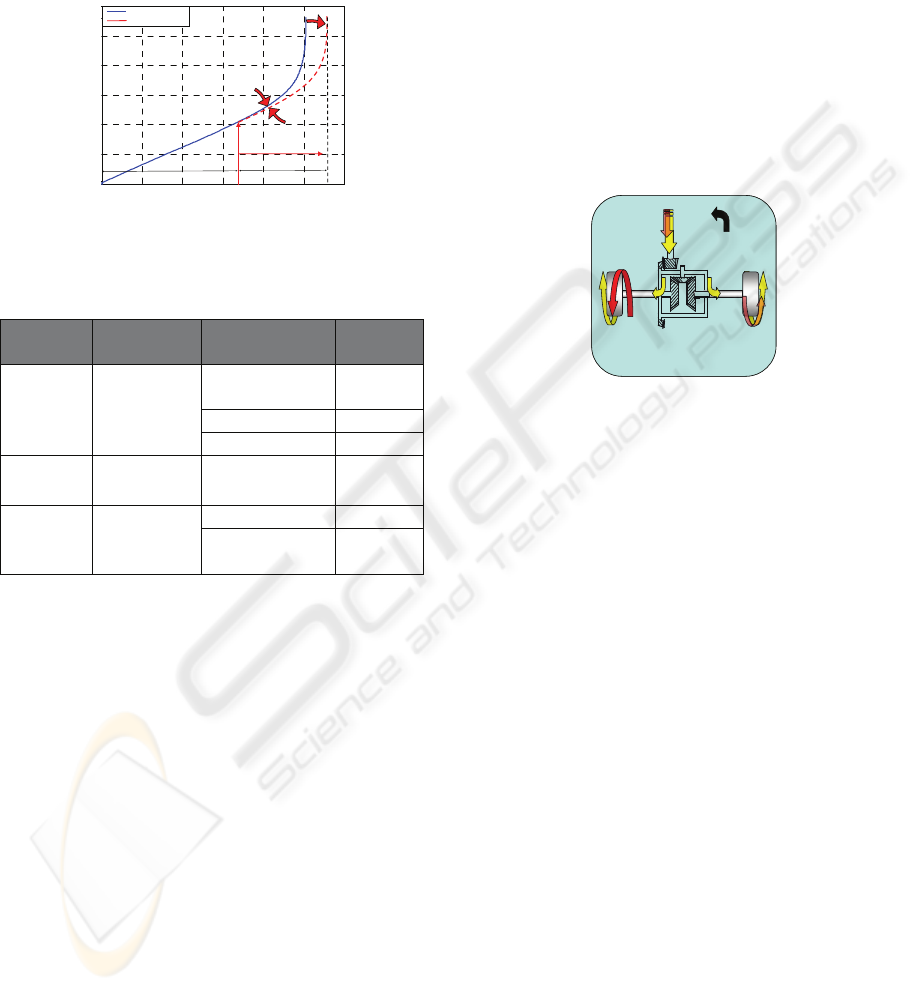
2 HANDLING TARGETS
The handling performance in steady state conditions
of a high speed vehicle equipped with a semi-active
differential is illustrated by the understeer curve
reported in Figure 1.
0 2 4 6 8 10 12
0
20
40
60
80
100
120
Ay [m/s
2
]
Steering Wheel Angle [deg]
Reference Model
Intervention Zone
0 2 4 6 8 10 12
0
20
40
60
80
100
120
Ay [m/s
2
]
Steering Wheel Angle [deg]
Reference Model
0 2 4 6 8 10 12
0
20
40
60
80
100
120
Ay [m/s
2
]
Steering Wheel Angle [deg]
Reference Model
Intervention Zone
A
B
Reference Model
Target
0 2 4 6 8 10 12
0
20
40
60
80
100
120
Ay [m/s
2
]
Steering Wheel Angle [deg]
Reference Model
Intervention Zone
0 2 4 6 8 10 12
0
20
40
60
80
100
120
Ay [m/s
2
]
Steering Wheel Angle [deg]
Reference Model
0 2 4 6 8 10 12
0
20
40
60
80
100
120
Ay [m/s
2
]
Steering Wheel Angle [deg]
Reference Model
Intervention Zone
A
B
0 2 4 6 8 10 12
0
20
40
60
80
100
120
Ay [m/s
2
]
Steering Wheel Angle [deg]
Reference Model
Intervention Zone
0 2 4 6 8 10 12
0
20
40
60
80
100
120
Ay [m/s
2
]
Steering Wheel Angle [deg]
Reference Model
0 2 4 6 8 10 12
0
20
40
60
80
100
120
Ay [m/s
2
]
Steering Wheel Angle [deg]
Reference Model
Intervention Zone
A
B
Reference Model
Target
Reference Model
Target
Figure 1: Reference understeer and target diagram.
Table 1: Selected test manoeuvres and performance
targets.
Dynamic
Conditions
Manoeuvre Performance
Index
Target
Steady
State
Ramp Steer
(ISO
4138:1996)
Understeer
gradient
Reduce
A
ymax
Increase
Sideslip gradient Increase
Power on Ad-hoc
A
ymax
,
A
xmax
Increase
Mixed
Virtual race
track
Time lap Reduce
Power
dissipation
Reduce
The handling diagram of Figure 1 can be divided
into two regions of interest: the linear region (A)
where the response of the tires is still in the linear
range and the non-linear region (B) where the tires
gradually reach the frictional force saturation.
The generation of a yaw moment by means of
active and semi-active differential or brake actuation
can affect the shape of the understeer diagram both
in region A and B; even if region B represents the
zone of interest for a sport vehicle, where the main
target is the highest lateral acceleration (red dotted
line in Figure 1) achievable associated with vehicle
stability. In Table 1 all the dynamic conditions
among with their correspondent dynamic targets are
summarized.
3 BRAKE TORQUE VECTORING
SYSTEM (BTV)
The concept of BTV is based upon the generation of
a yaw moment through independent brake actuation
on the driven wheels. With respect to systems like
Vehicle Dynamics Control (VDC), the main focus of
BTV is the global enhancement of the vehicle
performance; for this reason BTV acts also on the
throttle valve to avoid the speed reduction associated
with brake actuation. Even if the system is designed
to increase lateral acceleration and promptness
during transients, stability at limit is obviously
included among the targets.
OUT1
T
IN
T
OUT2
T
Brake
T
Turn
Direct ion
OUT1
T
IN
T
OUT2
T
Brake
T
Turn
Direct ion
Figure 2: BTV general scheme. T
IN
: input torque; T
OUT1
and T
OUT2
: resultant torque to each output shafts; T
Brake
:
braking torque.
Figure 2 represents a scheme of the BTV system
intervention: assuming a steady state condition
during a right turn of a rear driven car equipped with
a free differential, a brake torque on the internal axle
has been applied. As a consequence the external
wheel must receive a torque equal to the braking
torque applied on the internal one to keep the vehicle
speed. The additional torque applied to the external
wheel has been applied by accelerating the engine
thus compensating energy dissipation produced by
the brake actuation:
The asymmetric torque distribution on the rear
axle can clearly affect the traction force balance and
create a yaw moment mechanism. Compared to a
passive or semi-active differential, this mechanism
can be created independently from loading and
adherence on the ground, imitating the function of
an active differential. This implies that, during a
turn, the system has the ability not only to transfer
all the driving torque to the external wheel and
maintain the internal one in free rolling condition
but also to further amplify the yaw moment by
creating a negative traction force on the internal
wheel and increasing the driving torque on the
external one.
THE DEVELOPMENT OF A BRAKE BASED TORQUE VECTORING SYSTEM FOR A SPORT VEHICLE
PERFORMANCE IMPROVEMENT
299
4 CAR MODEL AND
SIMULATION ENVIRONMENT
A 15 degrees of freedom model (IPG CarMaker®)
of the examined sport car has been used to test and
compare the performance of various control
systems; the vehicle model has been integrated with
the models of actuators and of the control logic
implemented in Matlab/Simulink. The tires behavior
has been described using MF-Tyre model version
2002 (Pacejka, 2003), taking into account combined
slip effects. The model has been validated
comparing its outputs to experimental data relevant
to the passive vehicle equipped with a rear free
differential.
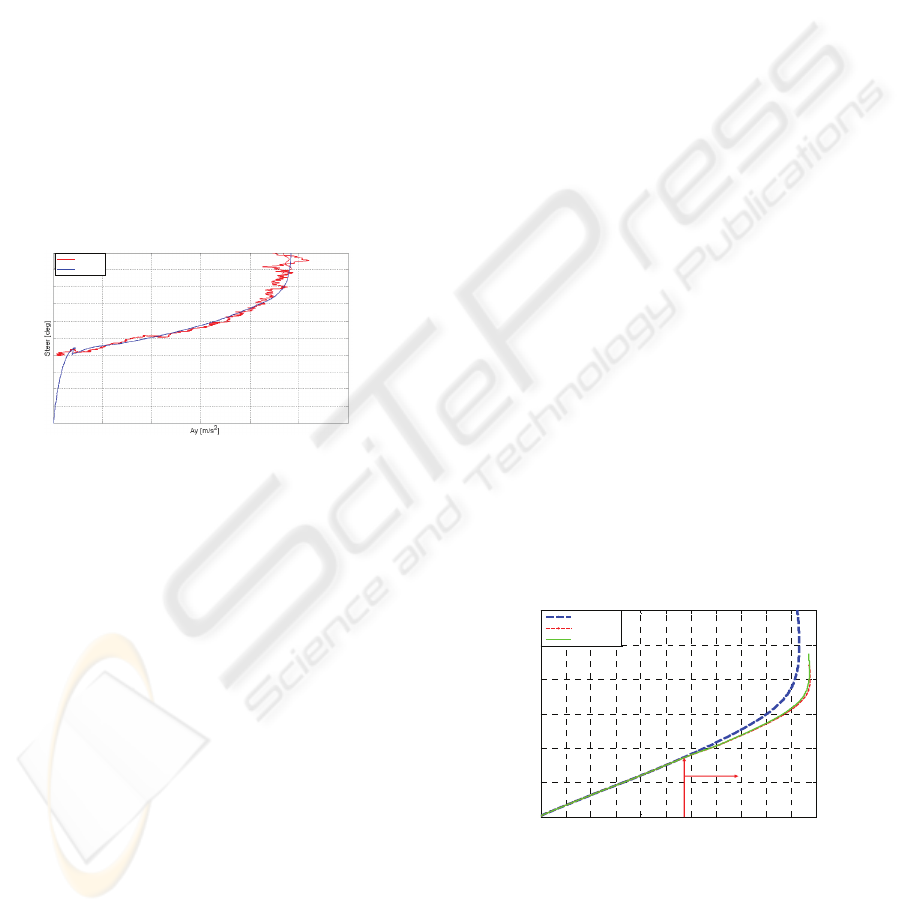
In Figure 3 the understeer curve (steer angle vs.
lateral acceleration) is shown for an ISO steering
pad maneuver (ISO 4138:1996). The scaling is not
reported in all figures in this paper because of
confidentiality agreements.
Experimental
CarMaker
Experimental
CarMaker
Experimental
CarMaker
Figure 3: Steering pad constant radius. Understeering
curve numerical vs. experimental.
Such a relative validation has allowed achieve a
better confidence in the presented numerical results.
Due to the significance of a proper clutch stiction
and slip phenomena modelling, the powertrain
model has been developed using a mathematical
approach appropriate for this kind of analysis (Cheli,
Pedrinelli, Zorzutti, 2007).
5 CONTROL LOGIC
ARCHITECTURE
In paragraph 3 the target of this project has been
pointed out as the maintenance of the stability at
limit and, above all, the vehicle performance
improvement in regard to the same car equipped
with a semi-active differential or an active
differential.
The control logic is not based on modern control
theory (LQR, etc.), but the simpler way of a feed-
forward to guaranty a quick response and PID
controllers to better adjust the overall algorithm
output is chosen.
First of all the algorithm foresees that the car
state has to be detected (Kakalis, 2009): the system,
then, applies dedicated sub-algorithms, one for
steady-state/step steer/power on and one for power
off (Kakalis, 2009) which results the desired brake
torque.
5.1 Steady State
As said in the previous sections, the resultant yaw
moment should not lead to an oversteering
condition. Therefore, the control system must work
only when it can guarantee a sensible gain in vehicle
performance. Because of that the feed-forward part
is constituted of a 3D map whose values correspond
to the maximum oversteering moment tolerable by
the car in various adherence levels. The applied yaw
moment should follow certain rules. At low speed
and lateral acceleration the gain in terms of
understeering gradient is narrow so that the driver
shouldn’t perceive a major handling improvement.
On the other hand, at high lateral acceleration the
gain in maximum lateral acceleration should be
hugely influenced by the logic intervention.
Based on the 3D map, BTV is capable of
generating a high asymmetry distribution (braking
inner wheel) of the rear longitudinal forces due to
the simultaneous action on brakes and throttle.
However, such an extreme torque vectoring can
generate an uncomfortable feeling (tank steering), so
that a standard lateral torque distribution (LTD) was
imposed on both the models (Figure 5) where, as
limit case, the internal wheel is kept in free rolling
condition.
Semi-Active
BTV
Active
Activation
Lateral Acceleration [m/sec
2
]
Steering Wheel Angle [deg]
Semi-Active
BTV
Active
Activation
Lateral Acceleration [m/sec
2
]
Steering Wheel Angle [deg]
Figure 4: Understeer curve.
Figure 4 presents an example of an understeer
curve for a fixed velocity of 100km/h, comparing the
response of the same car equipped with semi-active
differential, active differential and BTV. It can be
easily noted that beyond 6 m/s
2
(activation
ICINCO 2009 - 6th International Conference on Informatics in Control, Automation and Robotics
300
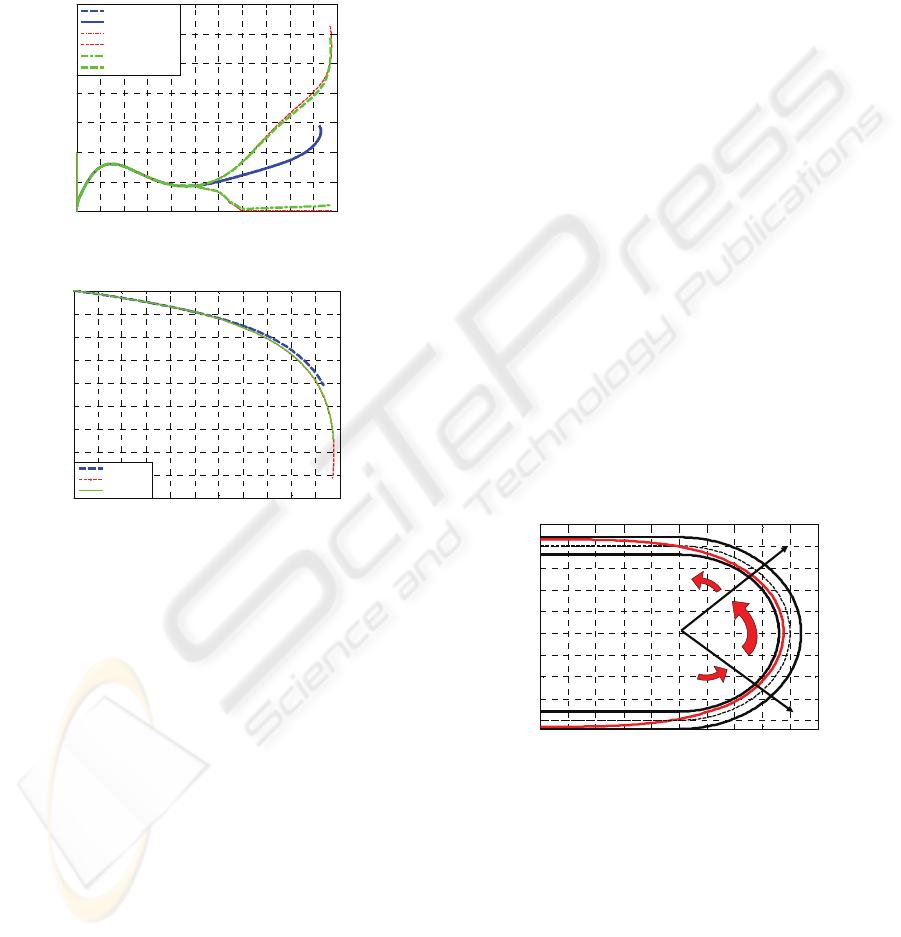
threshold) the understeer gradient is reduced for both
BTV and active differential; both the systems have
produced a better exploitation of the frictional forces
thus allowing to reach higher lateral acceleration
with respect to the semi-active differential (+5%).
The examination of Figure 6 suggests that this
improvement is obtained with an increase of the
sideslip angle.
0
0
0
0
0
0
0
0
Semi-A ctive Internal
Semi-Active External
BTV Internal
BTV External
Active Internal
Active External
Lateral Acceleration [m/sec
2
]
Torque [Nm]
Figure 5: Lateral torque distribution.
5
4
5
3
5
2
5
5
0
Semi-Active
BTV
Active
Lateral Acceleration [m/sec
2
]
Sideslip Angle [deg]
5
4
5
3
5
2
5
5
0
Semi-Active
BTV
Active
Lateral Acceleration [m/sec
2
]
Sideslip Angle [deg]
Figure 6: Sideslip angle.
5.2 U-turn (Power on)
The maintenance of the longitudinal acceleration
thresholds under medium and high lateral
acceleration imposes the need to combine two
fundamental arguments: stability in the limit area
and optimal traction.
As examined before the control logic of both
BTV and active differential in steady-state
cornering, generates a strongly asymmetric torque
distribution (0–100%). However, if a simultaneous
longitudinal acceleration is required by the driver,
the external tire can’t guarantee alone all the traction
force and the lateral one without saturating and
generating oversteer. Because of that, the transferred
torque to the external wheel must be limited by
changing the distribution ratio, i.e. the internal wheel
should be progressively accelerated. This action will
reduce the inwards moment whose amplitude is
directly governed by the longitudinal dynamic state
of the inner wheel. The acceleration of the inner
wheel causes the longitudinal slip boost and thus the
longitudinal force increase. It’s important to not
exceed the longitudinal slip peak (normally around
12% and 14%) to avoid the wheel spinning and a
huge engine rpm increase. In case of BTV the
progressive reduction of the torque distribution is
necessary and it is particularly complicated also
because an excessive braking action would dissipate
a lot of engine power that could be used to
accelerate the vehicle.
The optimization of the longitudinal slip is based
on a PID controller. The error signal is given by the
difference between the actual longitudinal slip and
the optimal one (12%-14%).
As far as BTV is concerned, the controller
directly commands the braking torque applied on the
inner wheel while in the active differential regulates
the outer clutch.
In order to compare the performance of the three
models under power on conditions, an ad-hoc
maneuver was designed (Figure 7), consisting of two
parts: in the first one the vehicle enters a curve and
progressively reaches steady-state conditions
(Steady State phase) achieving maximum
performance (maximum velocity and lateral
acceleration). In this part of the maneuver both BTV
and the active differential impose a 0-100% LTD
ratio. It has to be underlined that, in order to extract
meaningful conclusions, the driver model forces the
three vehicles to follow the same trajectory.
150 160 170 180 190 200 210 220 230 240 250
0
10
20
30
40
50
60
70
80
90
Steady
State Part
Power
On
Entrance
X [m]
Y [m]
150 160 170 180 190 200 210 220 230 240 250
0
10
20
30
40
50
60
70
80
90
Steady
State Part
Power
On
Entrance
X [m]
Y [m]
Figure 7: U-turn (Radius = 40m).
The second part (Power On phase) begins when
the driver accelerates (full throttle) and exits the
curve following the defined trajectory. During the
steady state phase BTV and active differential
clearly show their superiority in respect to the semi-
active model by describing the fixed trajectory with
a higher velocity (+2%).
As far as the transient phase (power on) is
concerned, BTV accelerates several meters before
the semi-active model and the active one. Any
THE DEVELOPMENT OF A BRAKE BASED TORQUE VECTORING SYSTEM FOR A SPORT VEHICLE
PERFORMANCE IMPROVEMENT
301
attempt, for both the vehicle equipped with semi-
active and active differential, to accelerate before
would cause an oversteering response and exit from
the track.
510 520 530 540 550 560 57
0
0
2
4
6
8
10
12
14
16
18
Distanc e
[
m
]
Longit udi nal Slip [%]
Semi-Active Internal
Semi-Active External
BTV Internal
BTV External
Active Internal
Active External
Figure 8: U-turn. Longitudinal slip on internal and
external wheel vs. distance.
5
10 520 530 540 550 560 570
0
0
0
0
0
Distance [m]
Semi-Active Internal
Semi-Active External
BTV Internal
BTV External
Active Internal
Active External
Torque
[Nm]
Figure 9: U-turn. Net torque on the real left and right
semi-axle vs. distance.
515 520 525 530 535 540 545 550 555 560 565 570
0
1
2
3
4
5
6
7
8
Distance [m]
Longitudinal Acceleration [m/s
2
]
Semi-Active
BTV
Active
Figure 10: U-turn. Longitudinal acceleration during the
exit phase vs. distance.
The need to follow the reference longitudinal slip
(Figure 8) would produce an excessive drive torque
transfer to the outer wheel (Figure 9) causing its
saturation. The BTV yaw moment generation
mechanism is instead more flexible since the torque
on the inner wheel can be controlled without the
need of transferring the same torque to the external
one. Such property makes it possible to initiate the
power on phase much earlier. Although both the
semi-active and the active differential lead the
vehicle to accelerate several meters after BTV, both
the systems allow a better exploitation of the
remaining longitudinal adhesion and achieve a
higher longitudinal acceleration (Figure 10).
Judging by the distance history of the
longitudinal velocity (Figure 11), BTV slightly
improves the performance of the active differential
and it presents a considerable advantage over the
semi-active.
5
10 520 530 540 550 560 570
5
0
5
0
5
0
5
0
5
Distance [m]
Semi-Active
BTV
Active
Longitudinal Speed [Km/h]
0
Figure 11: U-turn. Longitudinal speed vs. distance.
5.3 Virtual Race Track
As a last test, the performance offered by the three
control systems was tested comparing their
performance on an entire race track.
-800 -600 -400 -200 0 200 400 600 800
-300
-200
-100
0
100
200
300
400
X
[
m
]
Y [m]
1
2
-800 -600 -400 -200 0 200 400 600 800
-300
-200
-100
0
100
200
300
400
X
[
m
]
Y [m]
1
2
Figure 12: Selected race track.
The choice to validate the performance for all the
three systems on the virtual track of Figure 12,
showed the need to increase the robustness of their
logic in order to extract more meaningful results.
Such a test implies the fact that all models should
have a common state-recognizing switch governed
by the same principles and then the same power-off
strategy in order to eliminate great trajectory
ICINCO 2009 - 6th International Conference on Informatics in Control, Automation and Robotics
302
variations. The simulations were carried out in
CarMaker
TM
environment; the virtual driver of
IPG
TM
was chosen to perform the simulations with a
driving style very close to the one of a real driver.
Active differential and BTV have been actuated by
the same control logic previously presented for
steady-state curve and power on transient; this
implies that in steady-state the internal wheel does
not transmit any traction force to the ground. Once
power-on conditions is recognized, the optimization
of the internal’s wheel longitudinal slip will take
place.
730 735 740 745 750 755 760 765 770
73.5
74
74.5
75
75.5
76
Distance [m]
Longitudinal Speed [km/h]
Semi-Active
BTV
Active
Figure 13: Longitudinal speed vs. distance in turn 1.
Considering a total lap time of approximately
140 s, BTV and active differential allow a reduction
of 1.9% and 2.0% respectively when compared to
the performance produced by the vehicle equipped
with the semi-active differential. The time difference
between the three systems can be explained by
analyzing the dynamic performance in different
circuit sections. By observing at the first turn speed
profile (Figure 13) BTV and active differential
achieve a longitudinal velocity 2.5% higher with
respect to vehicle equipped with the semi-active
differential.
6 TEMPERATURE ANALYSIS
6.1 Brake Temperature Estimation
Increased power dissipation produced by repeated
brake actuations, might pose concerns around their
temperature and efficiency; it is therefore required to
estimate the expected temperature increase in the
brake system to complete the feasibility analysis of
the proposed concept. It has to be underlined that the
authors feel to provide only a short description of the
developed thermal model because its complexity and
the assumptions taken into consideration would
require a more detailed analysis which can be found
in (Sabbioni, Cheli, 2008) and (Limpert, 1999).
The thermal model takes into consideration the
heat transfer due to conduction between:
the rotor and the braking pad;
the braking pad and the caliper;
rotor and disc’s hub;
disc’s hub and wheel carrier;
and to forced convection between:
caliper, rotor and braking pad and the air;
disc’s hub and wheel carrier with the air;
The validation of the numerical model was
carried out by using ten consecutive laps test results
recorded on a race track using as a test vehicle the
reference model equipped with the semi-active
differential. The temperature was measured through
a temperature sensor positioned in the braking pad.
0 100 200 300 400 500 600 700 800 900 1000
50
100
150
200
250
300
350
400
450
500
Tim e[ s ec ]
T
empera
t
ure
[°C]
Estimated Temperature (Empirical Model)
Measured Temperature
Figure 14: Comparison between measured and estimated
braking pad temperatures.
0 200 400 600 800 1000 1200 1400 1600 1800 2000
0
50
100
150
200
250
300
350
400
450
Tim e[ sec ]
Temperature[
°C
]
Semi-Active RR
Semi-Active RL
BTV RL
BTV RR
Figure 15: Brake pad temperature estimation.
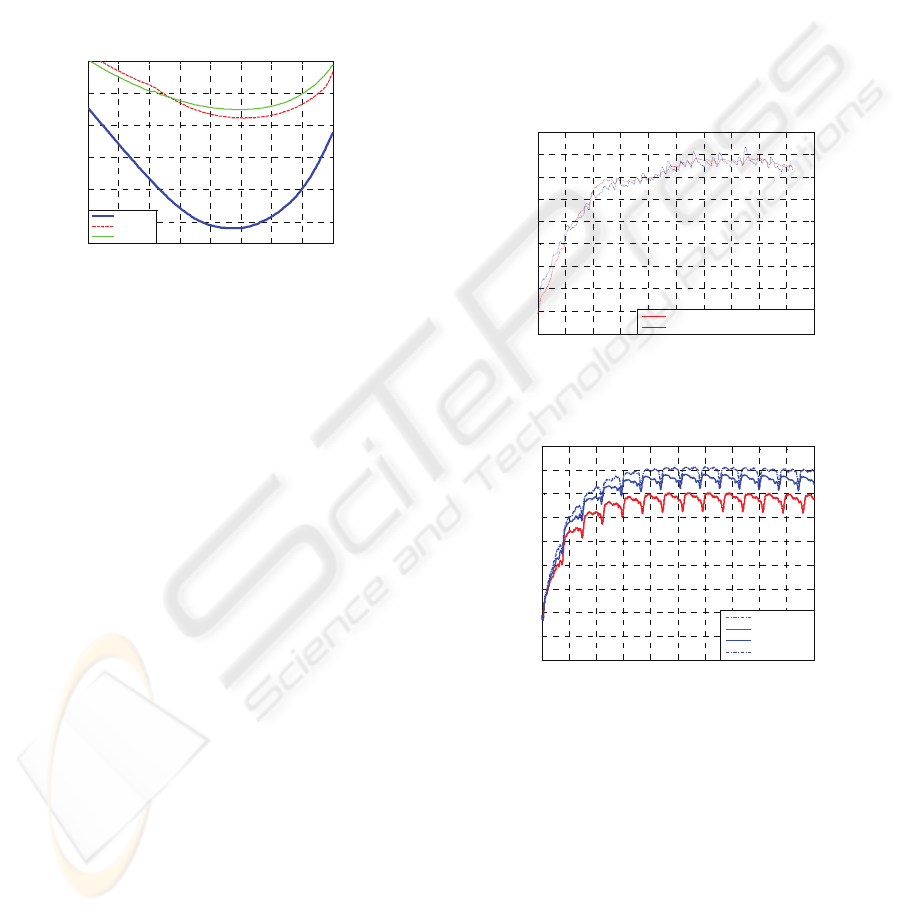
Figure 14 shows the comparison between the
temperature measured on the braking pad and the
one obtained by the numerical brake model.
The brake model was fed with the data obtained
through the simulation on the test track; this
procedure allowed to estimate the discs temperature
time history and thus evaluate the increased thermal
load associated with the BTV logic. Figure 15
collects the results obtained from the control
systems: the brake temperature gradually increases
with time and reaches a mean operating temperature
after about 5-6 laps. In terms of temperature, the
THE DEVELOPMENT OF A BRAKE BASED TORQUE VECTORING SYSTEM FOR A SPORT VEHICLE
PERFORMANCE IMPROVEMENT
303

dissipated power differences presented in Figure 15
correspond to a disc’s temperature rise of
approximately 50
o
C for the rear left brake and 75
o
C
for the rear right one. This temperature difference
between the two models may be considered limited
and tolerable since telemetry data on the real car
indicated operating temperatures above 400
ο
C
(Figure 15).
7 CONCLUSIONS
This paper presented the feasibility study of a
system designed for the improvement of the
handling characteristics of a sport vehicle based on
the yaw moment control. The proposed system,
named BTV, generates an asymmetric distribution of
the longitudinal forces on the driving axle through
an independent actuation of the brakes and a control
of the throttle valve. As far as handling performance
is concerned, BTV showed its superiority with
respect to the semi-active differential and allows to
get the same improvement provided by an active
differential under several operating conditions.
Besides this, BTV presents an important advantage
related to its implementation on a real vehicle which
would not require any additional electronic or
mechanical component. On the other side, active
differential still appears superior as far as the
mechanism of generation of the yaw moment is
concerned: BTV produces a torque difference by
dissipating the energy supplied to one of the wheels
in the form of heat, while the active differential
simply attempts to reapportion the torque that is
supplied to the wheels. The mechanism by which
this is achieved - the friction clutch - still leads to
some energy loss, but this is generally much lower
than the energy dissipated in the brakes. The low
energy consumption of the active differential gives it
the potential to apply yaw moment control
throughout the operating range of the vehicle.
The increased thermal solicitation of the brake
system was also examined through a thermal model
of brakes; according to the model results the
expected increase of the temperature of the discs
after a series of laps on a race track will not
compromise the brake efficiency.
Obviously remains still in discussion the
problem of the adherence level identification. This
difficult task can be handled through the definition
and the implementation of a self-governing
recognizing algorithm which, based on the
observation of the on board measured sizes, can
replace the manual control regulation made by the
driver which now is the implemented solution on the
reference vehicle. A major step towards the
adherence recognition can be considered the new
generation of Cyber Tires, (Pasterkamp, Pacejka,
1997), (Mancosu and others, 2008).
REFERENCES
Milliken, W.F., Milliken, D.L., 1995, SAE. Race Car
Vehicle Dynamics.
Pacejka, H.B, 2002. Tyre and vehicle dynamics. Oxford:
Butterworth-Heinemann.
Pedrinelli, M., Cheli, F., 2007. Vehicle Dynamics control
system actuating an active differential. SAE paper.
Pedrinelli, M., Zorzutti, A., Cheli, F., 2007. Development
of a control strategy for a semi-active differential for a
high performance vehicle. SAE paper.
Cheli, F., Pedrinelli, M., Zorzutti, A., 2007. Integrated
vehicle and driveline modelling. SAE paper.
Hancock, M.J., Williams, R.A., Gordon, T.J., Best, M.C.,
2005. A comparison of braking and differential
control of road vehicle yaw-sideslip dynamics. Proc.
of the Institution of Mechanical Engineers.
Zanten, v.A., Erhardt, R., Pfaff, G., 1995. VDC, The
Vehicle Dynamics Control System of Bosch. SAE
paper.
Granzow, C., Gruhle, W.D., Spiess, M., Denzier R.,
Baasch., D., Peter, R., 2007. Driving Precision by
Torque Vectoring–the new ZF axle drive. Proc. of the
European All-Wheel Drive Congress, Graz.
Leffler, H., 2007. xDrive and Vehicle Dynamics Control of
the new BMW X5. Proc. of the European All-Wheel
Drive Congress, Graz.
Shibahata, Y., Shimada, K., Tomari, T., 1993.
Improvement of vehicle maneuverability by Direct
Yaw Moment Control. Vehicle System Dynamics, 22.
Limpert R., 1999. Brake Design and Safety-2
nd
Edition.
SAE
Sabbioni E., Cheli F., 2008. A Numerical Model for
Predicting Thermal Loads in Passenger Car Brake
Disks. Proc. VSDIA, Budapest.
Kakalis, L., A brake based torque vectoring system for
sport vehicle improvement. PhD thesis.
Pasterkamp, W.R., Pacejka, H.B., 1997. The tire as a
sensor to estimate friction. Vehicle System Dynamics,
27, 409-422.
Mancosu, F. and others, 2008. Method and system for
determining a tyre load during the running of a
vehicle. Patent No.PT0283 WO P0.
ISO 4138:1996. Passenger cars – Steady state circular
driving behavior – Open loop test procedure.
ICINCO 2009 - 6th International Conference on Informatics in Control, Automation and Robotics
304
