
COMPARING PERFORMANCE RESULTS USING NEWFM
AND STATISTICAL METHOD
Sang-Hong Lee
1
, Dong-Kun Shin
2
and Joon S. Lim
3
1,3
Dept. of Computer Software, Kyungwon University, Korea
2
Division of Computer, Sahmyook University, Korea
Keywords: Fuzzy Neural Networks, Feature Selection, Principal Component Analysis, KOSPI.
Abstract: This paper proposes stock forecasting using a principal component analysis (PCA) and a non-overlap area
distribution measurement method based on a neural network with weighted fuzzy membership functions
(NEWFM). The non-overlap area distribution measurement method selects the minimum number of four
input features with the highest performance result from 12 initial input features by removing the worst input
features one by one. PCA is a vector space transform often used for reducing multidimensional data sets to
lower dimensions for analysis. The seven dimensional data sets with the highest performance result are
extracted by PCA. The highest performance results in a non-overlap area distribution measurement method
and PCA are 58.35% as the same results.
1 INTRODUCTION
To distinguish good input features and bad input
features from many input features is to select the
minimized input features with the best performance
results. Principal component analysis (PCA) is a
vector space transform often used for reducing
multidimensional data sets to lower dimensions for
analysis. PCA is arranged in descending order
according to the significance in contributing to the
overall data variations (Sanger, 1989). Therefore, the
first principal component explains most of the
variation in the given data. The second principal
component explains the cause of the next level of
variation, and so on. But the number of input
features does not change because PCA reduces
multidimensional data sets to low dimensions for
analysis.
This paper suggests a new feature selection
methodology for stock forecasting using the non-
overlap area distribution measurement method based
on a neural network with weighted fuzzy
membership functions (NEWFM) (Lim et al., 2005),
(Lim, 2009). The non-overlap area distribution
measurement method removes the worst input
features one by one and then selects the minimized
number of input features, each of which constructs
an interpretable fuzzy member-ship function. All
features are interpretably formed in weighted fuzzy
membership functions preserving the disjunctive
fuzzy information and characteristics. All features
are selected by the non-overlap area measurement
method validated by the wine benchmarking data in
University of California, Irvine (UCI) Machine
Learning repository (Lim and Gupta, 2004).
This paper compares the forecasting performance
of the feature extraction using PCA with the feature
selection using the non-overlap area measurement
method for the prediction of the higher or lower
changes of the daily Korea composite stock price index
(KOSPI). In this paper, four and seven input features
with the highest forecasting performance are used
for forecasting the higher or lower changes of the
daily KOSPI using the non-overlap area distribution
measurement method (Lim et al., 2005), (Lim, 2009)
and PCA, respectively.
This paper uses four minimum input features
selected by the non-overlap area distribution
measurement method and the seven dimensions
extracted by PCA with the highest performance
results as input features of NEWFM to forecast the
higher or lower changes of the daily KOSPI.
NEWFM shows that the highest performance results
using the non-overlap area distribution measurement
method and PCA are 58.35% as the same results.
353
Lee S., Shin D. and Lim J. (2009).
COMPARING PERFORMANCE RESULTS USING NEWFM AND STATISTICAL METHOD.
In Proceedings of the 4th International Conference on Software and Data Technologies, pages 353-356
DOI: 10.5220/0002252103530356
Copyright
c
SciTePress
Even though the highest performance results using
the non-overlap area distribution measurement
method and PCA are the same result, there are two
merits in the non-overlap area distribution
measurement method. The first merit is that it takes
the less time to make input features because the
number of input features can be reduced. The second
merit is that the non-overlap area distribution
measurement method can realize real-time stocks
system. In case in PCA, if new data comes, new
dimensional data that are reduced by PCA are
changed, therefore PCA can’t realize real-time
stocks system.
2 EXPERIMENTAL DATA
This paper uses 2928 trading days, from January
1989 to December 1998, which are the total number
of samples used by Kim, and also 12 technical
indicators selected by Kim (Kim, 2003), to forecast
changes in the daily Korean composite stock price index
(KOSPI). Kim divided the samples into two subsets,
training sets and holdout sets, which include 2347
and 581 trading days, respectively. This study aims
to forecast changes in the daily KOSPI. Increases and
decreases in the KOSPI are classified as “1” and “2,”
respectively; “1” means that the next day’s data are
lower than today’s data, and “2” means that the next
day’s data are higher than today’s data.
3 NEURAL NETWORK WITH
WEIGHTED FUZZY
MEMBERSHIP FUNCTION
(NEWFM)
A neural network with weighted fuzzy membership
function (NEWFM) is a supervised classification
neuro-fuzzy system using the bounded sum of
weighted fuzzy membership functions (BSWFMs)
(Lim et al., 2005), (Lim and Gupta, 2004). The
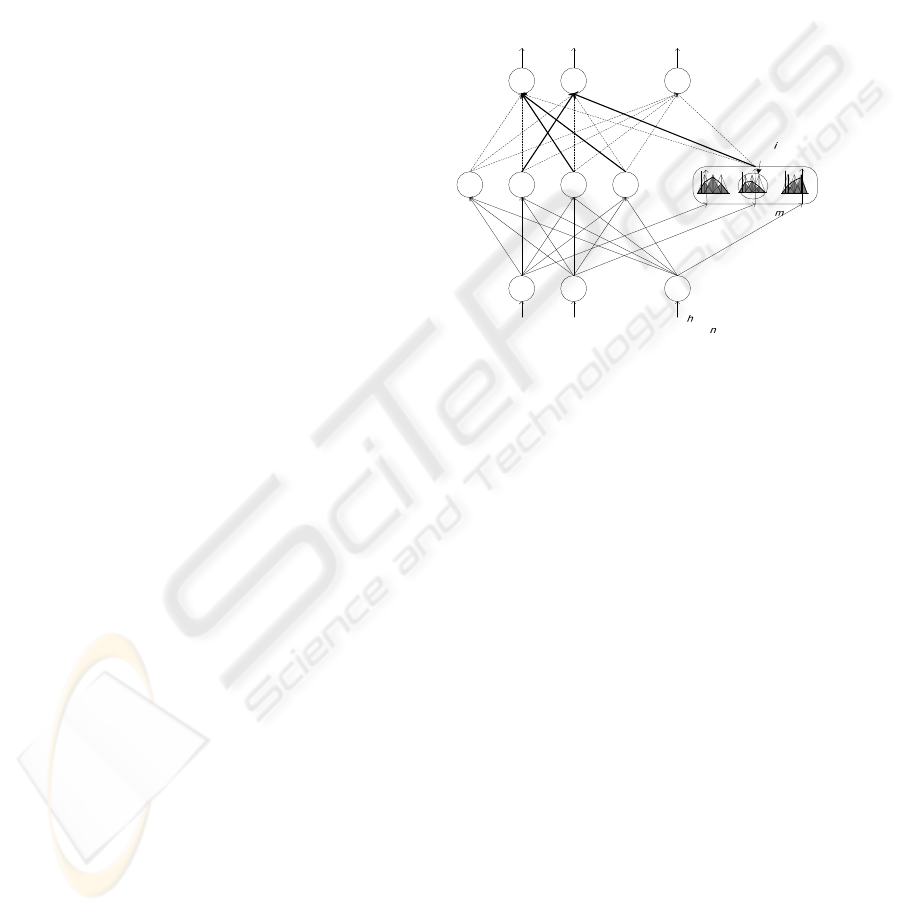
structure of the NEWFM, illustrated in Figure 1,
comprises three layers namely input, hyperbox, and
the class layer. The input layer contains n input
nodes for an n featured input pattern. The hyperbox
layer consists of m hyperbox nodes. Each hyperbox
node B
l
to be connected to a class node contains n
BSWFMs for n input nodes. The output layer is
composed of p class nodes. Each class node is
connected to one or more hyperbox nodes. An hth
input pattern can be recorded as I
h
={A
h
=(a
1
, a
2
, … ,
a
n
), class}, where class is the result of classification
and A
h
is n features of an input pattern.
The connection weight between a hyperbox node
B
l
and a class node C
i
is represented by w
li
, which is
initially set to 0. From the first input pattern I
h
, the
w
li
is set to 1 by the winner hyperbox node B
l
and
class i in I
h
. C
i
should have one or more than one
connection to hyperbox nodes, whereas B
l
is
restricted to have only one connection to a
corresponding class node. The B
l
can be learned only
when B
l
is a winner for an input I
h
with class i and
w
li
= 1.
...
:
i
m
B
m
B
1
C
2
C
p
C
1
B
2
B
3
B
4
B
1
I
2
I
n
I
,(
1
aA
h
=
),
n
a
"
"
"
"
"
Input Nodes
:
th Hyperbox Node
Class Nodes
1
2
=
m
w
0=
mp
w
th Input Pattern
with
Features
th fuzzy set
of
"
...
,
2
a
Hyperbox
Nodes
"
1
)(x
j
μ
x
1
)(x
j
μ
x
1
)(x
j
μ
x
m
B
Figure 1: Structure of NEWFM.
4 EXPERIMENTAL RESULTS
4.1 Feature Extraction based on the
Principal Component Analysis
(PCA)
Principal component analysis (PCA) is a vector
space transform used for reducing multidimensional
data sets to lower dimensions for analysis. PCA can
be regarded as a kind of orthogonalization that
transforms a vector of variables from the original n-
dimensional space to a new space spanned by n
orthogonal principal axes.
Let Y represent an (n x m) matrix consisting of n
number of observations of m number of variables.
With PCA the high dimensional space described by
matrix Y is modeled as:
Y = TP
T
+ E (1)
where T is the score matrix (composed by the PCs),
P is the loading matrix (composed by the
eigenvectors of the covariance matrix), and E is the
residual matrix (variance that was not captured by
the model).
ICSOFT 2009 - 4th International Conference on Software and Data Technologies
354
4.2 Feature Selection based on the
Non-overlap Area Distribution
Measurement Method
Selecting the number of fuzzy rules and identifying
the important input features have received attention
in recent literature (Ishibuchi and Nakashima, 1999).
In this paper, the minimum number of four input
features is selected by the non-overlap area
distribution measurement method (Lim and Gupta,
2004) (Lim, 2009) from 12 initial input features. The
method measures the degree of salience of the ith
feature by non-overlapped areas with the area
distribution by the following equation:
,)
1
1
()()(
||
2
i
L
i
U
AreaArea
i
L
i
U
e
AreaAreaif
−−
+
+=
(2)
where Area
U
and Area
L
are the higher and lower
phase superior areas, respectively.
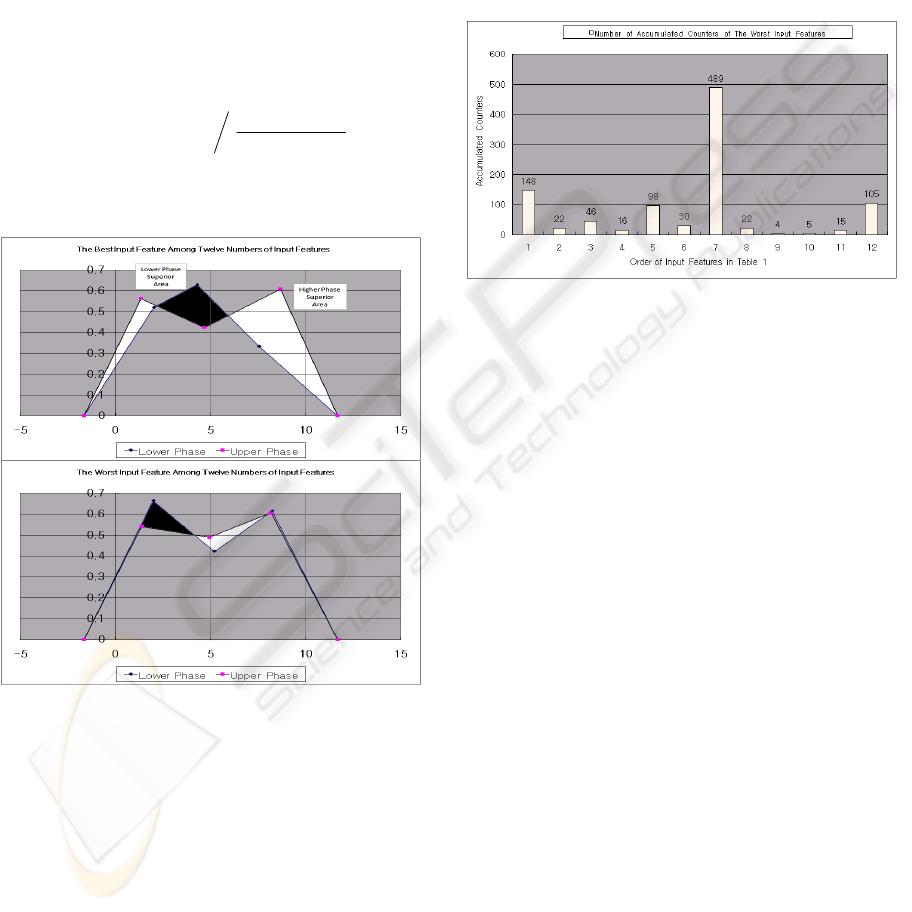
Figure 2: Area
U
(White) and Area
L
(Black) for the Best
and Worst Input Features Among 12 Input Features.
As an example, for the best and worst input features
among 12 initial input features, the Area
U
and Area
L
are shown in Figure 2. The larger the value of f(i),
the more the feature's characteristic is implied. The
worst of the 12 initial input features are removed one
by one by the non-overlap area distribution
measurement method, and then the minimum
number of four input features with the highest
performance results is selected for the holdout sets.
This experiment created two hypoboxes for
classification. A hyperbox that contains a set of lines
(BSWFM) in Figure 2 is a rule for class 1 (the lower
phase), and the other hyperbox that contains a set of
lines (BSWFM) is another rule for class 2 (the
higher phase). The graphs in Figure 2 are obtained
from the NEWFM program's training process, and
graphically show the difference between the lower
and higher phases for each input feature. The lower
phase means that the next day's data are lower than
today's data. The higher phase means that the next
day's data are higher than today's data.
Figure 3: Number of Accumulated Counters of the Worst
Input Features.
The model this paper describes repeatedly trains
the training sets and tests the holdout sets 1000 times
to find the worst input feature. The distributed non-
overlap area measurement method based on
NEWFM finds and counts the worst input feature
among the total number of input features using f(i) in
Eq. (2); and then the accumulated results of 1000
tests are shown in Figure 3, which shows that the
seventh input feature is the worst input feature
among the 12 input features, and then the seventh
input feature is removed from the 12 input features
in the next experiment.
4.3 Performance Results
The performance results for the holdout sets, which
were used in Kim (Kim, 2003) are presented to
evaluate the performance result of the proposed
NEWFM. Kim used support vector machines
(SVMs) for forecasting changes in the daily KOSPI
(Kim, 2003). In case of the distributed non-overlap
area measurement method, the performance results
of NEWFM shown in Table 1 are evaluated by four
minimum input features that are selected from
twelve initial input features, which are presented in
Kim (Kim, 2003). In case of PCA, the performance
result for the holdout sets are with seven dimensions.
In Table 1, NEWFM outperforms SVM by 0.52%
for the holdout data in the experiment that used the
COMPARING PERFORMANCE RESULTS USING NEWFM AND STATISTICAL METHOD
355

minimum number of four input features selected by
the non-overlap area distribution measurement
method (Lim and Gupta, 2004) and seven numbers
of dimensional data reduced by PCA. Stochastic %D,
Momentum, Disparity 5 days, and Disparity 10 days
that are used in Kim (Kim, 2003) are selected as the
minimum number of four input features with the
highest performance result; and are used to generate
the fuzzy rules for forecasting changes in the daily
KOSPI.
Even though the highest performance results using
the non-overlap area distribution measurement
method and PCA are the same result, there are two
merits in the non-overlap area distribution
measurement method. The first merit is that it takes
the less time to make input features because the
number of input features can be reduced. The second
merit is that the non-overlap area distribution
measurement method can realize real-time stocks
system. In case in PCA, if new data comes, new
dimensional data that are reduced by PCA are
changed, therefore PCA can’t realize real-time
stocks system.
Table 1: Comparisons of Performance Results for Kim
with NEWFM Using the Non-overlap Area Distribution
Measurement Method and PCA.
NEWFM
(Non-overlap area
distribution
measurement)
NEWFM
(PCA)
SVM
Performance
(%)
58.35 58.35 57.83
5 CONCLUSIONS
This paper proposes a new feature selection
methodology for financial forecasting using the non-
overlap area distribution measurement method based
on the neural network with weighted fuzzy
membership functions (NEWFM). This paper
compares the forecasting performance of the feature
extraction using PCA with the feature selection
using the non-overlap area measurement method.
NEWFM is a new model of neural networks to
improve forecasting performance results by using
self-adaptive weighted fuzzy membership functions.
The degree of classification intensity is obtained by
the bounded sum of weighted fuzzy membership
functions selected by NEWFM.
In this paper, the non-overlap area distribution
measurement method selects
the minimized
number
features by removing the worst input
features one by one. PCA is used for reducing twelve
numbers of initial input features to twelve numbers
of dimensions that consist of first principal
component to twelfth principal component. Four
minimum input features selected by the non-overlap
area distribution measurement method (Lim et al.,
2005) and seven numbers of dimensional data
reduced by PCA are presented to forecast the higher
or lower changes of the daily KOSPI. The
performance results of the non-overlap area
distribution measurement method and PCA are
58.35%.
Even though the highest performance results using
the non-overlap area distribution measurement
method and PCA are the same result, there are two
merits in the non-overlap area distribution
measurement method. The first merit is that it takes
the less time to make input features because the
number of input features can be reduced. The second
merit is that the non-overlap area distribution
measurement method can realize real-time stocks
system. In case in PCA, if new data comes, new
dimensional data that are reduced by PCA are
changed, therefore PCA can’t realize real-time
stocks system.
REFERENCES
T. D. Sanger, “Optimal Unsupervised Learning in a
Single-Layer Linear Feedforward Neural Network,”
Neural Networks, vol. 12, pp. 459-473, 1989.
Kyoung-jae Kim, “Financial time series forecasting using
support vector machines,” Neurocomputing 55, pp.
307-309, 2003
J. S. Lim, T-W Ryu, H-J Kim, and Sudhir Gupta, “Feature
Selection for Specific Antibody Deficiency Syndrome
by Neural Network with Weighted Fuzzy Membership
Functions,” FSKD 2005 (LNCS 3614), pp. 811-820,
Springer-Verlag, Aug. 2005.
H. Ishibuchi and T. Nakashima, “Voting in Fuzzy Rule-
Based Systems for Pattern Classification Problems,”
Fuzzy Sets and Systems, Vol.103, pp.223~238, 1999.
J. S. Lim and S. Gupta, “Feature Selection Using
Weighted Neuro-Fuzzy Membership Functions,” The
2004 International Conference on Artificial
Intelligence(IC-AI'04), June 21-24, 2004, Vol. 1, pp.
261-266, Las Vegas, Nevada, U.S.A.
Joon S. Lim, "Finding Features for Real-Time Premature
Ventricular Contraction Detection Using a Fuzzy
Neural Network System", IEEE Trans. on Neural
Networks, VOL. 20, No. 3, pp. 522-527, MARCH
2009.
ICSOFT 2009 - 4th International Conference on Software and Data Technologies
356
