
Typhoon Damage Forecasting with Self-Organizing Maps,
Multiple Regression and Decision Trees
Kazuhiro Kohara and Ryo Hasegawa
Department of Electrical, Electronics and Computer Engineering
Chiba Institute of Technology, 2-17-1, Tsudanuma, Narashino, Chiba, 275-0016, Japan
Abstract. Damage caused by typhoons to both people and structures has de-
creased in Japan due to improvements of countermeasures against natural disas-
ters, however, such damage still occurs. A typhoon warning that represents the
risk posed by a typhoon with high accuracy should be issued appropriately.
Thus, we propose a new typhoon warning system which forecasts the likely ex-
tent of damage associated with a typhoon towards humans and buildings. The
relation between typhoon data and damage data is investigated and typhoon
damage is forecast using typhoon data. Self-organizing maps (SOM), multiple
regression analysis and decision trees were used for typhoon damage forecast-
ing. We consider two types of forecasting: two-class (yes or no) and three-class
(small, medium or large scale) damage forecasting. Experimental results on ac-
curacy of two-class and three-class forecasting with SOM were 93.3% and
96.8%, respectively. The accuracy with SOM was much better than that with
multiple regression and decision trees. We recommend a new typhoon damage
forecasting method based on these results.
1 Introduction
Intelligent techniques such as back-propagation neural networks (BPNN) [1], self-
organizing maps (SOM) [2], decision trees [3] and Bayesian networks [4] have been
extensively investigated, and various attempts have been made to apply them to iden-
tification, prediction and control [e.g., 1-10]. Harada et al. applied BPNN to forecast-
ing typhoon course [8], Takada et al. applied BPNN to forecasting typhoon damage
of electric power systems [9] and Udagawa et al. applied Bayesian networks to rain
prediction [10]. This paper applies intelligent techniques to forecasting typhoon dam-
age to human and buildings.
Damage caused by typhoons to both people and structures has decreased in Japan
due to improvements of countermeasures against natural disasters, however, such
damage still occurs [11, 12]. A typhoon warning that represents typhoon menace with
high accuracy should be issued appropriately. A typical typhoon warning currently
issued may be “This typhoon is large and very strong”. We propose a new typhoon
warning which forecasts the risk of damage scale to both human and buildings. We
investigate relation between typhoon data and damage data and forecast typhoon
damage using typhoon data. The typhoon data includes the month when the typhoon
Kohara K. and Hasegawa R. (2009).
Typhoon Damage Forecasting with Self-Organizing Maps, Multiple Regression and Decision Trees.
In Proceedings of the 5th International Workshop on Artificial Neural Networks and Intelligent Information Processing, pages 106-111
DOI: 10.5220/0002254601060111
Copyright
c
SciTePress

was born, latitude and longitude where the typhoon was born, lowest atmospheric
pressure, maximum wind speed and total precipitation. Damage data includes human
damage data such as number of fatalities and injured persons and building damage
data such as number of completely destroyed houses and number of houses under
water.
We use SOM, multiple regression analysis and decision trees for typhoon damage
forecasting. SOM [2] are neural networks which consist of two layers: input layer and
map layer. As an interesting feature of SOM, teaching vectors are not required and
input vectors are automatically classified in accordance with similarity, updating the
weight of the winning neuron and the neighbor neurons. After trained by SOM algo-
rithm, the weight vectors of the neurons form the cluster of input vectors. A decision
tree [3] is an inductive learning algorithm. In a decision tree algorithm, an explicit
decision boundary is extracted from the training data, and an example E is classified
into class c if E falls into the decision area corresponding to c. Viscovery SOMine 4.0
was used as SOM software and See5 release 1.19 was used as decision tree software
with default parameter values.
2 Forecasting Damage Data using Typhoon Data
139 data records of typhoon data and damage data from June 1981 to September 1999
were collected from the typhoon database [13, 14]. The types of typhoon and damage
data are shown in Table 1. There are nine types of typhoon data and nine types of
damage data, divided into three types of human damage and six types of building
damage. We used 111 data records (to September 1995) for learning and 28 data
records (from July 1996) for testing.
Table 1. Types of typhoon data and damage data used in this study.
Typhoon data
Month when the typhoon was born,
Latitude and longitude where the typhoon was born,
Lowest atmospheric pressure,
Maximum wind speed,
Total, one-hour and twenty-four-hour precipitation,
Life span
Damage data
Number of fatalities,
Number of injured persons,
Number of dead and injured persons
Number of completely destroyed houses,
Number of half destroyed houses,
Number of partially destroyed houses,
Total number of damaged houses,
Number of houses under water,
Total number of destroyed non-house structures
The average and maximum of every damage type are shown in Table 2. The min-
imum of every damage type was zero.
107
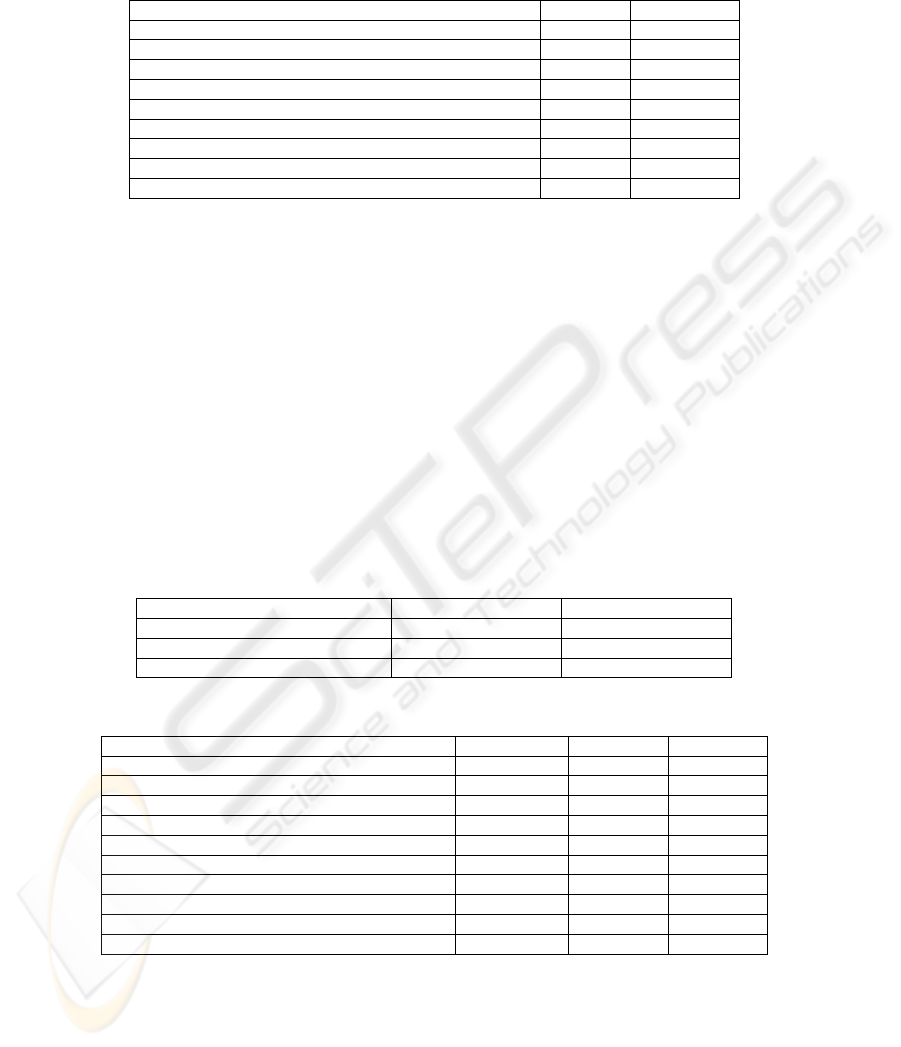
Table 2. Average and maximum of every type of damage data.
Data type Average Maximum
Number of fatalities 5.5 100
Number of injured persons 39.2 1499
Number of dead and injured persons 44.8 1561
Number of completely destroyed houses 21.9 541
Number of half destroyed houses 1839.8 169877
Number of partially destroyed houses 1051.7 85989
Total number of damaged houses 2913.4 170418
Number of houses under water 7829.6 174124
Total number of destroyed non-house structures 163.6 15840
In this study, we consider two types of typhoon damage forecasting: two-class
(yes or no) and three-class (small, medium or large scale) damage forecasting.
3 Two-class (Yes or No) Damage Forecasting
In two-class damage forecasting, a predictor is trained by two values (0 and 1). In this
case, 0 means that the damage is zero (no) and 1 means that the damage is not zero
(yes). Experiments were made with nine types of continuous typhoon data as inputs
and one damage data (two values) as an output. Here, we expect that typhoon data
such as lowest atmospheric pressure, maximum wind speed and precipitation can be
forecast with high accuracy by a weather forecasting system such as Japanese
SYNFOS [15] and hence actual typhoon data was used as inputs.
Table 3. Average accuracy of two-class (yes or no) damage forecasting.
Method Learning data Test data
Self-organizing maps (SOM) 100% 93.3%
Multiple regression (MR) 70.9% 70.2%
Decision trees (DT) 77.7% 63.9%
Table 4. Accuracy of two-class (yes or no) damage forecasting for test data.
Damage type SOM MR DT
No. fatalities 92.9% 57.1% 50.0%
No. injured persons 89.3% 75.0% 75.0%
No. dead and injured persons 96.4% 89.3% 85.7%
No. completely destroyed houses 92.9% 57.1% 57.1%
No. half destroyed houses 89.3% 71.4% 71.4%
No. partially destroyed houses 92.9% 67.9% 60.7%
Total no. of damaged houses 96.4% 75.0% 64.3%
No. houses under water 96.4% 85.7% 78.6%
Total no. destroyed non-house structures 92.9% 53.6% 32.1%
Average 93.3% 70.2% 63.9%
SOM: self-organizing maps, MR: multiple regression, DT: decision trees
The average accuracy of two-class (yes or no) damage forecasting for the three in-
telligent methods is shown in Table 3. Here, average accuracy means the average of
108

the accuracy of nine damage data. The average accuracy of the learning and test data
using SOM was 100% and 93.3%, respectively. This experiment confirmed that dam-
age data are well related with typhoon data and that SOM learned the nonlinear rela-
tion very well. The accuracy for each damage test data is shown in Table 4. Each
damage data was forecast very well by SOM. The accuracy with SOM was much
better than that with multiple regression and decision trees.
4 Three-class (Small, Medium or Large Scale) Damage
Forecasting
In three-class damage forecasting, two experiments were made with nine types of
continuous typhoon data as inputs and one damage data as an output. In the first ex-
periment, a predictor is trained by continuous damage data. As this is a regression
problem, decision trees were not used. The average of each damage data was calcu-
lated as shown in Table 2. Small scale corresponds to under half of the average, me-
dium scale corresponds to between half of the average and the average, and large
scale corresponds to over the average, respectively. The prediction was considered
accurate when both the predicted value and the actual value correspond to the same
size. The average accuracy of three-class damage forecasting when trained by conti-
nuous damage data is shown in Table 5. The average accuracy of the learning and test
data with SOM was 100% and 78.6%, respectively. The accuracy for each damage
type is shown in Table 6. The accuracy with SOM was much better than that with
multiple regression, however, each damage data was not always forecast very well by
SOM. For example, accuracy for number of fatalities and number of partially de-
stroyed houses was 67.9% and 92.9%, respectively.
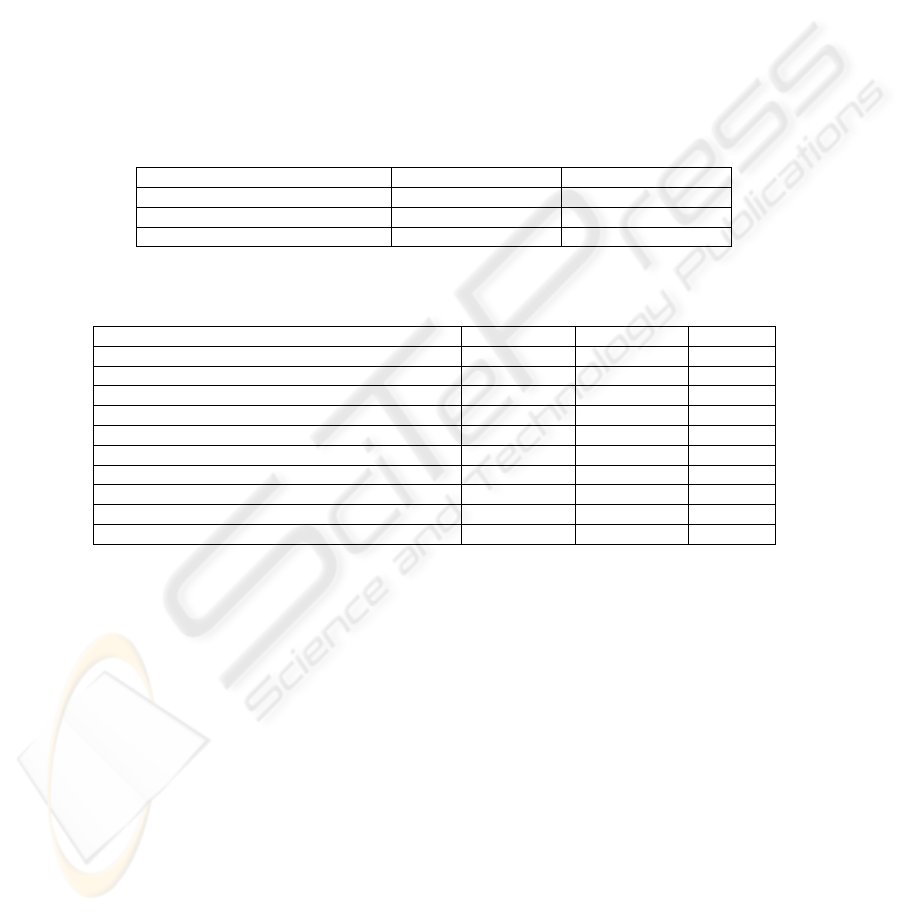
Table 5. Average accuracy of three-class (small, medium or large scale) damage forecasting
when trained by continuous damage data.
Method Learning data Test data
Self-organizing maps (SOM) 100% 78.6%
Multiple regression (MR) 52.8% 43.7%
Table 6. Accuracy of three-class (small, medium or large scale) damage forecasting for test
data when trained by continuous damage data.
Damage type SOM MR
No. fatalities 67.9% 35.7%
No. injured persons 75.0% 46.4%
No. dead and injured persons 75.0% 42.9%
No. completely destroyed houses 60.7% 46.4%
No. half destroyed houses 89.3% 42.9%
No. partially destroyed houses 92.9% 42.9%
Total no. of damaged houses 89.3% 39.3%
No. houses under water 82.1% 39.3%
Total no. destroyed non-house structures 75.0% 57.1%
Average 78.6% 43.7%
109
In the second experiment, a predictor is trained by three values (0, 1 and 2). As
this is a classification problem, decision trees were used. In the learning data, 0 means
that the damage is small scale, 1 means the damage is medium scale and 2 means the
damage is large scale. The prediction was considered accurate when the predicted
size was equal to the actual size. The average accuracy of three-class damage fore-
casting when trained by three values is shown in Table 7. The average accuracy of the
learning and test data with SOM was 100% and 96.8%, respectively. This also con-
firmed that damage data are also well related with typhoon data. The accuracy for
each damage type is shown in Table 8. Each damage type was also forecast very well
by SOM. For example, accuracy for number of fatalities and number of partially
destroyed houses was 85.7% and 100%, respectively. The accuracy with SOM was
also much better than that with multiple regression and decision trees.
Table 7. Average accuracy of three-class (small, medium or large scale) damage forecasting
when trained by three values.
Method Learning data Test data
Self-organizing maps (SOM) 100% 96.8%
Multiple regression (MR) 77.5% 65.1%
Decision trees (DT) 90.1% 78.6%
Table 8. Accuracy of three-class (small, medium or large scale) damage forecasting for test
data when trained by three values.
Damage type SOM MR DT
No. fatalities 85.7% 42.9% 78.6%
No. injured persons 100% 53.6% 71.4%
No. dead and injured persons 100% 53.6% 71.4%
No. completely destroyed houses 92.9% 39.3% 53.6%
No. half destroyed houses 100% 85.7% 96.4%
No. partially destroyed houses 100% 85.7% 85.7%
Total no. of damaged houses 100% 85.7% 92.9%
No. houses under water 92.9% 50.0% 60.7%
Total no. destroyed non-house structures 100% 89.3% 96.4%
Average 96.8% 65.1% 78.6%
5 Conclusions
We investigated typhoon damage forecasting with intelligent techniques. Using nine
types of typhoon data as inputs to SOM, experimental results on the average accuracy
of two-class (yes or no) and three-class (small, medium or large scale) damage fore-
casting were 93.3% and 96.8%, respectively. The accuracy with SOM was much
better than that with multiple regression and decision trees. As a result, a typhoon
forecasting method is proposed as follows: 1) Evaluate two-class damage forecasting,
2) When two-class forecasting result is yes, evaluate three-class damage forecasting,
3) Issue a typhoon warning based on above three-class damage forecasting. For ex-
ample, such a warning may be issued, “According to the Japanese typhoon database,
we forecast that the coming typhoon has a risk of causing both large scale human and
building damage. Please take care.” In further research, we will consider more de-
110

tailed damage forecasting and use other predictors such as support vector machines.
References
1. Rumelhart, D., Hinton, G., Williams, R.: Learning internal representations by error propa-
gation. In: Rumelhart, D., McClelland, J., the PDP Research Group (eds.): Parallel Distri-
buted Processing, Vol. 1. MIT Press, Cambridge, MA (1986).
2. Kohonen, T.: Self-Organizing Maps. Springer (1995).
3. Quinlan, J.: C4.5: Programs for Machine Learning. Morgan Kaufmann (1993).
4. Jensen, F.: Bayesian Networks and Decision Graphs. Springer (2001).
5. Pham, D., Liu, X.: Neural Networks for Identification, Prediction and Control. Springer
(1995).
6. Kohara, K.: Neural networks for economic forecasting problems. In: Leondes, C. T.: Expert
Systems - The Technology of Knowledge Management and Decision Making for 21st Cen-
tury -. Academic Press (2002).
7. Kohara, K.: Combining selective-presentation and selective-learning-rate approaches for
neural network forecasting of stock markets, Proceedings of International Workshop on Ar-
tificial Neural Networks and Intelligent Information Processing. Madeira (2008) Pp 3-9.
8. Harada, H., Momma, E., Ishii, H., Ono, T.: Forecast of typhoon course using multi-layered
neural network (III), Proceedings of National Convention of the Institute of Electrical En-
gineers of Japan, Toyama (2007) Vol. 3, 111.
9. Takata, H., Kawaji, S., Ha, T.: Study on a Prediction Method of Typhoon Damage of Elec-
tric Power Systems in each District on the Main Island in Kagoshima Prefecture, Technical
Report 48, Faculty of Engineering, Kagoshima University (2006).
10. Udagawa, S., Nishio, S., Kimura, M.: Rain prediction by the Bayesian network, Proceed-
ings of National Convention of the Information Processing Society of Japan (2005) Vol.3,
237-238.
11. Murayama, K.: Introduction to Typhoon Study. Yama-Kei Publishers (2006).
12. Nyoumura, Y.: Weather Damage Prediction and Countermeasure. Ohmsha (2002).
13. National Research Institute for Earth Science and Disaster Prevention (2008).
http://www.bosai.go.jp/index.html
14. National Institute of Informatics (2008). http://agora.ex.nii.ac.jp/digital-typhoon
15. Japan Weather Association (2008). http://www.jwa.or.jp/synfos/
111
