
A Blind Source Separation Algorithm for the Processing
and Classification of Electro-oculogram Data
Fernando Rojas
1
, Rodolfo V. García
2
, Olga Valenzuela
3
Luís Velázquez
4
and Belén San Román
5
1
Department of Computer Architecture and Technology, University of Granada, Spain
2
Network Department, University of Holguín, Cuba
3
Department of Applied Mathematics, University of Granada, Spain
4
Centre for the Research and Rehabilitation of Hereditary Ataxias, Holguín, Cuba
5
University of Granada, Spain
Abstract. Abnormalities in the oculomotor system are well known clinical
symptoms in patients of several neurodegenerative diseases, including
modifications in latency, peak velocity, and deviation in saccadic movements,
causing changes in the waveform of the patient response. The changes in the
morphology waveform suggest a higher degree of statistic independence in sick
patients when compared to healthy individuals regarding the patient response to
the visual saccadic stimulus modeled by means of digital generated saccade
waveforms. The electro-oculogram records of six patients diagnosed with ataxia
SCA2 (a neurodegenerative hereditary disease) and six healthy subjects used as
control were processed to extract saccades. We propose the application of a
blind source separation algorithm (or independent component analysis
algorithm) in order to find significant differences in the obtained estimations
between healthy and sick subjects. These results point out the validity of
independent component analysis based techniques as an adequate tool in order
to evaluate saccadic waveform changes in patients of ataxia SCA-2.
1 Introduction
The ocular movement records have been widely used in processing and classification
of biological signals and pathological conditions: clinical sleep scoring [10, 11],
cerebellar dysfunctions [12-14], diagnosis of the visual system [15, 16], amongst
others, also in human computer interface and visual guided devices [17-19]. The
Spino Cerebellar Ataxia type 2 (SCA-2) is an autosomal dominant cerebellar
hereditary ataxia with the highest prevalence in Cuba, reporting up to 43 cases per
100,000 inhabitants in the province of Holguin. In most families there is clinical and
neuropathological evidence of additional involvement of brainstem, basal ganglia,
spinal cord, and the peripheral nervous system [1]. This form of ataxia occurs
commonly in persons of Spanish ancestry in north-eastern Cuba, a figure much higher
than that found in western Cuba or in other parts of the world. The high prevalence is
Rojas F., García R., Valenzuela O., Velázquez L. and San Román B. (2009).
A Blind Source Separation Algorithm for the Processing and Classification of Electro-oculogram Data.
In Proceedings of the 5th International Workshop on Artificial Neural Networks and Intelligent Information Processing, pages 50-56
DOI: 10.5220/0002263200500056
Copyright
c
SciTePress
probably the result of a founder effect, but might be due to an interaction between a
mutant gene and an unidentified environmental neurotoxin [2, 4].
Several studies have reported oculomotor abnormalities in SCA2 [1, 4-8].
Specifically, slowness of saccades has been suggested as a relatively characteristic
finding in SCA2[4, 8]. This fact determines significant differences in saccade
morphology between healthy individuals and patients with SCA-2, mainly for 60º of
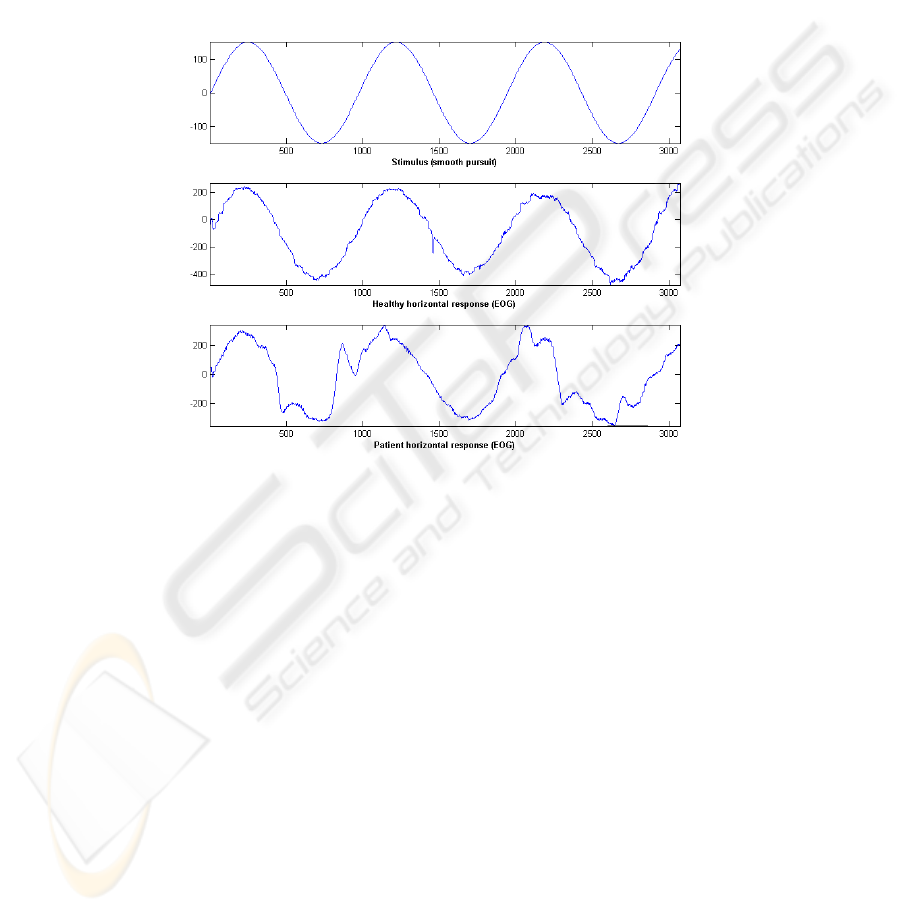
stimulus amplitude. The electro-oculographical records are quite different in healthy
individuals and patients with a severe ataxia as it is shown in Figure 1 for a smooth
pursuit experiment.
Fig. 1. Electro-oculographic response to a smooth pursuit stimulus (top) obtained for a healthy
subject (center) and a patient of SCA-2 ataxia (bottom).
2 Using Blind Source Separation for Ataxia SCA2 Diagnosis
2.1 Hypothesis for the Proposed Method
Independent component analysis is aimed to find a linear transformation given by a
matrix W, so that the random variables y
i
, (i=1,…,n) of y=[y
1
,…,y
n
] are as
independent as possible in:
() ()yWxtt
=
⋅
(1)
This linear blind source separation approach is suitable for the signals obtained by
the EOG, as well as in other medical analysis such as electroencephalography (EEG),
electrocardiography (ECG), magneto-encephalography (MEG), and functional
magnetic resonance imaging (fMRI) [20-26].
51

As it was shown in Section 1, in the analysis of EOG oriented to the detection of
SCA2 experts anticipate two possible behaviors of the individuals: sick and healthy
conduct. During an experiment over a healthy subject, the horizontal movement of the
eye is expected to follow the stimulus signal. Therefore, the horizontal eye movement
and the stimulus will hold a direct dependence between them, i.e. the signals are not
independent. In contrast, a sick individual may present a more chaotic response,
depending on the severity of the disease. Consequently, the subject response will not
depend in such a high degree on the stimulus signal, and the signals are independent
(or at least, “not so dependent”).
Therefore, the proposed methodology uses independent component analysis as a
classification algorithm criterion: if the independence measure (normally mutual
information) reveals independence between the individual response and the stimulus
signal, then it is rather possible that the individual presents some degree of ataxia or
related disease.
2.2 Description of the Blind Source Separation Algorithm
The proposed algorithm for ataxia SCA-2 diagnosis will go along the following steps:
1. Set both horizontal response and stimulus signal in the same phase, i.e. correct the
delay between the stimulus change and the saccade.
2. Normalize signals (x).
3. Apply ICA algorithm. Any well known ICA algorithm may be applied at this point
(FastICA [27], Jade [28], GaBSS [29-30], etc.).
4. Normalize estimations (y)
5. Calculate error measure between estimations (y) and mixtures (x) according to the
root mean square error expression:
[]
2
0
() ()
(,)
N
t
ii
xt yt
RMSE
N
=
−
=
∑
xy
(2)
6. Depending on the obtained error measure, a simple categorization algorithm (such
as C-means) may be applied in order to classify individuals. Otherwise, a human
expert may help in subject categorization based on the ICA results.
3 Results
The electro-oculogram recordings of six patients with severe ataxia and six healthy
subjects diagnosed and classified in the “Centre for the Research and Rehabilitation
of Hereditary Ataxias (CIRAH)” were used in order to perform the analysis of
repeated ocular saccadic movement tests for 10º, 20º, 30º and 60º divergence stimuli.
52
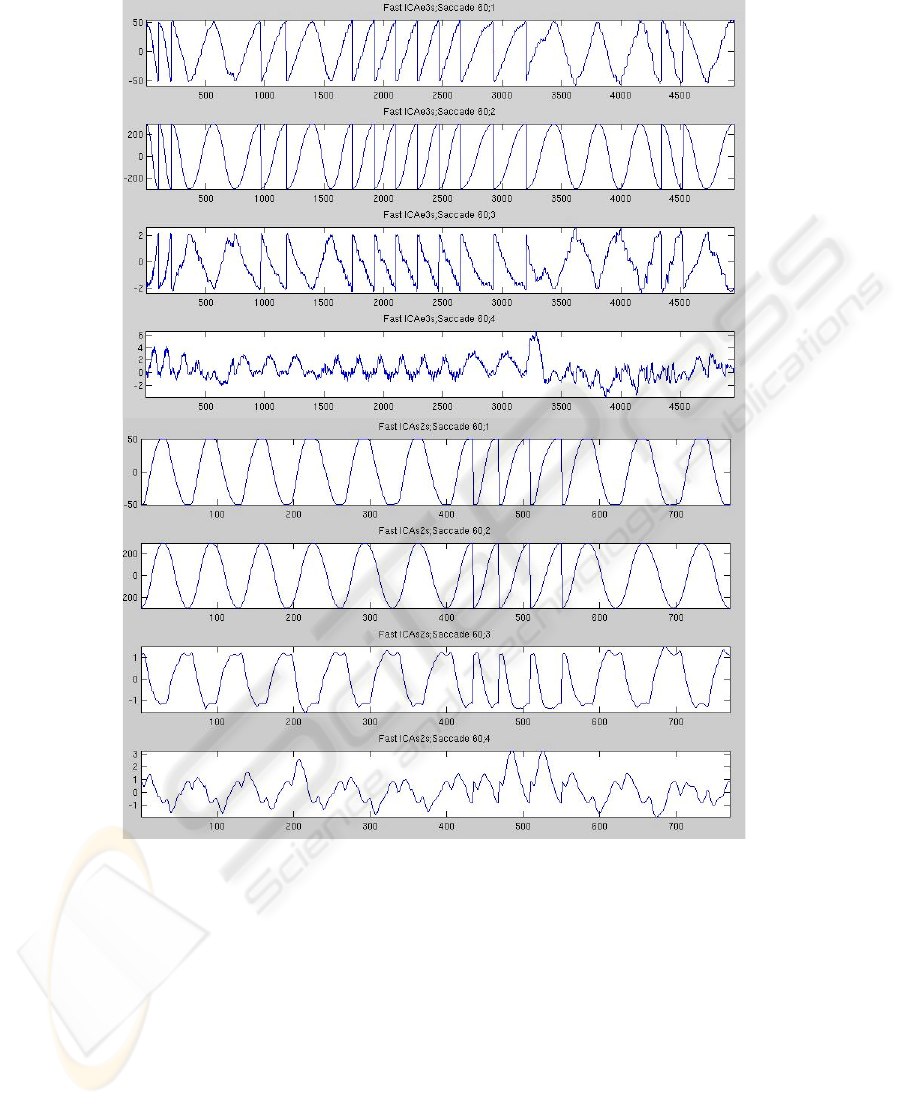
Fig. 2. Stimulus (1), response (2) and ICA components (3 and 4) obtained at 60º of stimulation
for patients (top) and control subjects (bottom).
All the records were carried out by the medical staff of CIRAH. Each individual
was placed in a chair, with a head fixation device to avoid head movements, the
variables were collected by a two channel electronystagmograph (Otoscreen, Jaeger-
Toennies). Recording conditions were set as follows: electrodes of silver chloride
placed in the external borders of right eye (active electrode) and left eye (reference
electrode), high pass filtering 0.002 Hz, low pass filtering 20 Hz, sensitivity 200
µV/division, and sampling frequency 200 Hz. For stimulus generation a black screen
CRT display showing a white circular target with an angular size of 0.7º was used.
53
The stimulus and patient response data are automatically stored in ASCII files by
Otoscreen electronystagmograph.
The patient response was filtered using a median filter, to obtain a clean waveform
of the patient response, afterwards it was phased with the stimulus. Finally FastICA
was applied to get the independent components (See Figure 2).
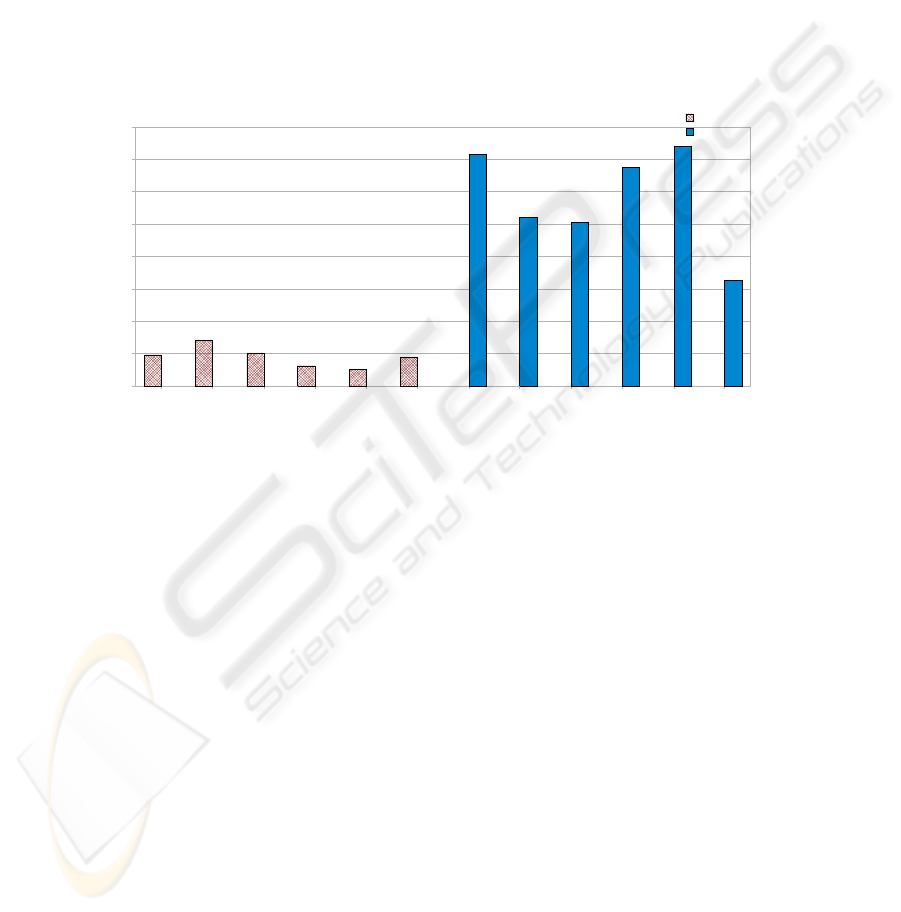
As Figure 3 depicts, results show that the error measure obtained for SCA-2
patients is clearly differentiable for the same measure obtained for control subjects.
That is due to the fact mentioned in the hypothesis (Section 2.1) that if the
independence measure reveals independence between the individual response and the
stimulus signal, then it is possible that the individual presents some degree of ataxia.
When the original signals (stimulus and response) were independent, the estimations
are close to those sources and, therefore, the RMS error decreases.
Sick 1 Sick 2 Sick 3 Sick 4 Sick 5 Sick 6 Control 1 Control 2 Control 3 Control 4 Control 5 Control 6
0
0,1
0,2
0,3
0,4
0,5
0,6
0,7
0,8
SCA-2 patients
Control
Experiments
RMSE (Error)
Fig. 3. Root mean squared error between the estimations and the sources after the application of
the algorithm to EOG data corresponding to SCA-2 patients (left) and control subjects (right).
4 Discussion
The results were obtained from six control subjects and six patients. Confirming our
hypothesis, starting from electro-oculography experiments, patients showed a
different behavior in terms of the visual response to a fixed stimulus (see Figure 2 and
Figure 3). Therefore, after applying our proposed approach to the raw EOG data,
classification and diagnosis can be made easily by simple human inspection of the
results. Nevertheless, further research in this line may help in the categorization of the
several stages of severity of SCA-2.
The proposed method starts from the assumption that the response to a visual
stimulus is different in a healthy individual when compared to the response of an
individual afflicted by SCA-2. In the later situation, the response from the individual
is not dependent on the visual stimulus, so that the ICA algorithm estimations will be
similar to the obtained observations. This criterion has shown to be suitable in order
to distinguish between sick (patients) and healthy (control) individuals.
54

References
1. Bürk, K., Fetter, M., Abele, M., Laccone, F., Brice, A., Dichgans, J., Klockgether, T.:
Autosomal dominant cerebellar ataxia type I: oculomotor abnormalities in families with
SCA1, SCA2, and SCA3. Journal of Neurology 246 (1999) 789-797.
2. Orozco, G., Estrada, R., Perry, T.L., Araña, J., Fernandez, R., Gonzalez-Quevedo, A.,
Galarraga, J., Hansen, S.: Dominantly inherited olivopontocerebellar atrophy from eastern
Cuba: Clinical, neuropathological, and biochemical findings. Journal of the Neurological
Sciences 93 (1989) 37-50.
3. Velázquez Pérez, L., Sánchez Cruz, G., Canales Ochoa, N., Rodríguez Labrada, R.,
Rodríguez Díaz, J., Almaguer Mederos, L., Laffita Mesa, J.: Electrophysiological features
in patients and presymptomatic relatives with spinocerebellar ataxia type 2. Journal of the
Neurological Sciences 263 (2007) 158-164.
4. Velázquez, L.: Ataxia espino cerebelosa tipo 2. Principales aspectos neurofisiológicos en el
diagnóstico, pronóstico y evaluación de la enfermedad. Ediciones Holguín, Holguín (2006).
5. Rivaud-Pechoux, S., Dürr, A., Gaymard, B., Cancel, G., Ploner, C.J., Agid, Y., Brice, A.,
Pierrot-Deseilligny, C.: Eye movement abnormalities correlate with genotype in autosomal
dominant cerebellar ataxia type I. Annals of Neurology 43 (1998) 297-302.
6. Hutton, J.T., Albrecht, J.W., Kuskowski, M., Schut, L.J.: Abnormal ocular motor function
predicts clinical diagnosis of familial ataxia. Neurology 37 (1987) 698-701.
7. Yamamoto, H., Sobue, I.: Analysis of the abnormal ocular movements in spinocerebellar
degenerations and the influence of the thyrotropin releasing hormone. Clinical Neurology
20 (1980) 637-645.
8. Klostermann, W., Zühlke, C., Heide, W., Kömpf, D., Wessel, K.: Slow saccades and other
eye movement disorders in spinocerebellar atrophy type 1. Journal of Neurology 244
(1997) 105-111.
9. Velázquez-Pérez, L., Almaguer-Mederos, L., Santos-Falcón, N., Hechavarría-Pupo, R.,
Sánchez-Cruz, G., Paneque-Herrera, M.: Spinocerebellar ataxia type 2 in Cuba. A study of
the electrophysiological phenotype and its correlation with clinical and molecular variables.
Revista de Neurologia 33 (2001) 1129-1136.
10. Virkkala, J., Hasan, J., Värri, A., Himanen, S.-L., Müller, K.: Automatic sleep stage
classification using two-channel electro-oculography. Journal of Neuroscience Methods
166 (2007) 109-115.
11. Estrada, E., Nazeran, H., Barragan, J., Burk, J.R., Lucas, E.A., Behbehani, K.: EOG and
EMG: Two Important Switches in Automatic Sleep Stage Classification. Engineering in
Medicine and Biology Society, 2006. EMBS '06. 28th Annual International Conference of
the IEEE (2006) 2458-2461.
12. Spicker, S., Schulz, J.r.B., Petersen, D., Fetter, M., Klockgether, T., Dichgans, J.: Fixation
instability and oculomotor abnormalities in Friedreich's ataxia. Journal of Neurology 242
(1995) 517-521.
13. Yokota, T., Hayashi, H., Hirose, K., Tanabe, H.: Unusual blink reflex with four
components in a patient with periodic ataxia. Journal of Neurology 237 (1990) 313-315.
14. Hubner, J., Sprenger, A., Klein, C., Hagenah, J., Rambold, H., Zuhlke, C., Kompf, D.,
Rolfs, A., Kimmig, H., Helmchen, C.: Eye movement abnormalities in spinocerebellar
ataxia type 17 (SCA17). Neurology 69 (2007) 1160-1168.
15. Güven, A.l., Kara, S.: Classification of electro-oculogram signals using artificial neural
network. Expert Systems with Applications 31 (2006) 199-205.
16. Irving, E.L., Steinbach, M.J., Lillakas, L., Babu, R.J., Hutchings, N.: Horizontal Saccade
Dynamics across the Human Life Span. Invest. Ophthalmol. Vis. Sci. 47 (2006) 2478-2484.
17. Kumar, D., Poole, E.: Classification of EOG for human computer interface. Annual
International Conference of the IEEE Engineering in Medicine and Biology - Proceedings,
Vol. 1 (2002) 64-67.
55

18. Brunner, S., Hanke, S., Wassertheuer, S., Hochgatterer, A.: EOG Pattern Recognition Trial
for a Human Computer Interface. Universal Access in Human-Computer Interaction.
Ambient Interaction (2007) 769-776.
19. Komogortsev, O.V., Khan, J.I.: Eye movement prediction by Kalman filter with integrated
linear horizontal oculomotor plant mechanical model. Proceedings of the 2008 symposium
on Eye tracking research & applications. ACM (2008) 229-236.
20. Vaya, C., Rieta, J.J., Sanchez, C., Moratal, D.: Convolutive Blind Source Separation
Algorithms Applied to the Electrocardiogram of Atrial Fibrillation: Study of Performance.
Biomedical Engineering, IEEE Transactions on 54 (2007) 1530-1533.
21. Anemüller, J.r., Sejnowski, T.J., Makeig, S.: Complex independent component analysis of
frequency-domain electroencephalographic data. Neural Networks 16 (2003) 1311-1323.
22. Funase, A., Yagi, T., Barros, A.K., Cichocki, A., Takumi, I.: Single trial analysis on
saccade-related EEG signal. Neural Engineering, 2007. CNE '07. 3rd International
IEEE/EMBS Conference on (2007) 371-374.
23. Hironaga, N., Haruhana, K., Liu, L.C., Fenwick, P.B.C., Ioannides, A.A.: Monitoring of
eye movement and its use for artifact elimination. International Congress Series 1270
(2004) 134-137.
24. Milanesi, M., Martini, N., Vanello, N., Positano, V., Santarelli, M., Landini, L.:
Independent component analysis applied to the removal of motion artifacts from
electrocardiographic signals. Medical and Biological Engineering and Computing 46
(2008) 251-261.
25. Guilhon, D., Medeiros, E., Barros, A.K.: ECG Data Compression by Independent
Component Analysis. Machine Learning for Signal Processing, 2005 IEEE Workshop on
(2005) 189-193.
26. Kocyigit, Y., Alkan, A., Erol, H.: Classification of EEG Recordings by Using Fast
Independent Component Analysis and Artificial Neural Network. Journal of Medical
Systems 32 (2008) 17-20.
27. Hyvarinen, A., Oja, E.: A Fast Fixed-Point Algorithm for Independent Component
Analysis. Neural Computation 9 (1997) 1483-1492.
28. Cardoso, J.-F.: Source separation using higher order moments. ICASSP, IEEE International
Conference on Acoustics, Speech and Signal Processing - Proceedings, Vol. 4 (1989) 2109-
2112.
29. Rojas, F., Alvarez, M.R., Salmerón, M., Puntonet, C.G., Martin-Clemente, R.: Adaptive
and Heuristic Approaches for Nonlinear Source Separation. Proceedings of the
International Joint Conference on Neural Networks, Vol. 1 (2003) 720-725.
30. Martin-Clemente, R., Puntonet, C.G., Rojas, F.: Post-nonlinear blind source separation
using methaheuristics. Electronics Letters, Vol. 39, Issue: 24. (2003) 1765- 1766.
56
