
Investigation of the Use of an Artificial
Neural Network Method for the Prediction of
Crystal Structures of Zeolites from XRD Data
Melkon Tatlier
1
and H. Kerem Cigizoglu
2
1
Department of Chemical Engineering, Istanbul Technical University
Maslak, 34469 Istanbul, Turkey
2
Department of Civil Engineering, Division of Hydraulics, Istanbul Technical University
Maslak, 34469 Istanbul, Turkey
Abstract. The possibility of using artificial neural network methods for the
prediction of zeolite crystal structures, such as pore size and unit cell dimen-
sions, from X-ray diffraction patterns was investigated. The Generalized Re-
gression Neural Network method and X-ray diffraction data obtained from lite-
rature were utilized in these investigations. The predictions made by using this
neural network method were, in general, more reliable than those performed by
regression. The best predictions were achieved for the estimation of the pore
size, while the neural network method improved significantly the very poor re-
sults obtained by regression for the unit cell dimensions.
1 Introduction
Zeolites are hydrated microporous crystalline aluminosilicates that may be used in
diverse applications related to ion exchange, catalysis, adsorption and separation [1-
3]. Zeolites have developed into a large industry due to their unique and versatile
properties. They may be utilized in the separation of linear and branched hydrocar-
bons, for catalytic cracking and hydrocracking or as detergent builders, to name a
few, while a significant number of potential applications are waiting to emerge. Zeo-
lites may occur naturally or be synthesized in laboratory conditions. The most signifi-
cant parameters determining the type of the zeolite formed from a certain initial reac-
tion mixture composition are the synthesis time and temperature as well as the molar
ratios of the reactants. Suitable reagents that form a clear solution or a gel mixture
should be used to obtain different types of zeolites. After carrying out the synthesis
procedure with these reagents, the solid material formed in the solution should be
separated by filtration, which is then characterized by using various techniques. X-ray
diffraction (XRD) is one of the basic and essential techniques to characterize the solid
material thus obtained. XRD may be used to determine the crystallographic structure,
grain size and orientation of the crystals. It is commonly utilized to identify unknown
substances by comparing diffraction data against a database. The relative abundance
of crystalline materials in solid mixtures may also be determined by this technique.
Tatlier M. and Cigizoglu H. (2009).
Investigation of the Use of an Artificial Neural Network Method for the Prediction of Crystal Structures of Zeolites from XRD Data.
In Proceedings of the 5th International Workshop on Artificial Neural Networks and Intelligent Information Processing, pages 97-105
DOI: 10.5220/0002263700970105
Copyright
c
SciTePress

Additionally, when coupled with lattice refinement techniques, it can provide
structural information on unknown materials. The achievement of this last deed is not
a simple task to perform and requires significant amount of knowledge on the numer-
ous peaks pertaining to the X-ray diffraction patterns of different materials.
Artificial neural networks (ANNs) have the ability to learn from input data and are
very useful for the prediction of complex high-dimensional data. ANN methods have
a broad range of applications, including research in chemical engineering. Artificial
neural networks have been successfully used for dynamic modeling and control of
chemical processes and fault diagnosis [4], in the catalytic modeling and design of
solid catalysts [5] and for modeling the kinetics of a chemical reaction [6]. The appli-
cability of ANN methods in emulsion liquid membranes [7] and in the predic-
tion/estimation of the vapor-liquid equilibrium data [8] has been investigated. It has
also been shown that ANN methods might learn efficiently from available zeolite
synthesis data in the literature to predict the complex relationship between the chemi-
cal compositions of initial reaction mixtures and the zeolites formed from them [9].
A detailed theoretical investigation of the rather complex and high dimensional re-
lationship between the XRD peaks and the crystallographic properties of various
zeolites (as well as other crystalline materials) may be very useful to provide a more
common and practical use of the XRD technique in the prediction of the crystal struc-
tures of unknown zeolites and other materials.
In this study, the Generalized Regres-
sion Neural Network (GRNN) method was utilized to perform this investigation. The
results obtained were compared to XRD data reported in the literature, as well as to
the estimations made by using multilinear regression.
2 Theory
2.1 X-Ray Diffraction Technique
Crystals are regular arrays of atoms, and X-rays can be considered as waves of
electromagnetic radiation. Atoms scatter X-ray waves, primarily through their
electrons. An X-ray striking an electron produces secondary spherical waves
emanating from the electron, which is known as elastic scattering. Although these
waves cancel one another out in most directions through destructive interference, they
add constructively in a few specific directions, determined by Bragg’s law,
2dsinθ = nλ
(1)
where d is the spacing between diffracting planes in Å, θ is the incident angle in
degrees, n is any integer, and λ is the wavelength of the beam in Å. These specific
directions appear as spots on the diffraction pattern. It should be mentioned that X-
rays have wavelengths on the order of a few angstroms, the same as typical
interatomic distances in crystalline solids. This means that X-rays can be diffracted
from minerals which, by definition, are crystalline and have regularly repeating
atomic structures.
In the XRD technique, the X-ray intensity is recorded and reported
as a function of the 2θ angle.
98

2.2 Artificial Neural Networks
Artificial neural networks are black box models that can perform an estimation using
limited input and output data patterns. In this study, the Generalized Regression
Neural Network (GRNN) method was used to relate the XRD data to the properties of
the crystal structures of zeolites.
The basics of the GRNN can be found in the literature [10,11].
The GRNN method
does not require an iterative training procedure but instead estimates any arbitrary
function between input and output vectors, drawing the function estimate directly
from the training data. This method is consistent, that is, as the training set size be-
comes large, the estimation error approaches zero, with only mild restrictions on the
function. The GRNN is used for estimation of continuous variables, as in standard
regression techniques. It is based on a standard statistical technique called kernel
regression. By definition, the regression of a dependent variable y on an independent
x estimates the most probable value for y, given x and a training set. The regression
method will produce the estimated value of y, which minimizes the mean-squared
error. The GRNN consists of four layers: input layer, pattern layer, summation layer,
and output layer. The first layer is fully connected to the second, pattern layer, where
each unit represents a training pattern and its output is a measure of the distance of
the input from the stored patterns. Each pattern layer unit is connected to the two
neurons in the summation layer: S-summation neuron and D-summation neuron. The
S-summation neuron computes the sum of the weighted outputs of the pattern layer
while the D-summation neuron calculates the unweighted outputs of the pattern neu-
rons. The connection weight between the i
th
neuron in the pattern layer and the S-
summation neuron is y
i
, the target output value corresponding to the i
th
input pattern.
For D-summation neuron, the connection weight is unity. The output layer merely
divides the output of each S-summation neuron by that of each D-summation neuron.
In this method, the spread σ is a smoothing parameter, the optimal value of which is
often determined experimentally [12]. When the spread parameter σ is made large,
the estimated density is forced to be smooth and in the limit becomes a multivariate
Gaussian with covariance σ
2
I. On the other hand, a smaller value of σ allows the
estimated density to assume non-Gaussian shapes, but with the hazard that wild
points may have too great an effect on the estimate. In this study, different spreads
were tried to find the best one that gave the minimum difference between predicted
and experimental values for the utilization of the cross-validation data.
2.3 Method
Zeolites are hydrated microporous crystalline materials. The zeolite framework con-
sists of an assemblage of SiO
4
and AlO
4
tetrahedra, joined together in various regular
arrangements through shared oxygen atoms, to form an open crystal lattice. The mi-
cropore structure is determined by the crystal lattice, which contains pores of molecu-
lar dimensions into which guest molecules can penetrate. The cations (e.g., Na) are
placed in special positions near the Al atoms. The pore size varies for different zeo-
lites, depending on the arrangement of the atoms forming the zeolite crystal structure.
The crystal structure of a material or the arrangement of atoms in a crystal structure
99

can be described in terms of its unit cell. The unit cell is a tiny box with one or more
spatial arrangements of atoms. The unit cells stacked in three-dimensional space
describe the bulk arrangement of atoms of the crystal. The crystal structure has a
three dimensional shape. The unit cell may be represented by its lattice parameters,
including the length of the cell edges and the angles between them.
Data obtained from the literature [13], describing the XRD patterns of different
zeolites were used in the estimations carried out by using the ANN method. Prelimi-
nary estimations indicated that the GRNN method was more successful in the predic-
tion of the zeolite crystal structure from XRD data when compared to the Radial Ba-
sis Function-Based Neural Networks (RBF) and Feed Forward Back Propagation
(FFBP) methods, which were also examined. Thus, the GRNN method was used for
the estimations performed in detail. The components of the input vector were the 2θ
angles of eight XRD peaks with the highest intensity pertaining to different zeolites,
while the components of the output vector were the pore sizes (r) and lengths of the
unit cell edges (a,b,c) of these zeolites. The pore sizes and unit cell dimensions of
zeolites generally vary between a few angstroms and a few nanometers. Since the
pores of some zeolites are not uniform and some others may have pore channels of
different lengths, the largest dimensions of the pores were taken into consideration in
this study.
The application of the ANN to data consisted of two steps. The first step was the
training of the neural networks, which comprised the presentation of training data
(data set 1) describing the input and output to the network and obtaining the inter-
connection weights. The components of the input vector were eight different 2θ an-
gles of the XRD peaks, while the components of the output vector were the pore sizes
and the three different lengths of the unit cell edges of corresponding zeolites. The
input and output data were normalized between 0 and 1 prior to the training. Once the
training stage was completed, the ANNs were applied to the cross-validation data
(data set 2). Determining an appropriate architecture of a neural network for a par-
ticular problem is an important issue, since the network topology directly affects its
computational complexity and its generalization capability. The number of hidden
layers and the number of nodes in the hidden layers were determined after trying
various network structures. The network structure providing the best result was de-
termined according to the success of the predictions performed by using the cross-
validation data set. The ANN method was used to predict only one component of the
output vector at a time.
The number of data used for training was 55 while that used for cross-validation
was 7. The zeolites consisting of silicon, aluminum, oxygen, water and different ca-
tions were taken into consideration in the investigations carried out in this study.
The results obtained by using the GRNN method were compared to the actual val-
ues [13] as well as to those values estimated by using multilinear regression. In re-
gression, the relationships between the 2θ angles of eight XRD peaks and the pore
sizes and lengths of the unit cell edges of zeolites were determined by using data set
1. The information obtained was used in the estimation of the pore sizes and lengths
of the unit cell edges of the zeolites investigated in data set 2. Since, to our know-
ledge, a similar theoretical attempt, for determining such a relationship has not been
performed before, the comparison of the results obtained from ANN methods to those
determined by multilinear regression may be a reasonable first approach. The regres-
100

sion model tested in this study was of simple linear form, as given below. R
represents either the pore size or the lengths of the unit cell edges of zeolites
R = a
0
+ a
1
(2θ
1
)+ a
2
(2θ
2
)+ a
3
(2θ
3
)+ a
4
(2θ
4
)+ a
5
(2θ
5
)+ a
6
(2θ
6
)+ a
7
(2θ
7
)+ a
8
(2θ
8
) a
8
(2θ
8
) (2)
The relative error (d) was used to monitor the success of the ANN method and re-
gression used in the prediction of zeolite crystal properties from the 2θ angles of the
X-ray diffraction patterns. d was determined by taking into consideration the devia-
tion (%) of the pore sizes or lengths of the unit cell edges of zeolites, calculated by
using the ANN method (c
calc
), from the corresponding actual values (c
act
).
d = ⏐c
act
-c
calc
⏐/ c
act
x 100 (3)
d
m
was defined as the arithmetic mean of the relative errors obtained for the dif-
ferent data used in prediction.
3 Results and Discussion
3.1 Criteria assuring Best Performance for the GRNN Method
The predictions of the pore sizes and lengths of the unit cell edges of zeolites investi-
gated in data set 2 were performed by using GRNN method mentioned above, and
data set 1 for training. As mentioned before, the network structure providing the best
result was determined according to the success of the predictions performed by using
the cross-validation data. It was also established that the conditions providing the best
results in the testing stage could allow the ANN method to exhibit quite high perfor-
mances in the training stage.
For the GRNN method, spread factors in the range 0.02-0.2 were the conditions
determined to give the best results. The spread factor was determined to be equal to
0.15, 0.075, 0.2 and 0.02 for r (pore size of zeolites), a, b and c (lengths of unit cell
edges of zeolites), respectively, by using the cross-validation data for the optimiza-
tion. When the optimization was performed by using training data (data set 1), with-
out taking into consideration data set 2, the d
m
values, representing the deviation of
the predicted values of data set 1 from experimental values, were less than 10% for all
the cases investigated. When the spread factor was optimized by using data set 2, the
predictive power of the GRNN method was not reduced significantly. The predictions
made by using the GRNN method for the pore size and lengths of the unit cell edges
of zeolites are detailed below.
3.2 Evaluation of the Predictions made by the GRNN Method
The results obtained by the GRNN method are depicted in Figures 1-4 for r (pore
size), a, b, and c (lengths of the unit cell edges) of zeolites, respectively. The devia-
tions of the results obtained by using the ANN method from the actual values may be
observed more clearly from Table 1. The performance exhibited by multilinear re-
101
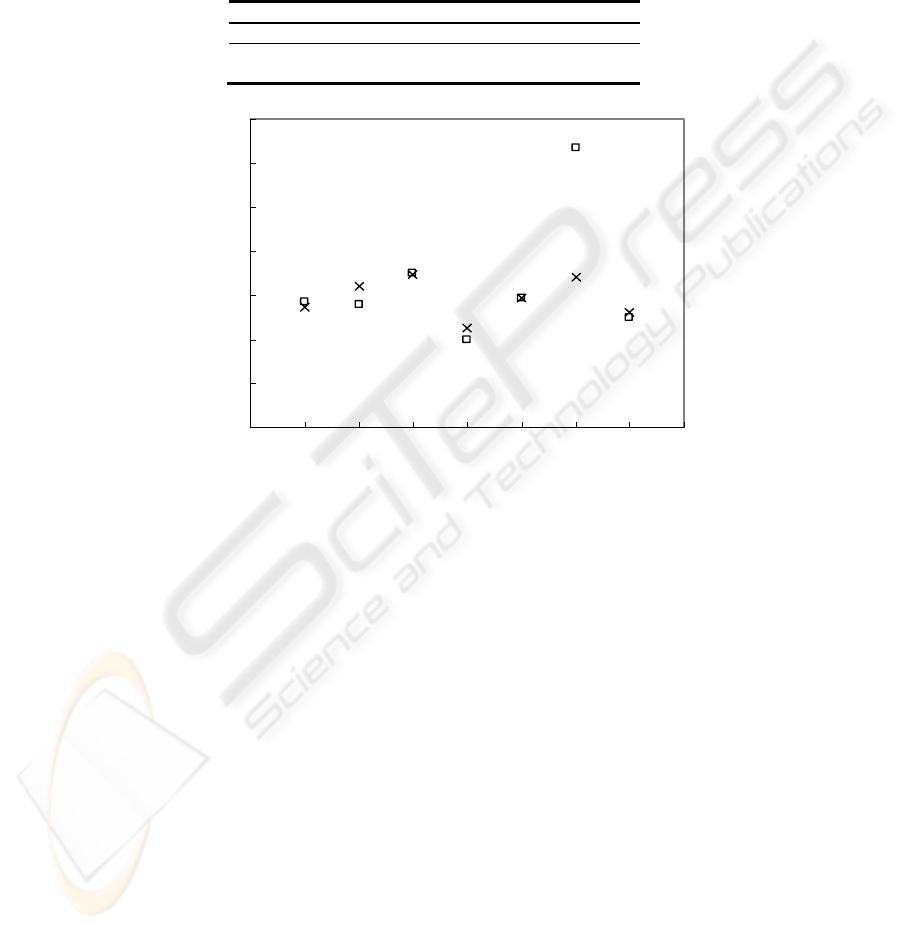
gression may also be seen in the table. It may be observed from Figures 1-4 and Table
1 that the GRNN method provided fairly good fits to the actual results for most of the
data, though there were some discrepancies. The average deviation from actual results
was smaller for the pore size predictions while the largest deviation was observed for
length, a, of the unit cell edge.
Table 1. Relative errors obtained for the predictions.
Method d
m
(%)
r a b c
GRNN 12.0 30.9 17.5 22.2
regression 14.7 149.4 169.2 160.7
0
2
4
6
8
10
12
14
012345678
Data number
r (Å)
Fig. 1. Zeolite pore size predictions by (x) GRNN in comparison to (_) actual values.
The results obtained for regression given in Table 1 should also be taken into con-
sideration before arriving at a conclusion about the success of the ANN method in the
prediction of the zeolite crystal structure properties. When multilinear regression was
utilized, the average deviation from the actual values was slightly higher than that of
the GRNN method for the prediction of the pore size. However, the predictions of the
lengths of the unit cell edges were very poor with multilinear regression. The average
deviation was equal to about 150-170% for the estimation of all the three edges of the
unit cell. When this information is taken into consideration, the average deviations
between 17% and 31% provided by the GRNN method may be regarded to be quite
promising. For further improvement, additional XRD data, for example, those per-
taining to zeolite-like materials may also be included for the training of the neural
networks. Furthermore, the height and width of the XRD peaks may also be taken
into consideration as components of the input vector. Different ANN methods may
also be tested for possible improvements in the prediction of crystal structures from
XRD data.
102
The superiority of the ANNs over conventional methods for the prediction of com-
plex and high dimensional relationships, such as the one investigated in this study,
can be attributed to the capability of the ANNs to capture the nonlinear features and
generalize the structure of the whole data set. ANN methods are flexible alternatives
and standard ANN software can be used to construct intricate multipurpose nonlinear
solutions. The method has no limitations in the form of fixed assumptions or formal
constraints. The neural network has a distributed processing structure. Each individu-
al processing unit or the weighted connection between two units is responsible for
one small part of the input–output mapping system.
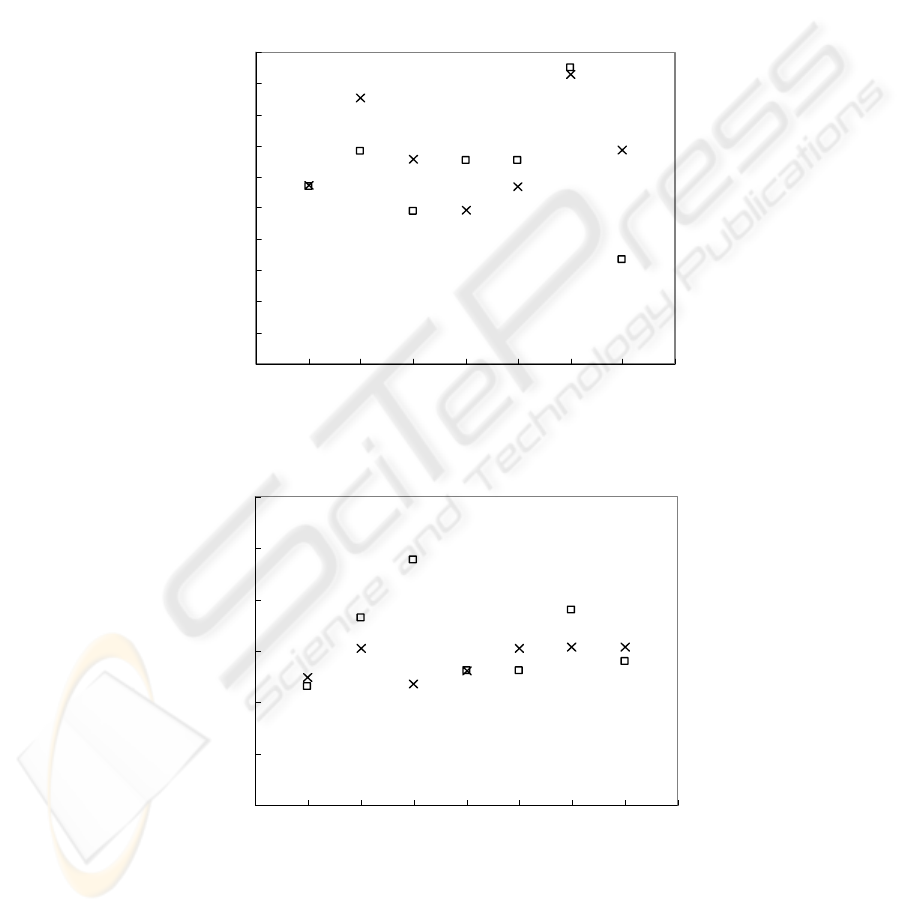
0
2
4
6
8
10
12
14
16
18
20
012345678
Data number
a (Å)
Fig. 2. Unit cell length, a, predictions by (x) GRNN in comparison to (_) actual values.
0
5
10
15
20
25
30
012345678
Data number
b (Å)
Fig. 3. Unit cell length, b, predictions by (x) GRNN in comparison to (_) actual values.
103
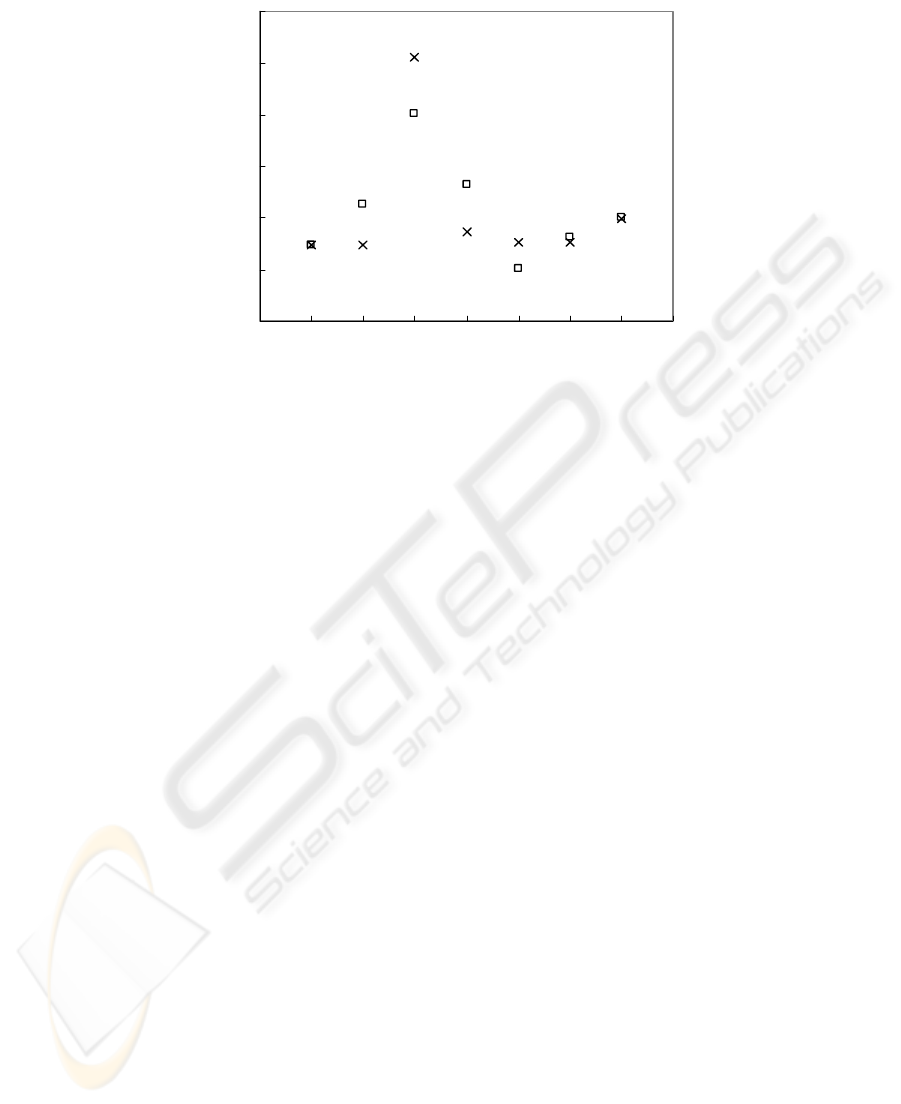
0
5
10
15
20
25
30
012345678
Data number
c(Å)
Fig. 4. Unit cell length, c, predictions by (x) GRNN in comparison to (_) actual values.
4 Conclusions
It was determined that neural networks might learn from XRD data to predict some
properties of the crystal structures of zeolites. The predictions made were, in general,
much more reliable than those performed by the multilinear regression. The best
prediction was made for the pore sizes of zeolites, which also represented the case
where the difference between the success of the predictions made by regression and
neural networks was the smallest. The improvement provided by the use of the
GRNN method, when compared to regression, was quite significant for the predic-
tions of the lengths of the unit cells of zeolites.
The use of artificial neural network methods may allow a better understanding of
the relationship between the X-ray diffraction patterns and the crystallographic prop-
erties of zeolites as well as other materials. This will ease and support the discovery
of novel crystal materials since a short and practical characterization by using availa-
ble XRD data will become possible. It should also be remembered that in case train-
ing and cross-validation data other than those adopted in this study, (e.g., those per-
taining to different types of materials) could be used with GRNN as well as other
ANN models to make the predictions, the relative success of prediction might still
improve. Recurrent neural networks and optimization of neural network architecture
by using genetic programming are methods that may be tested for providing further
developments.
References
1. Weitkamp, J.: Zeolites and Catalysis. Solid State Ionics 131 (2000) 175-188.
104

2. Caro, J., Noack, M., Kolsch, P., Schafer, R.: Zeolite Membranes-State of Their Develop-
ment and Perspective. Microporous Mesoporous Mater. 38 (2000) 3-24.
3. Ruthven, D.M.: Zeolites as Selective Adsorbents. Chem. Eng. Progr. 84 (1988) 42-50.
4. Hussain, M.A.: Review of the Applications of Neural Networks in Chemical Process Con-
trol- Simulation and Online Implementation. Artif. Int. Eng. 13 (1999) 55-68.
5. Huang, K., Chen, F., Lu, D.: Artificial Neural Network-Aided Design of a Multi-
component Catalyst for Methane Oxidative Coupling. Appl. Catal. A 219 (2001) 61-68.
6. Serra, J.M., Corma, A., Chica, A., Argente, E., Botti, V.: Can Artificial Neural Networks
Help the Experimentation in Catalysis? Cat. Today. 81 (2003) 393-403.
7. Chakraborty, M., Bhattacharya, C., Dutta, S.: Studies on the Applicability of Artificial
Neural Network (ANN) in Emulsion Liquid Membranes. J. Membrane Sci. 220 (2003) 155-
164.
8. Sharma, R., Singhal, D., Ghosh, R., Dwivedi, A.: Potential Applications of Artificial Neur-
al Networks to Thermodynamics: Vapor-Liquid Equilibrium Predictions. Comp. Chem.
Eng. 23 (1999) 385-390.
9. Tatlier, M., Cigizoglu, H.K., Erdem-Şenatalar, A.: Artificial Neural Network Methods for
the Estimation of Zeolite Molar Compositions That Form from Different Reaction
Mixtures. Comp. Chem. Eng. 30 (2005) 137-146.
10. Tatlier, M., Cigizoglu, K.B, Cigizoglu, H.K., Erdem-Şenatalar, A.: Low-Silica Zeolite
Coatings Prepared by Using Predictions from an Artificial Neural Network Method. J. Por-
ous Mater. 15 (2008) 389-395.
11. Specht, D.F.: A General Regression Neural Network. IEEE Trans. Neural Networks 2 (1991)
568-576.
12. Tsoukalas, L. H., Uhrig, R. E.: Fuzzy and Neural Approaches in Engineering. Wiley, New
York (1997).
13. Kim, B., Kim, S., Kim, K.: Modeling of Plasma Etching Using a Generalized Regression
Neural Network. Vacuum 71 (2003) 497-503.
14. Treacy, M.M.J., Higgins, J.B.: Collection of Simulated XRD Powder Patterns for Zeolites.
Elsevier, Amsterdam (2001).
105
