
EFFECT OF ANESTHESIA ON CHAOTIC DYNAMICS
IN FINGER PLETHYSMOGRAMS
Mayumi Oyama-Higa
Osaka University, Japan
Tiejun Miao
CCI Corporation, Japan
Akira Imanishi
Kwansei Gakuin University, Japan
Junji Kojima
Rakuwakai Otowa Hospital, Japan
Keywords: Chaotech dynamics, Anesthesia, Finger plethysmograms, Non-liner analysis.
Abstract: Chaotic dynamics in finger plethysmogram system was studied in relation to anesthesia processes. The
experiments were conducted to observe the changes in finger plethysmogram before, during, and after the
anesthesia for a surgery. The largest Lyapunov exponent of the plethysmograms was found to be significant
and can be used to correlate the temporal variations of mental/physical status in the processes. There were
lower values o f Lyapunov exponents during anesthesia, showing the block effect of anesthesia on central
nervous system. There were highly Lyapunov exponents in recovery consciousness from anesthesia. To
understand how the chaos arises and to explain the changes in the Lyapunov exponent in finger
plethysmograms in experiments, a mathematical model consisting of baroreflex feedback and autonomous
interactions was proposed and studied numerically. The decrease of the largest Lyapunov exponent in
plethysmograms was explained successfully by the model in relation to the decreased chaoticity, and hence
the depressed or blocked central nervous system in higher cerebral region.
1 INTRODUCTION
The chaotic dynamics has been evidenced in
experiments in the time series of finger
plethysmograms (Sumida et al., 2000). An extensive
investigation has focused on applying changes of the
deterministic chaos of finger plethysmograms to
estimating physiological/physical status (Miao et al.,
2003a), diseases diagnosis (Oyama-Higa and Miao,
2005), evaluations of anxiety states (Miao et al.,
2003b), and to estimating mental work load by the
use of human finger photo-plethysmograms recorded
during driving environments. It showed that
fluctuation analysis based on chaotic dynamics of
the plethysmogram systems could characterize
effectively the changes in physical/physiological
status in various conditions.
In this study, we designed an experiment to
observe the changes in chaos of finger
plethysmogram before, during, and after the
anesthesia for a surgery. To understand how the
chaos changes, a mathematical model was proposed
and studied numerically.
2 METHOD OF EXPERIMENTS
The patient participated the experiment was a male
aged 71. He was made a deeply anesthesia in order
for a surgery of cancer treatment. The surgery taken
400
Oyama-Higa M., Miao T., Imanishi A. and Kojima J. (2009).
EFFECT OF ANESTHESIA ON CHAOTIC DYNAMICS IN FINGER PLETHYSMOGRAMS.
In Proceedings of the 4th International Conference on Software and Data Technologies, pages 400-405
DOI: 10.5220/0002265604000405
Copyright
c
SciTePress
place at Rakuwakai Otowa Hospital, Kyoto,
December 12, 2008. The participant gave informed
consent to all experimental procedures.
The subject slept comfortably in a hospital bed in
a relaxed manner. The hand was softly put on the
side of his body, held in a relaxed semi-open
position, with the palm turned downward. A
photoelectric sensor of the plethysmography was
placed on the distal phalanx of second finger. Finger
plethysmogram was recorded continuously for all
processes including before, during and after the
surgery, by an instrument (BACS2000; CCI). The
signals were digitized with a 200Hz sampling rate
with resolution 12 bits, and transferred via an A/D
converter to a PC for data processing.
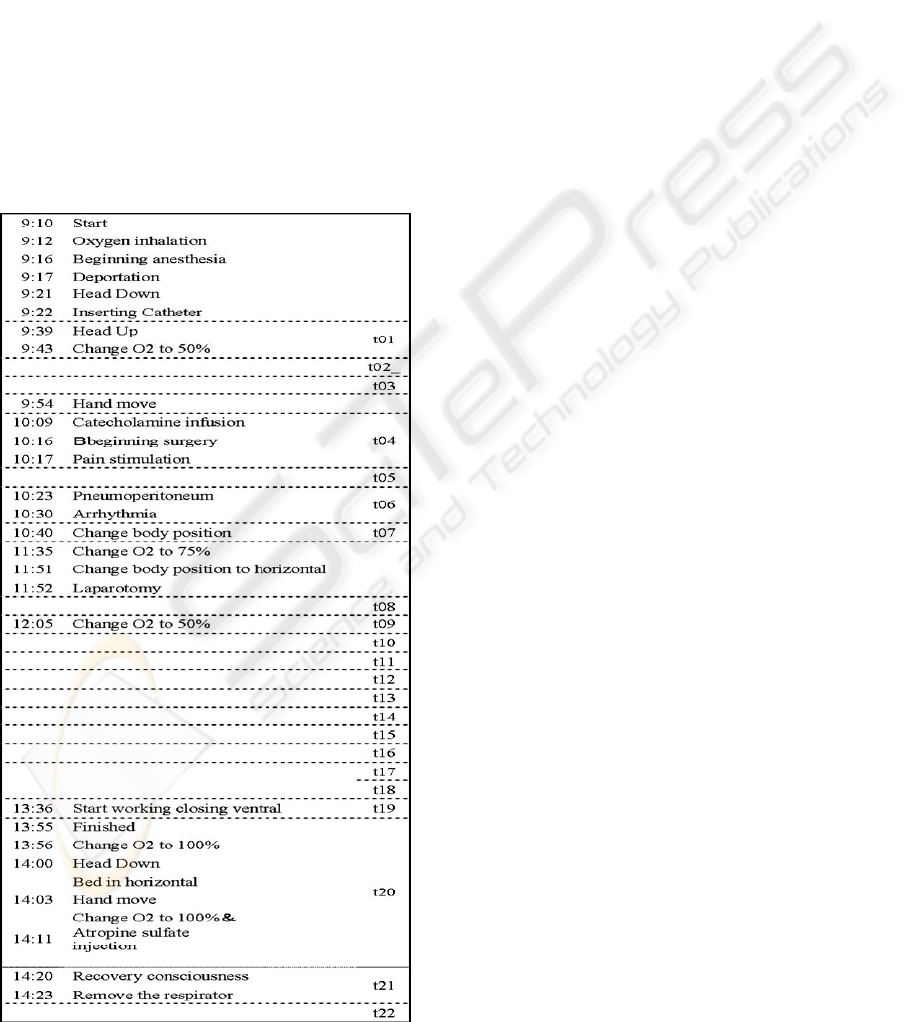
Table 1 shows the steps and processes including
before, during and after anesthesia for the surgery.
Table 1: Processes before, during and after the surgery.
3 METHOD OF CHAOS
ANALYSIS OF TIME SERIES
Given a time series x()i, with i=1,..., N, the phase
space is reconstructed by using the method of
delays. Assuming that we create a d-dimensional
phase space using a τ constant delay lag, the vectors
in the space are formed by d-tuples from the time
series and are given by
x(i) = (x (i),..., x (i – (d – 1)
τ))= {x
k
(i)} (1)
where x
k
(i) = x(i − (k – 1) τ), with k=1,..., d. In order
to correctly reconstruct the phase space, the
parameters of delay lag τ and embedding dimension
d should be chosen optimally.
On the reconstructed phase space, one of the
important complexity measures is the largest
Lyapunov exponent. The Lyapunov exponents
characterize how a set of orthonormal, infinite small
distances evolve under the dynamics. For a chaotic
system, there is at least one positive Lyapunov
exponent, let λ
1
> 0 be the largest exponent. The
defining property of chaos is sensitive dependence
on initial conditions, in the following sense. Given
an initial infinite small distance
∆x(0) , its evolution obeys
∆x(t) =∆x(0)℮
λ
1
t
(2)
For an M-dimensional dynamical system, there are
M Lyapunov exponents. We estimated only λ
1
using
algorithm of Sano and Sawada (Sano and Sawada,
1985).
We used chaos analysis to finger plethysmograms
and estimate the largest Lyapunov exponent λ
1
.
.
4 EXPERIMENT RESULTS
Since the chaoticity of the plethysmogram can give
important information about human temporal
processing, we used chaos analysis to the
plethysmograms and estimate the largest Lyapunov
exponent. Parameters used are embedding
dimension d=4, time delay lag is taken as 50ms.
Fig.1 illustrates changes of the largest Lyapunov
exponent for all processes on the Table I, where
times indicated ranged from t1-t22.
There are changes of chaotic dynamics indicated
by Lyapunov exponent during all experiment
processes. We found there smaller values estimated
EFFECT OF ANESTHESIA ON CHAOTIC DYNAMICS IN FINGER PLETHYSMOGRAMS
401
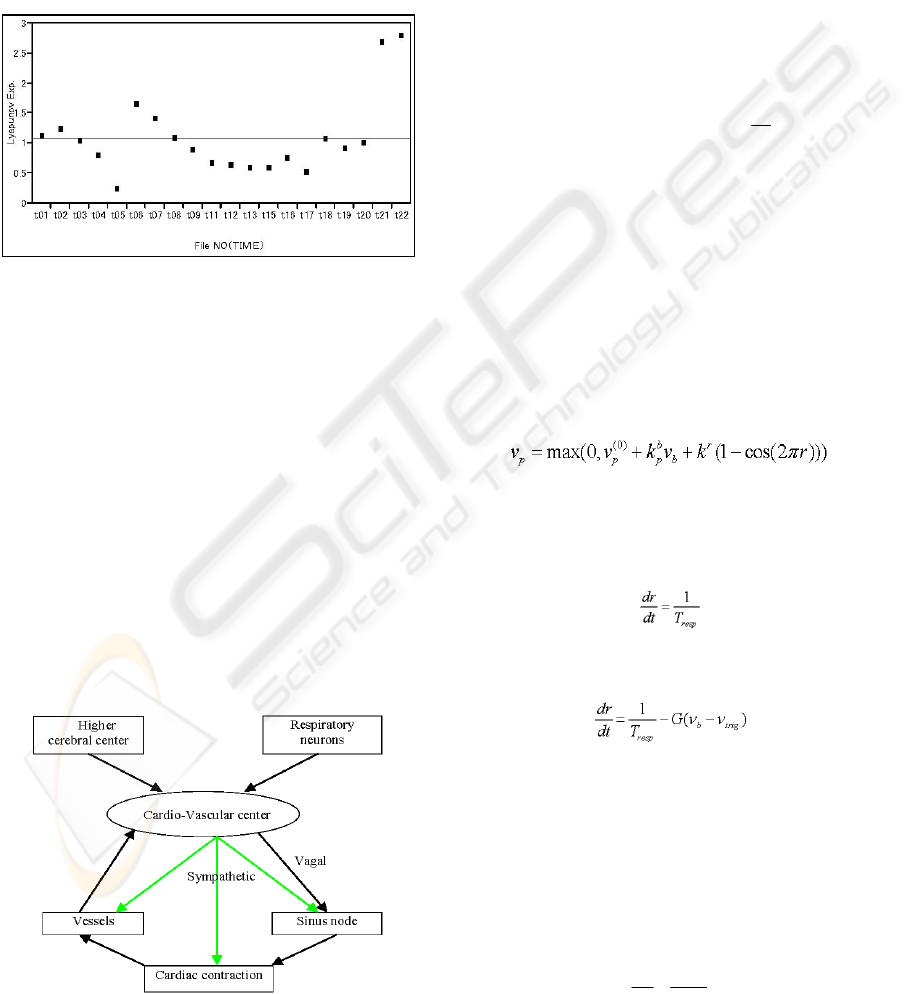
during t11 to t19, showing the effect of laparotomy
and change O2 to 50% on cam down the
mental/physical status. Whereas there were largely
arising Lyapunov exponents in recovery
consciousness from anesthesia, even higher than the
ones in initial stage before the surgery. There were
overall lower values o f Lyapunov exponents than
the average one for healthy subject that had
averaged values ranged 3-5, showing the block
effect of anesthesia on central nervous system.
Figure 1: Lyapunov exponents for experimental processes.
5 MATHEMATICAL MODEL
AND SIMULATIONS
To understand emergence of changes of chaos in the
finger plethysmograms in the experiments, a
mathematical model is proposed. Fig. 2 shows a
schematic description of the model used in this
paper. The model consists of a feedback loop and
physiological factors (Miao et al., 2006). The
pressure receptors are the sensors of the system,
which senses and transmits neural afferents from
pressure to cardio-vascular centre. Neural efferents
are created and then sent to effectors. There are
influences both from respiratory centers and from
higher cerebral region.
Figure 2: Schematic representation of the model.
It notes that pulsations in blood volume of ear were
able to be represented as a response function to
pulsations in radial artery (Liu, 2003), and whence a
proportional relation between the finger
plethysmogram and artery blood pressure can be
approximately assumed. Thus, for sake of
simplifying unimportant details, our model
concentrated on dynamics of blood pressure in a
well approximation to approaching finger
plethysmograms without loss of generality.
In the model, baroreceptor activity is determined
by pressure p and its derivative, with constants
k
1
=0.02 mm/Hg, k2=0.00125 smm/Hg, and
p0=50mmHg, as
V
b
= k
1
(p – p
(0)
)+ k
2
dp
dt
(3)
The neural efferent of sympathetic activity is
determined by (3) as
max(0, – k (1 cos(2 )) )
(0)
Vvvk rY
br
sssb
πγ
=+−+
(4)
where constants
ν
=0.8, k
s
=0.7 , k
r
=0.035; Y is the
impulse input from higher cerebral center and is
assumed to only affect sympathetic neural efferents
through a coupling coefficient γ. r is an instance
phase of respiration describing effects of respiration
modulations. Likewise, efferent parasympathetic
activity is determined by (3) as
(5)
where constants ν
(0)
=0.0, k
b
=0.3 .
As suggested in Kotani (Kotani et al., 2005), the
instance respiration phase r has a constant phase
velocity during inspiration with period T
resp=4.5s, as
(6)
Whereas during expiration (
sin(2 πr) >0
) and if
ν >ν
,
r is modulated by baroreceptor afferents as
(7)
where G=0.2,
ν
trig
=1.3
.
The pulsating heartbeat is generated by an integrate-
and-firing model. A pacemaker phase of sinus node
was introduced. A new heartbeat is generated when
the phase reaches a threshold of 1.0. At this point the
phase is then reset to zero. The phase velocity is
determined by sympathetic and parasympathetic
influences on sinus node by the relation
1
(0)
d
ff
dt
T
sp
φ
=
(8)
ACT4SOC-EHST 2009 - 4th International Conference on Software and Data Technologies
402

Where T
(0)
=1.1s, and
(9)
(10)
where sympathetic influence fs is determined by
constants of
, and cardiac
concentration (ccNe) of neurotransmitter
"norepinephrine" (Ne). The cardiac concentration
(ccNe) follows kinetics equation:
(11)
Where t
cNe
=2.0,
cNe
K
s
c
=1.2, and time delay
θ
cNe
=1.65s (default) due to the neural conduction.
The parasympathetic influence fp is determined by
constants k
φ
p
= 5.8,
ˆ
v
p
= 2.5, np=2.0, and time delay
p
θ
=0.5s (default=. The influence of fp is fast and
therefore does not need transmitter kinetics.
Whereas phase effective cure F (
φ
) is added in (10)
by
3
1.3
33
(1 )
() ( 0.45)
(1 0.8 ) (1 )
F
φ
φφφ
φ
−
=−
−+−
(12)
Blood pressure during the systolic part of the heart
cycle is determined by diastolic pressure of the
previous beat d
i-1 and cardiac contractility Si of the
current beat:
1
exp 1
i
sys sys
ii
tt tt
pd S
tt
i
−
⎧⎫
−−
⎪⎪
=+ −
⎨⎬
⎪⎪
⎩⎭
(13)
where t
i is the time of last contraction onset,
sys
t
=
0.125s , and cardiac contractility, according to Frank-
Starling law, is
(0)
1
'
ct
CT
iscNesi
SSk k
−
=+ +
(14)
Cardiac contractility with saturation becomes
'
'( ')
'
ns
ns ns
i
ii i
i
S
SS SS
SS
=++ +
+
(15)
Where S
(0)
=25mmHg,
c
s
k
=40mm/Hg,
t
s
k
=10mm/Hg,
ˆ
S
=70mmHg, ns=2.5. Blood pressure during
diastolic part of hear cycle, according to relaxation
of Windless arteries, is
()
v
dp p
dt t t
=−
(16)
Where relaxation constant t
v
is determined by
vascular concentration of C
vNe
:
(17)
where
(0)
v
t
τ
= 2.2s,
v
t
= 1.2s
,
c
ν Ne
= 10.0
,
n
ν Ne
= 1.5
, and
vascular concentration follows equation of
()
ee
s
vNe
e
s
vN vN
c
vNe
vN
dc c
k
dt t
vt
θ
=− + −
(18)
Where time delay
vNe
θ
=1.65s (default) is due to
neural conduction
e
vN
t
=2.0, and
vNe
s
c
k
=1.2.
Because the higher cerebral activity played
important in modulation central nervous system and
autonomic system, our model added the influences
to sympathetic neural efferent activity through a
coupling coefficient γ as shown in (4). Dynamics of
the cerebral activity was assumed to be described by
Duffing equation that was able to generate both limit
cycle and chaotic behavior (Bergey and
Franaszczuk, 2001), as evidenced experimentally by
measurements of electroencephalography (EEG).
Thus, we chose Duffing equation to describe
cerebral impulse activities Y as:
2
3
2
cos
dY dY
aY bY B t
dt
dt
εω
+++=
(19)
Where
ε
=0.05, a=0, b=1.0,
ω
=1.0, B=7,5. This
setting of parameters gives arise of chaotic dynamics
in agreement with studies on human brain (Korn and
Faure, 2003).
In simulation studies, we used a Runge-Kutta
method to make numerical simulations of the delay-
differential equations. Ring buffers were used to
handle time delays in equations. We used the initial
values of p=110 mmHg,
cNe
c
=
vNe
c
=0.15
, d0=90
mmHg, S
0
=40 mmHg, and T
0
=1.1s. Simulations
were performed to skip first 200s transients and
recorded the following data.
For parameters γ =0.1,
cNe
θ
=2.5s, in Fig. 3 we
calculated and depicted temporal variations of blood
pressure p, concentrations
cNe
c
, higher cerebral
activity Y, baroreceptor activity v
b
, delayed
sympathetic activity v
s
(t-
cNe
θ
), delayed vagal
activity v
p
(t-
θ
p
), and phase of cardiac pacemaker φ.
There appeared a complex dynamics in blood
pressure p. Indeed, as shown in Fig. 4, return maps
for peak value of blood pressure P
i
showed
EFFECT OF ANESTHESIA ON CHAOTIC DYNAMICS IN FINGER PLETHYSMOGRAMS
403
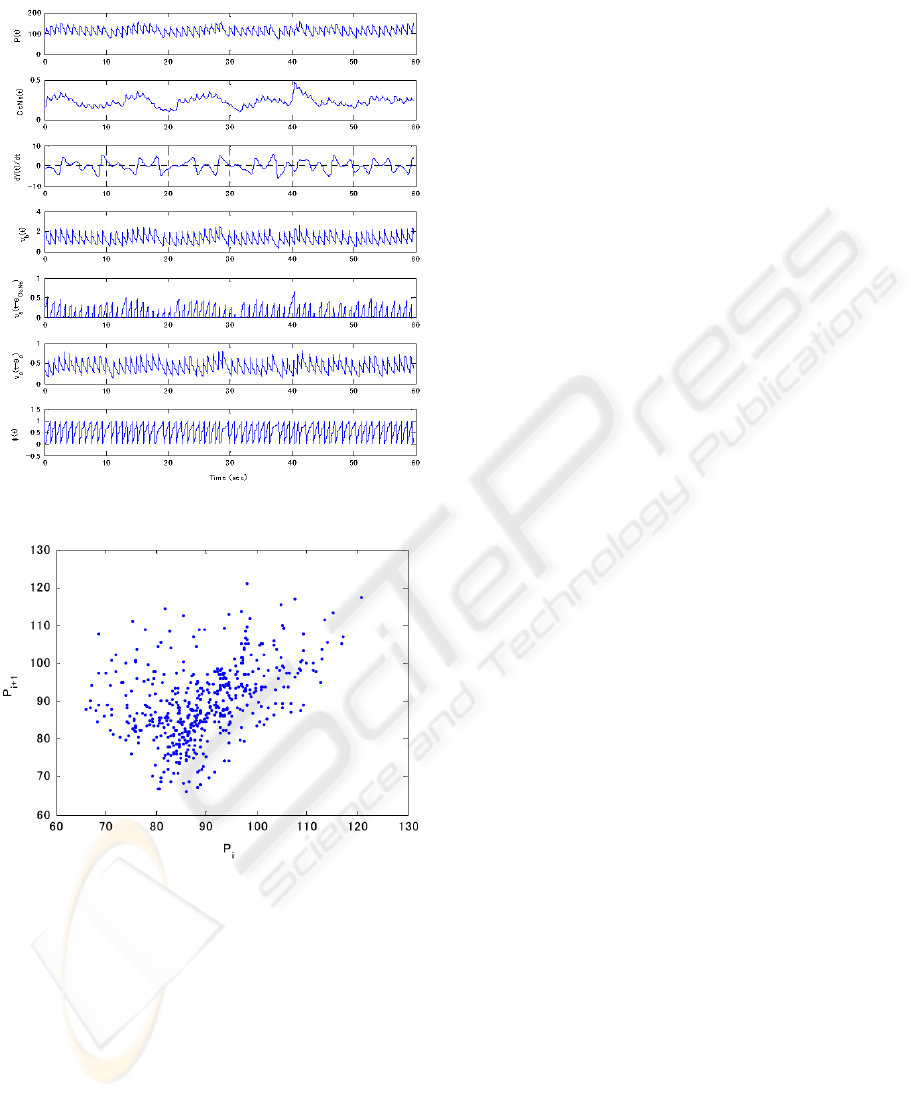
complexity and random-like patterns, characterizing
a chaotic behavior.
Figure 3: Output with influence of higher cerebral center.
Figure 4: Return maps for peak value of pressure P
i
.
Additionally the reconstructed orbits (called
attractor)
exhibited complex, non-periodic, diverse
orbiting patterns, strongly suggesting deterministic
chaotic behaviors. Lyapunov exponents of the
chaotic attractors were also calculated, as described
in next section, and showed positive values, again
being consistent with chaotic behaviors.
Higher cerebral center influence, therefore, was
found to play an important role and largely
responsible for emergence of chaos in finger
plethysmograms.
Furthermore, effects of chaoticity in higher
cerebral center were studied by simulation to
understanding how it affects the baroreflex
controlled cardiovascular system. Keeping coupling
coefficient γ =0.1 in constant, while changing
parameter B to 6.6, 7.0, and 7.5, we obtained a
changing chaoticity of higher center activity
described by Duffing equation (19), which was
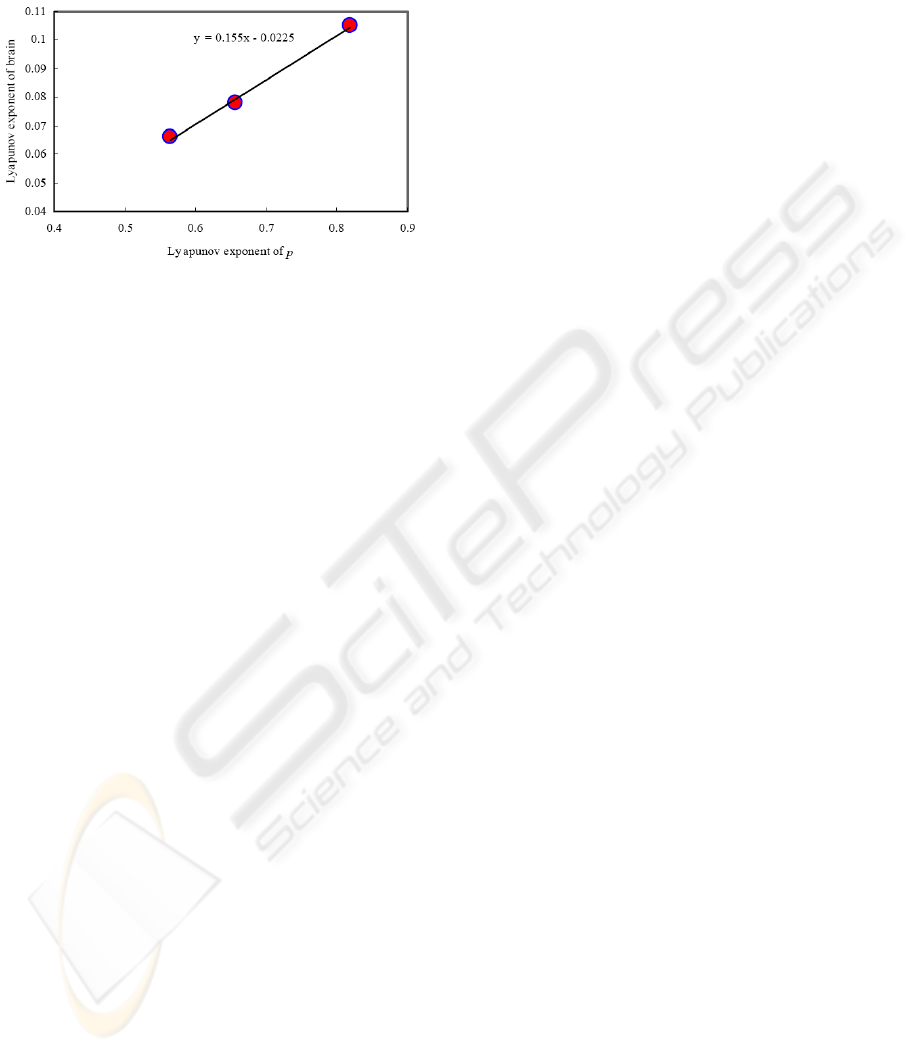
characterized by changing Lyapunov exponents.
The largest Lyapunov exponents of (19) were
λ
1
=0.066, 0.105, 0.078, corresponding to three
parameters of B. Putting these parameters into the
model, we obtained time series of blood pressure p.
The largest Lyapunov exponent was then computed
using Sano and Sawada algorithm (Sano and
Sawada, 1985). Fig. 5 plotted these results, showing
a well linear relationship between the largest
Lyapunov exponents of higher cerebral center and
ones of blood pressure p.
This relation shown in Fig.5 explains
theoretically the causes for an increase in chaos of
finger plethysmogram come from higher Lyapunov
exponent in higher cerebral center. In other words,
there is higher information processing in central
nervous system, leading to increasing complexity of
finger plethysmograms.
6 CONCLUSIONS
Chaotic dynamics in finger plethysmogram system
was studied in relation to anesthesia processes. The
largest Lyapunov exponent of the plethysmograms
was found to be significant and can be used to
characterize the changed in mental/physical status
for the experimental processes. There were lower
values o f Lyapunov exponents, indicating a blocked
or depressed effect of anesthesia on central neural
system. We found there a further smaller values
estimated during the laparotomy and change O2 to
50%, showing the effect of cam down on mental
status. Whereas there was a highly Lyapunov
exponent in recovery consciousness from anesthesia,
even higher than the period of time before
preparation of the surgery.
To understand how the chaos arises and to explain
the changes in the Lyapunov exponent in finger
plethysmograms in experiments, a mathematical
model consisting of baroreflex feedback and
autonomous interactions was proposed and studied
numerically. By using of the model, the decrease of
the largest Lyapunov exponent in plethysmograms
was explained in relation to the decreased chaoticity,
and hence the depressed or blocked central nervous
ACT4SOC-EHST 2009 - 4th International Conference on Software and Data Technologies
404
system in higher cerebral region. Highly arising
values of Lyapunov exponent was theoretically
explained as caused from excitations in activities
underlying central nervous system.
Figure 5: A plot of the largest Lyapunov exponent of
blood pressure with respect to one of higher cerebral
center.
ACKNOWLEDGEMENTS
We would like to deeply thank Dr. Maho Imoto,
Rakuwakai Otowa Hospital, who provided with useful and
helpful assistance during the experiments.
REFERENCES
Sumida, T., Y. Arimitu, T. Tahara, and H. Iwanaga,
"Mental conditions reflected by the chaos of pulsation
in capillary vessels", Int J Bifurcation and Chaos,
Vol.10, 2245-2255, 2000.
Miao, T., T. Shimizu, and O. Shimoyama, "The use of
chaotic dynamics in finger photoplethysmography to
monitoring driver mental workload", JSAE Annual
Congress, Japan, No.18-03, 2003a.
Oyama-Higa, O. and T. Miao, "Representation of a
physiopsychological index through constellation
graphs", Lecture Notes in Computer Science,
Springer-Verlag GmbH. Vol.3610, 811, 2005.
Miao, T., G. Higashida, W. Miyazaki, H. Asaoka,
"Prognosis for drug treatment based on chaotic
dynamics of human finger photoplethysmograms", Jpn
J Appl Physiol, Vol.33, 183-189, 2003b.
Sano, M. and Y. Sawada (1985). Measurement of the
Lyapunov spectrum from a chaotic time series, Phys
Rev Lett, Vol.55, p1082
Miao, T., O. Shimoyama, and M. Oyama-Higa (2006).
Modelling plethysmogram dynamics based on
baroreflex under higher cerebral influences, IEEE
International Conference on Systems, Man, and
Cybernetics, Oct.8-11, 2006 Taiwan, p.2885-2890.
Liu, J. (2003). Establishment of finger microcirculation
volume blood flow model and estimation of model
parameters, J Beijing Institute Civil Eng. and
Architecture, Vol.20, p45-51
Bergey, G. K and P. J. Franaszczuk (2001). Epileptic
seizures are characterized by changing signal comple-
xity, Clinical Neurophysiology, Vol.112, p241-249.
Korn, H. and P. Faure (2003). Is there chaos in the brain?
II. Experimental evidence and related models, C R
Biologies, Vol.326, 787-840.
Kotani, K., Z. R. Struzik, K. Takamasu, H. E. Stanley, and
Y. Yamamoto (2005). Model for complex heart rate
dynamics in health and diseases, Phys Rev E, Vol.72,
p041904
EFFECT OF ANESTHESIA ON CHAOTIC DYNAMICS IN FINGER PLETHYSMOGRAMS
405
