
APPLICATION OF CUSP SURFACE ANALYSIS USING WEB
APPLICATION TO VISUAL PERCEPTION
Yasufumi Kume
Department of Mechanical Engineerng, Kinki University, Japan
Keywords: Catastrophe theory, Server and client, Cusp surface analysis, Web application.
Abstract: Cusp surface analysis system is constructed to examine the effectiveness of the program of cusp surface
analysis by web server. According to operating on web server of cusp surface analysis, client can easily use
a cusp surface analysis program without preparing for an analysis program or system environment etc. This
paper examines the relationship of 'kinds of ambiguous figures', 'levels of detail figures ' and ' human visual
perception ' using 315 kinds of fisher's ambiguous figures. Fisher introduced ambiguous man/girl figure. An
array of 315 ambiguous man/girl figures has 21 steps of column from a man's face to girl's shape and has 15
row levels of detail. The experimental data are applied to cusp surface analysis. Summing up this paper, (1)
as the cusp surface analysis can be opened to the public on the web server, the clients input URL he or she
can perform the cusp surface analysis. (2) As the results of the experiments, the cusp catastrophe
phenomenon occurs as kinds of the ambiguous figures and the levels of detail figures in human visual
perception.
1 INTROUCTION
The catastrophe theory is applied to many fields
such as behavioral science, psychology, physics,
biology etc. French mathematician Rene Thom
classifies the elementary catastrophe of seven types
in catastrophe theory (Thom, 1975). The cusp model
with two control factors is frequently applied to
discontinuous phenomenon. Furthermore, Loren
Cobb proposed the cusp surface analysis. A cusp
surface is a statistical response surface model, based
on the cusp model of catastrophe theory
(Cobb,1998). Conventional cusp surface analysis
performed with a stand-alone computer. But, in this
paper, cusp surface analysis system is constructed to
examine the effectiveness of the program by
webserver (Kume, Morita,2006). Figure1 shows
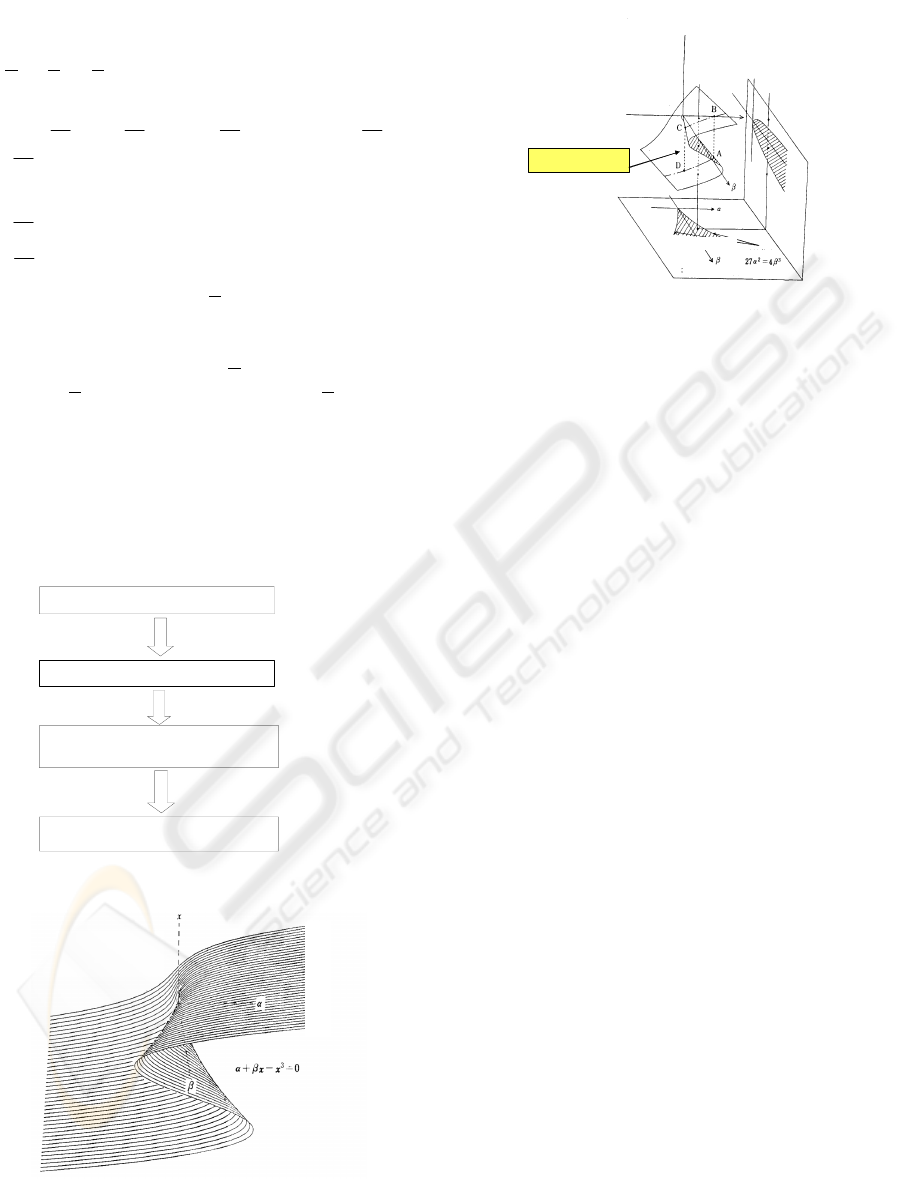
transition of research for cusp model. Figure 2and
Figure 3shows 3D cusp catastrophe model and cusp
surface.
According to operating on web server of cusp
surface analysis, client can easily use a cusp surface
analysis program without preparing for an analysis
program or the system environment etc. This paper
examines the relationship of ‘kinds of ambiguous
figures’, ‘levels of detail figures’ and ‘human visual
perception’ using 315 kinds of ambiguous figures.
Fisher introduced ambiguous man/girl figure, and
Attneave made 8 figures by embedding the figure in
the sequence, and Tim Poston and Ian Stewart made
32 figures. 315 kinds of ambiguous figures by
interpolation of figure of Tim Poston and Ian
Stewart figure are made by Atsuo Murata etc
(Murata, Kume and Hashimoto, 1984). An array of
315 ambiguous man/girl figures has 21 steps of
column from a man’s face to girl’s shape, and has 15
row levels of detail. The experimental data are
applied to cusp surface analysis
2 CATASTROPHE THEORY AND
CUSP SURFACE ANALYSIS
In cusp surface analysis(Cobb,1998), it is assumed
that the variable expressed with X
1,
X
2
, ・・・,X
ν
exists in relation to parameter A(X),B(X),C(X). The
formula is changeable into the cusp catastrophe
model is used. Catastrophe theory is proposed by
Rene Thom in French mathematician as
mathematical method described development of
configuration in nature (Thom, 1975). Figure 3 and
Figure 4 show 3D cusp catastrophe model and cusp
surface. In cusp surface analysis, it is assumed that
251
Kume Y. (2009).
APPLICATION OF CUSP SURFACE ANALYSIS USING WEB APPLICATION TO VISUAL PERCEPTION.
In Proceedings of the International Conference on Knowledge Management and Information Sharing, pages 251-257
DOI: 10.5220/0002267602510257
Copyright
c
SciTePress
the independent variable expressed with X
1,
X
2
, ・・・,X
ν
exists in relation to parameter
A(X
),B(X),C(X). Then formula is changeable into the
form of the following formula.
() () ()
[]
(
)
[]
3
0 XCYDXCYXBXA −−−+=
()
vv
XAXAXAAXA ++++= ……
22110
(1
)
()
vv
XBXBXBBXB ++++= ……
22110
()
vv
XCXCXCCXC ++++= ……
22110
,where D is a constant, and X is independent variable
vector, three control factors are scalar values and
predicted value Y is decided, then ν is number of
independent variables. A (X
) is unsymmetrical
factor, B (X
) is bifurcation factor and C (X) is linear
factor. In parameter estimating, most likelihood
method is used. Statistical testing which is satisfied
criterion of catastrophe model is not single. Three
criterions are proposed by Cobb. This prediction
equation is a cubic polynomial in Y which means
that for each values of X there are either one or three
predicted values of Y.
Cobb’s stochastic catastrophe model 2D
3D representation of Cobb’s stochastic
catast ro phe mode l
Thom’s catastrophe qualitative model
Quantitative
3D represe ntation
Opening cusp surfa ce progra m o n web
Sever and client system
Thom.R
1975
Loren.C
1978
Kume.Y
2004
Kume.Y
2006
Figure 1: Transition of research for cusp mode.
Figure 2: Thom’s cusp model.
x St ate vari able
α Normal factor
β Splitting factor
Bifurcation set
Cusp Surface
Figure 3: 3D cusp models.
3 CUSP SURFACE ANALYSIS
SYSETM
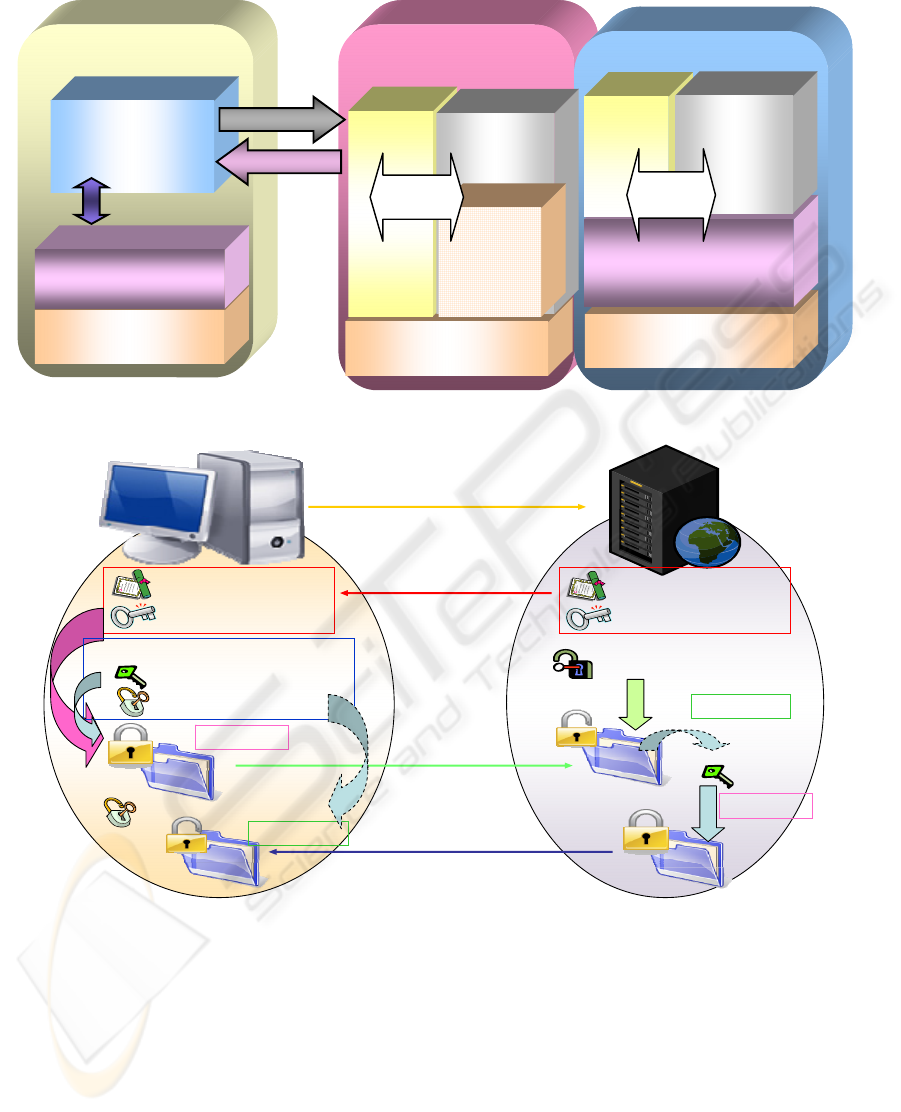
The cusp surface analysis system as shown in Figure
4 is a system performing calculation in the cusp
surface analysis on a web server from cooperation of
Linux, Apache, Tomcat, PostgreSQL and Java.
Apache of web server software is installed in the
web server. In addition, Tomcat of the web server
software is carried to treat Java servlet and Java
Server Pages(JSP). Tomcat is done plug-in into
Apache. Tomcat independently plays a role of the
web server. But the reason of the plug-in is the
improvement of the processing performance and the
problem of security etc. If the client has web
browser and Java, client can use the cusp surface
analysis program on the web server. The giving and
receiving of the web server is performed in protocol
called the HTTP (Hyper Text Transfer Protocol).
The client request “the cusp surface analysis
program” as HTTP, and the web server response the
service of “the cusp surface analysis program” as
HTTP. Web browser on the client provides service
for the client as HTML(Hyper Text Markup
Language). Web browser plays a role to change
HTTP gotten from web server into HTML. The cusp
surface analysis system is available that the client
can save data to both database and local directory.
And saved data from both web server and local
directory are also able to open. Internet
Explorer(I.E) is started to start cusp surface analysis
program, and following URL is input.
https://163.51.55.140/cusp2008-DB/cuspmain.html
If the main screen of the cusp surface analysis
program is executed by input URL, the system
performs normally. If the main screen of the cusp
surface analysis program is executed, the system
KMIS 2009 - International Conference on Knowledge Management and Information Sharing
252
JRE
Web browser
C:\Cusp Test\data.txt
Read, Save
Client Container
Request
Response
Red Hat Enterprise
Linux 5
Fedora 8
JRE
JRE
Apache
Tomcat
(Servlet
Container)
webapps
Cusp
Surface
Analysis
program
JK
Connector
Apache
Tomcat
(Servlet
Container)
J
K
2
Connector
PostgreSQL
Client(Windows) Web server(Linux) Database(Linux)
Figure 4: Structure of client, Web server and Database server.
Server Certificate
Server Public-key
Server Secret-key
Server Certificate
Server Public-key
make a client key
Client Public-key
Client Secret-key
Encrypt
Decrypt
Encrypt
Client Secret-key
Decrypt
Client Public-key
①
②
③
④
⑤
⑥
⑦
⑧
⑨
Figure 5: Structure of SSL.
performs normally.Cusp surface analysis system
uses SSL (Secure Sockets Layer) of a cryptographic
system as shown in Figure 5 that uses two keys to
encrypt data. The client and the server use the
public-key and secret-key to encrypt and decrypt the
data they send to each other and to secure the safety
of the data.
4 APPLICATION OF CUSP
SURFACE ANALYSIS SYSTEM
TO EXPERIMENT RESULT
This experiment shows the relationship among 21
kinds ambiguous figures which changes from man's
face to woman's shape, 15 levels detail figures, and
visual Figures size used in this experiment is
2.2×4.0cm. In the kind of the ambiguous figures, man's
face is A① and woman's shape is U①. Among 15
APPLICATION OF CUSP SURFACE ANALYSIS USING WEB APPLICATION TO VISUAL PERCEPTION
253

Experiment
1.5m
Man’s face?
Woman’s shape?
22cm
30cm
Visual perception degree(Y)
Y=0.0:Man’s face
Y=0.5: Yes and no
Y=1.0: Woman’s shape
Figure 6: Experimental methods.
X
1
1 6 11 16 21
K①
F① P①
U①
Woman’s shape
A①
Man’s face
•
X
1
let 21 kinds of ambiguous figures from A to U
support a number from A① sequentially.
Kinds of ambiguous
figures
The size of figure:4.0× 2.2cm
Figure 7: In the case of level ①of detail figures, 21 kinds of ambiguous figures.
Levels of detail
figures
A① A③ A⑦ A⑪ A⑮
Clearness
Indistinct
X
2
13 7 1115
•
X
2
let levels of detail figures from ① to ⑮
support a number from A ① sequentially.
The size of figure:4.0× 2.2cm
Figure 8: In the case of the kind A of ambiguous figures, ⑮ levels of detail figures.
levels of detail figure, level① is most detail figure
and most indistinct figure is level⑮. Two figures
past on the upper section of a black board so that the
subject can judge easily. Two figures are the highest
probability to be seen by man's face and woman's
shape.
In this experiment as shown in Figure 4, subjects
are shown at random 21 figures per one subject. And
the 315 data are taken from 15 subjects of 20's.
Visual perception change points are set as following:
KMIS 2009 - International Conference on Knowledge Management and Information Sharing
254

Case
X
1
X
2
Y
Case
X
1
X
2
Y
Case
X
1
X
2
Y
1 6 4 1 106 8 10 1 211 16 9 1
2 2 4 0 107 17 8 1 212 11 3 0
3 3 4 0 108 9 14 1 213 19 9 1
41380.51097150.5214990
5 2 10 0. 5 110 14 10 0. 5 215 16 3 1
68120111781216550
714411122080217350
8196111314120.5218330
974111410140.5219210
10 1 13 0. 5 115 17 10 1 220 14 5 1
11214111610100.5221430
Table 1: The results of 21 kinds ambiguous figures, 15 levels detail figures, and visual perception (Case1~Case315)
Experimental data (21×15=315).
X
1
: Kinds of the ambiguous figures, X
2
: Levels of detail figures, Y:Visual perception.
96 18 12 1 201 15 7 0 306 8 7 0
97 9 13 1 202 4 9 0 307 10 9 1
98 1 2 0 203 6 9 0 30 8 9 1 1
99 5 8 0.5 204 21 9 0. 5 30 9 17 9 1
100 13 4 1 205 3 1 0 310 17 3 1
101 14 2 1 206 20 7 0.5 31 1 20 11 1
102 1 10 0.5 207 9 5 0 312 13 1 1
103 7 6 0 208 7 11 0 313 2 11 0
104 7 14 0.5 209 1 11 0 31 4 2 9 0
105 2 13 0.5 210 20 1 0.5 315 19 3 1
subject answers Man's face- (0.0), Yes and no-
(0.5), and subject answers woman's shape- (1.0).
The subjects are shown 1.5 meter far from figure.
Since back ground colors may influence subject's
judgment, 22×30cm black board is pasted on the
back of each figure. This getting data are used for a
cusp surface analysis.
In analysis, linear regression model’s parameter is
presumed. Linear model’s is estimated by the least
squqre method. The correlation coefficient is
obtained from data. In the result, correlation matrix
is obtained. And square multiple correlation
coefficient is obtained. Log liklihoooood of linear
regression model can be obtained from linear square
multiple correlation coefficien .This is the initial
values used by the maximum likelihood method
when it begins its iterative search for the best f itting
coefficient for the catastrophe model.
5 ANALYTICAL RESULT
This is the initial values used by the maximum
likelihood method when it begins its iterative
search for the best fitting coefficients for the
catastrophe model. The maximum of log likelihood
can be obtained by the Newton-Raphson method .
In the result of estimating parameter from data of
experiment results, it is shown in Table 2 as
follows.
Table 2: Standard partial regression coefficient.
Var
A
ν
B
ν
C
ν
D
Const -0.11 7.113 0.097 6.591
1 0.673 -0.753 -0.014
2 -0.105 -3.006 -0.018
…
…
…
APPLICATION OF CUSP SURFACE ANALYSIS USING WEB APPLICATION TO VISUAL PERCEPTION
255
X
1
: Kinds of the ambiguous figures, X
2
: Levels of detail figures, Y:Visual perception
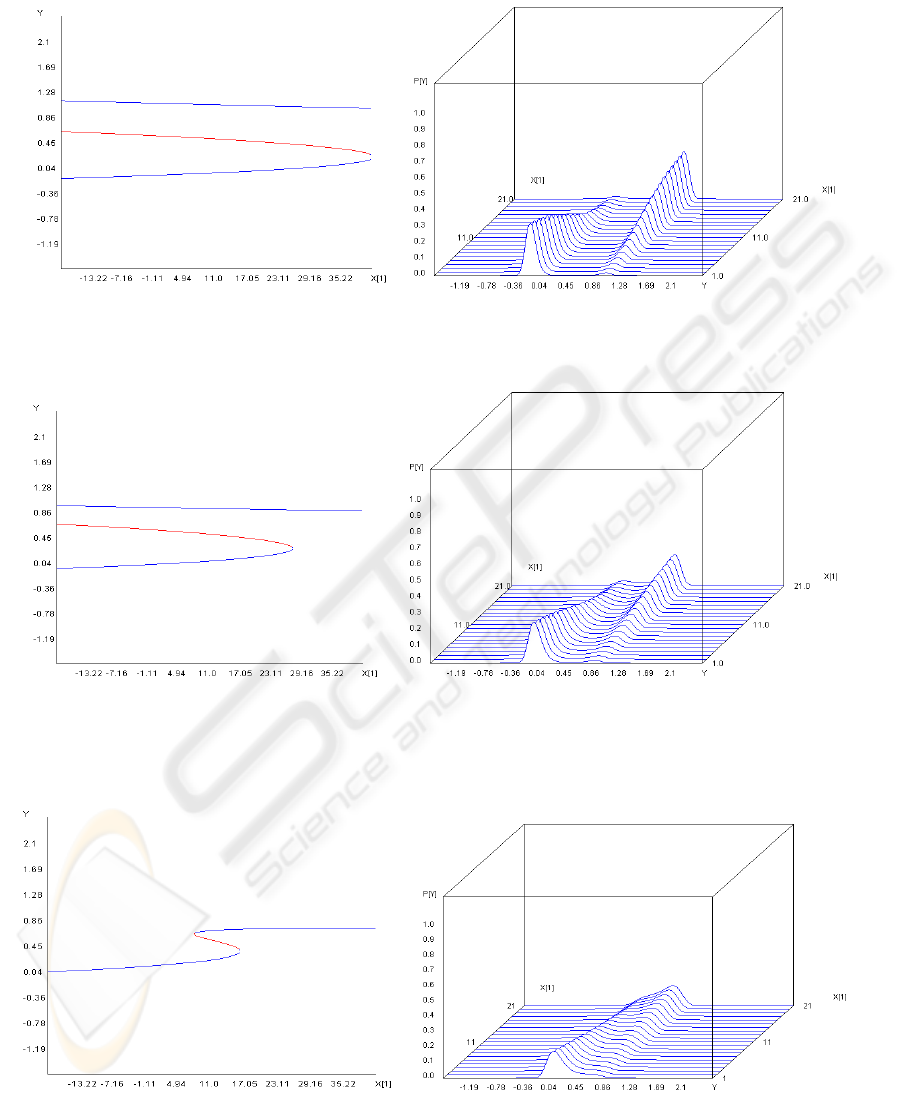
Figure 9: Visual perception by kinds of ambiguous figures in the case of the level ① of detail figures. And the probability
density function 3D figure according to kinds of ambiguous figures and visual perception in the case of the level ① of
detail figures.
Figure 10: Visual perception by kinds of ambiguous figures in the case of the level ⑧ of detail figures. And the probability
density function 3D figure according to kinds of ambiguous figures and visual perception in the case of the level ⑧ of
detail figures.
Figure 11: Visual perception by kind of the ambiguous figure in the case of the level of detail figures. And the probability
density function 3D figure according to kinds of ambiguous figures and visual perception in the case of the level of detail.
A
B
C
D
B
’
KMIS 2009 - International Conference on Knowledge Management and Information Sharing
256
() ()
(
)
[]
(
)
[]
3
591.60 XCYXCYXBXA −−−+=
()
()
()
21
21
21
018.0014.0097.0
006.3753.0113.7
105.0673.011.0
XXXC
XXXB
XXXA
−−=
−−=
−+−=
In figure 11 visual perception dramatically changes
A→B→C→D from man's face to woman's shape.
Thus, when the level of detail figures is ⑮, visual
perception is suddenly changed at near Q⑮ (X
1
=17)
of ambiguous figures. The cusp catastrophe
phenomenon occurs as kinds of ambiguous figures
and levels of detail figures in human visual
perception.
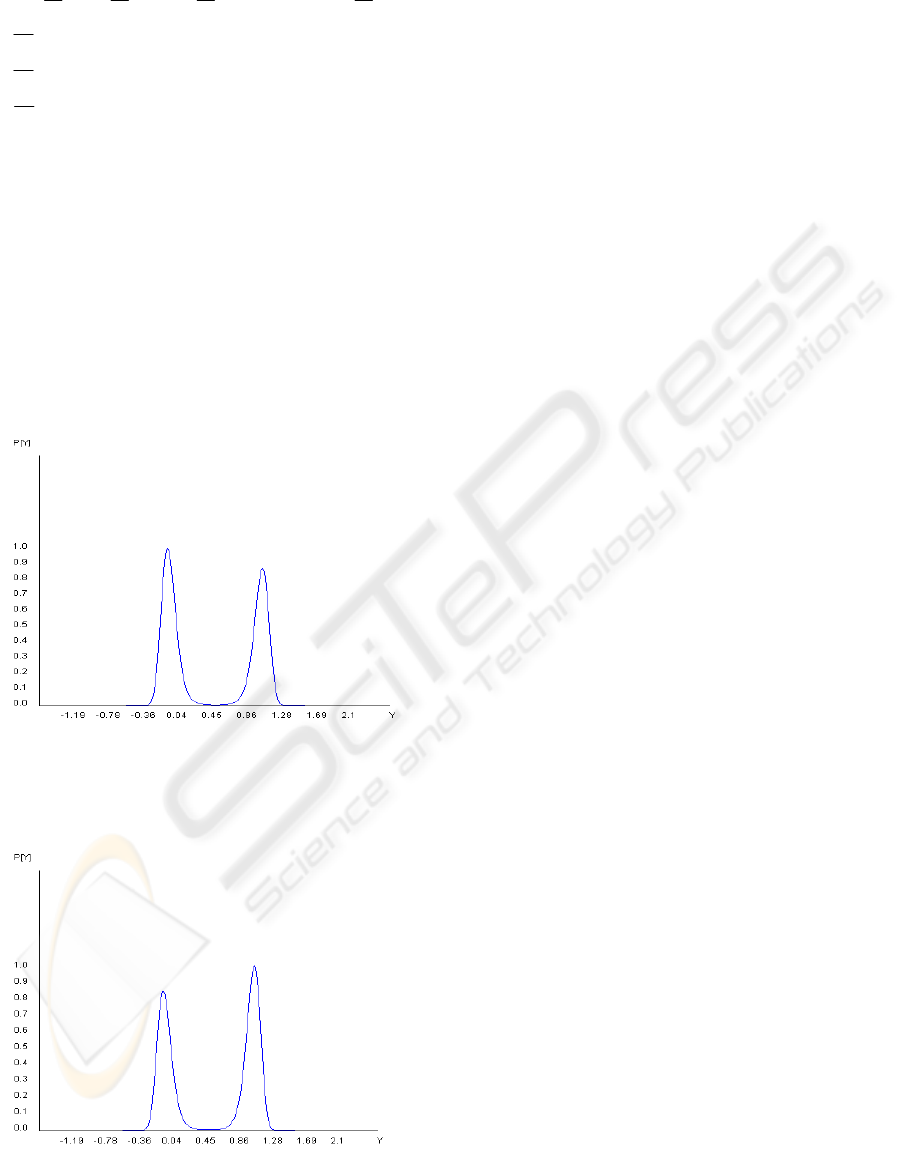
The figure of equal probability is Fisher's figure
of K①. But the experiment test result shows that the
ambiguous figure to have equal probability exist
between J① and K① in this case.
Figure 12: Probability density function of ambiguous
figure J in level① of detail figures. Figure 10 and 11 show
the probability density function that the variety of
ambiguous figures at the level ① of detail figures.
Figure 13: Probability density function of ambiguous
figure K in level ① of detail figures.
6 CONCLUSIONS
(1) As the cusp surface analysis can be opened to the
public on the web server, the clients input URL he or
she can perform the cusp surface analysis.
(2) It is clarified that the data in local PC and
database server are loaded and saved by cusp surface
analysis program. However, when the client
transfers data of 73 rows or more from database
server to local PC, the cusp surface analysis system
cannot be executed normally. Also, when the data
saved into the database server are 365 rows or more,
‘S.Read’ button cannot be executed.
(3) The data transmission of the cusp surface
analysis program is encrypted for security by SSL
and communicates with web server.
(4) As the results of the experiments, the cusp
catastrophe phenomenon occurs as kinds of the
ambiguous figures and the levels of detail figures in
human visual perception.
REFERENCES
Cobb, L., 1998. An Introduction to Cusp Surface Analysis.
http://www.aetheling.com/models/cusp/Intro.htm
Kume, Y., Morita,Y., 2006.Construction of Web
Application for Cusp Surface Analysis, J. school Sci.
Eng. Kinki Univ.42 , pp.45-51(in Japanese).
Murata, A., Kume, Y. and Hashimoto,F., 1984. Cusp
Catastrophe Phenomenon in Visual Organic Functions,
Japan Industrial Management Association ,Vol. 35,
No.3, pp.150-155(in Japan).
Thom, R., 1975. Structural stability and morphogenesis,
New York:Benjamin-Addison Wesley.
APPLICATION OF CUSP SURFACE ANALYSIS USING WEB APPLICATION TO VISUAL PERCEPTION
257
