
EXTENDED ANALYSIS TECHNIQUES
FOR A COMPREHENSIVE BUSINESS PROCESS OPTIMIZATION
Sylvia Radesch¨utz and Bernhard Mitschang
Institute of Parallel and Distributed Systems, Universit¨at Stuttgart, Germany
Keywords:
Business Intelligence, Business Process Optimization, Business Data Integration.
Abstract:
Efficient adaption of a company’s business and its business processes to a changing environment is a crucial
ability to survive in today’s dynamic world. For optimizing business processes, a profound analysis of all
relevant business data in the company is necessary. We define an extended data warehouse approach that
integrates process-related data and operational business data. This extended data warehouse is used as the
underlying data source for extended OLAP and data mining analysis techniques for a comprehensive business
process optimization.
1 INTRODUCTION
Increasing competition and significantly shortened
product lifecycles have led to a situation where fast
adaption and continuousoptimization of business pro-
cesses are critical factors in determining the success
of a company (Weerawarana et al., 2005). Business
process optimizations aim to improve processes of an
organization by discovering and removing unneces-
sary activities and replacing them by more efficient
ones. For these process optimizations, companies
typically rely on process analysis like monitoring and
process mining. Data of operational business appli-
cations is analyzed separately via OLAP (Online An-
alytical Processing) and data mining in a data ware-
house. However, these methods usually fall short
when it comes to dealing with questions requiring
an integrated view on both process and operational
data when they both refer to the same real-world ob-
ject. In the example of a car rental company look-
ing to optimize its rental processes, a highly relevant
question to a business analyst would be how trainings
and work experience affect the execution time as well
as the success of the process. Answering this ques-
tion requires both process data (execution data, paths
taken) as well as operational data (work experience,
trainings, demographics) relating to the employee ex-
ecuting the process. In such a situation, an integrated
global analysis tool would make a valuable contribu-
tion by ensuring that all relevant data is taken into ac-
count. We call this approach Business Impact Analy-
sis (BIA).
In this paper, we introduce new methods for ana-
lyzing process data and operational data of a busi-
ness together. We briefly sketch different analysis ap-
proaches in the following section. Section 3 shows
an integrated BIA-schema. This schema allows to
perform global OLAP and mining strategies for BIA
which are presented afterwards. Finally, we close the
paper with a conclusion.
2 RELATED WORK
Pure process analysis is based on audit trails that store
the execution data of processes. An audit trail is
needed for analyses like Business Activity Monitor-
ing (BAM) (McCoy, 2002) to react to problems that
arise during process enactment using tools like Ora-
cle BAM (Oracle, a). Audit trails can be integrated
into an audit warehouse by ETL (Extract-Transform-
Load). On the audit warehouse, analyses for busi-
ness performance management (Sayal et al., 2002)
(Bruckner et al., 2002) or process mining techniques
(Agrawal et al., 1998) (Rubin et al., 2007) allow to
optimize workflows. But all these techniques refer
especially to the actual flow logic. Operational data
sources are typically neglected.
Operational data comprises all data processed
within the business that is not stored into a workflow
management system, but somewhere else as in files,
77
Radeschütz S. and Mitschang B. (2009).
EXTENDED ANALYSIS TECHNIQUES FOR A COMPREHENSIVE BUSINESS PROCESS OPTIMIZATION.
In Proceedings of the International Conference on Knowledge Management and Information Sharing, pages 77-82
DOI: 10.5220/0002269000770082
Copyright
c
SciTePress
or data managed by other systems, e.g. by a database
management system. It contains information that is
ingested by ETL into a data warehouse for data analy-
ses such as OLAP or data mining (Han, 2005). OLAP
systems (such as IBM Alphablox of the IBM Info-
sphere Warehouse (IBM, a)) allow analytical multi-
dimensional queries and data mining is the process
of automatically searching large volumes of data for
patterns using methods such as classification (see e.g.
Microsoft Analysis Services (Microsoft, a)).
In the area of a global analysis of both work-
flow and operational data there’s not much related
work so far. The Process Data Warehouse in (Casati
et al., 2007) provides a warehouse model for a global
analysis. However, in contrast to our BIA-schema
it focuses on the process dimensions and the opera-
tional dimension isn’t addressed in detail. The PISA
tool (zur Muehlen, 2004) considers process variables
only, but no further operational dimensions. Further-
more, it offers only relatively simple analyses. Nei-
ther of these two approaches support global mining
techniques or OLAP operators as considered in BIA.
3 EXAMPLE SCENARIO
This section introduces the business data of a car
rental company. We use this scenario to demonstrate
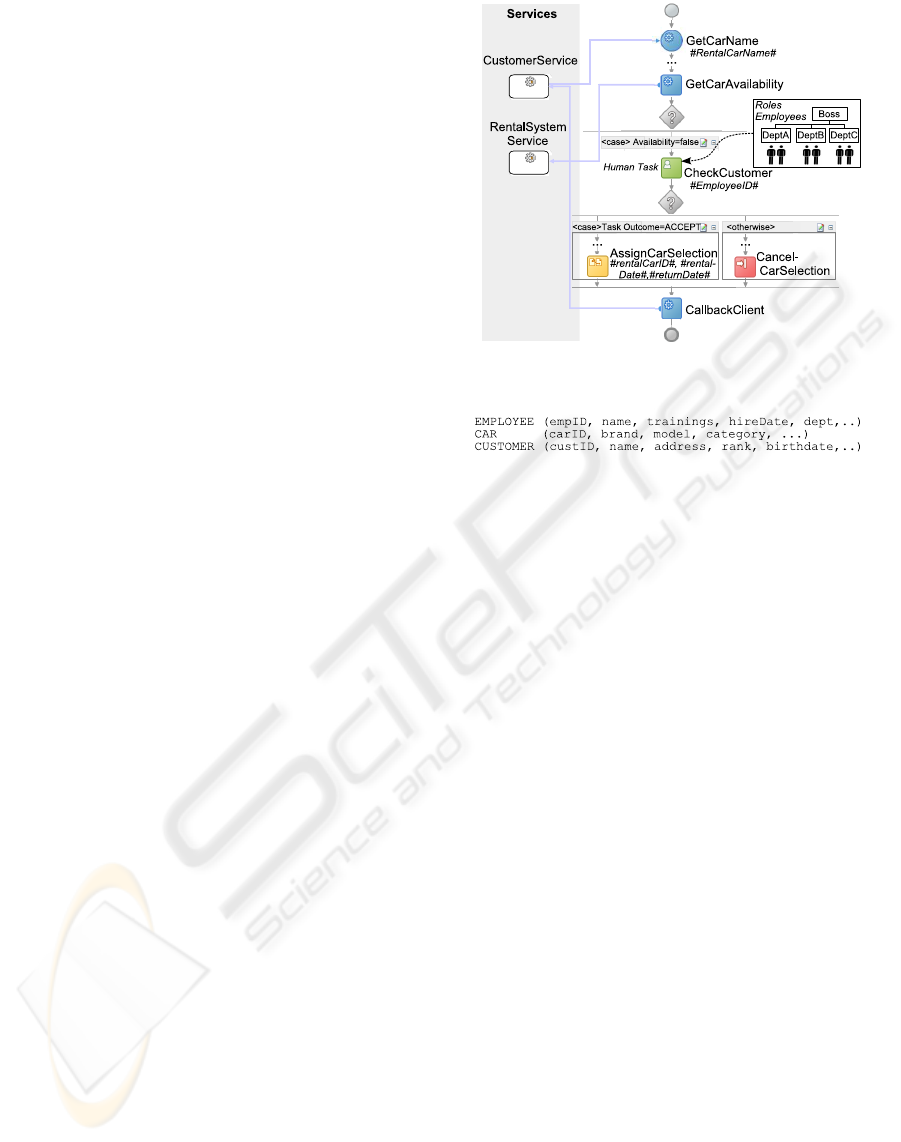
our analysis methods in the following sections. Fig.1
shows parts of our BPEL sample process that is mod-
eled and visualized using Oracle JDeveloper (Oracle,
b). The process is part of a car rental service and de-
scribes the selection of a rental car. If no car is avail-
able during the ordered rental period, an employee
must execute a human task activity
CheckCustomer
to prove if the customer would also accept another car
model. This human task isn’t assigned directly to one
employee, but to one of the available roles. In our ex-
ample,
CheckCustomer
can be claimed and executed
by all agents from departments A, B or C. All process
variables are marked in Fig.1 by hash marks #.
All operational car rental data sources in the com-
pany are loaded into a data warehouse. That in-
cludes data about employees, their names, but also
their trainings and so on as in the schemas in Fig.2.
Via OLAP and mining we want to investigate on what
terms the process can be optimized taking operational
data into account.
4 BIA-OLAP
OLAP is an approach to quickly answer multidimen-
sional analytical queries. In the core of any OLAP
Figure 1: Car Rental Process.
Figure 2: Operational Data Examples.
system is a concept of an OLAP cube. Our BIA-Cube
is presented here. It is based on metrics discussed in
the next section. Afterwards, a new OLAP function
for BIA is introduced and applied to some example
queries.
4.1 Analysis Metrics
The analysis metrics for BIA can be classified along
the following categories:
• Process Metrics. These metrics are based on pro-
cess data, e.g. duration between activation and
completion of activities or time intervals between
the completion of a task and start of another one.
• Resource Metrics. These metrics consider e.g.
performance measurements of human and auto-
mated resources in executing tasks.
• Business Object Metrics. They comprise all
business data values that are used in the workflow.
• Operational Metrics. They consider further op-
erational data values related to business objects or
resources of an activity and that are stored some-
where else in the company, but not in the audit
trail of the workflows.
If we assign these metrics to the three types of
analyses that we discussed in Section 2, we can
clearly see that only the BIA approach exploits all the
four analysis metrics from above. This is depicted in
Table 1.
KMIS 2009 - International Conference on Knowledge Management and Information Sharing
78
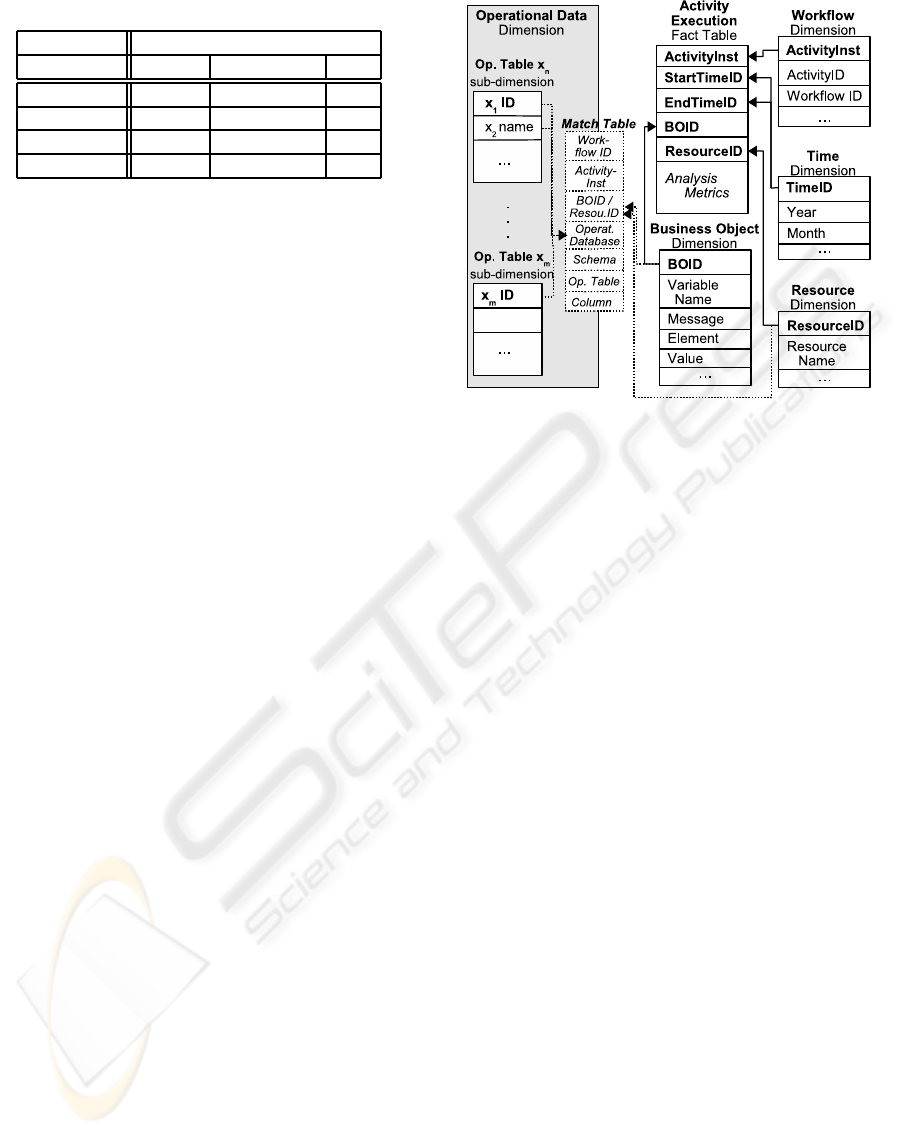
Table 1: Analysis Metrics.
Types of Analyses
Metrics Process Operat. Data BIA
Process + - +
Resource + - +
Bus. Object + - +
Operational - + +
4.2 BIA-Cube
An OLAP cube consists of numeric facts which are
categorized by dimensions. Fig.3 shows our BIA-
Cube that we developed for business impact analysis.
The cube is very general as it should be applicable
to different situations, i.e. to different business pro-
cesses and operational data models. The figure shows
the most significant elements. The measures in the
fact table consist of the analysis metrics discussed be-
fore.
The references to activity instances, resources,
time and business objects access four evaluation di-
mensions. The workflow dimension stores the data
about an activity, its workflow ID and further activ-
ity specific details, i.e. its name, deployed version,
etc. In the time dimension start and end time of an
executed activity are stored and expanded in smaller
time units as days, months, years and so on. The re-
source dimension stores information about employ-
ees, machines or engines that executed an activity. In
the business object dimension the workflow variables
are listed. As each variable in an activity may have a
different depth in their XML structure, the cube isn’t
modelled using these variablesas dimension keys. We
use an artificial BOID.
In contrast to other OLAP cubes, the BIA-cube
adds an operational dimension consisting of a chang-
ing amount of sub-dimensions. It adds information
from other applications in the company to the re-
source and business object dimension. Thus, it can
have complex structures with many tables that may
change for every activity. The business objects of an
activity can reference the keys of the sub-dimensions,
e.g. x
1
in Fig.3, or a non-key column as x
2
. Addition-
ally, a resource might reference a sub-dimension x
m
.
For every activity and its variables, arbitrary opera-
tional sub-dimensions can be added to the BIA-Cube
due to its generality and then used for analysis. Their
correlations are contained in the match table.
4.3 OLAP Function for BIA
For special BIA requirements it’s reasonable to have
an own OLAP support that goes beyond the usual
Figure 3: BIA-Cube.
OLAP SQL features as ROLLUP or WINDOW
(ISO/IEC 9075-2, 2003). As introduced in the
section before, the operational data dimension is
divided into sub-dimensions. In order to handle
these sub-dimensions efficiently within the queries
we propose a new OLAP operator: BIASUB. The
operator can be used to get a first overview of the
related operational attributes. While the next section
shows illustrating examples of BIASUB, this section
gives details of its syntax:
SELECT *
FROM BIASUB(<VAR>,<ACTIVITYID>,<TABLE>)
The SQL command selects all columns and their
values of the operational tables in the correlated
sub-dimensions for the specified variable in the
specified activity and fact table. It evaluates the
Match Table (see Fig.3) to find all necessary joins
between the operational dimension and the business
object or resource dimension. The output table
contains operational attributes, that may be needed
for getting new hypotheses for optimization hints.
In terms of SQL the BIASUB operation represents
a table expression that can be used in a query at all
places where an SQL table expression is permitted.
4.4 Example OLAP Analyses
In the following we use the BIA-Cube to create some
example queries for BIA. The first query figures out
which factors determine a successful execution of the
activity
CheckCustomer
. We assume that it is related
EXTENDED ANALYSIS TECHNIQUES FOR A COMPREHENSIVE BUSINESS PROCESS OPTIMIZATION
79
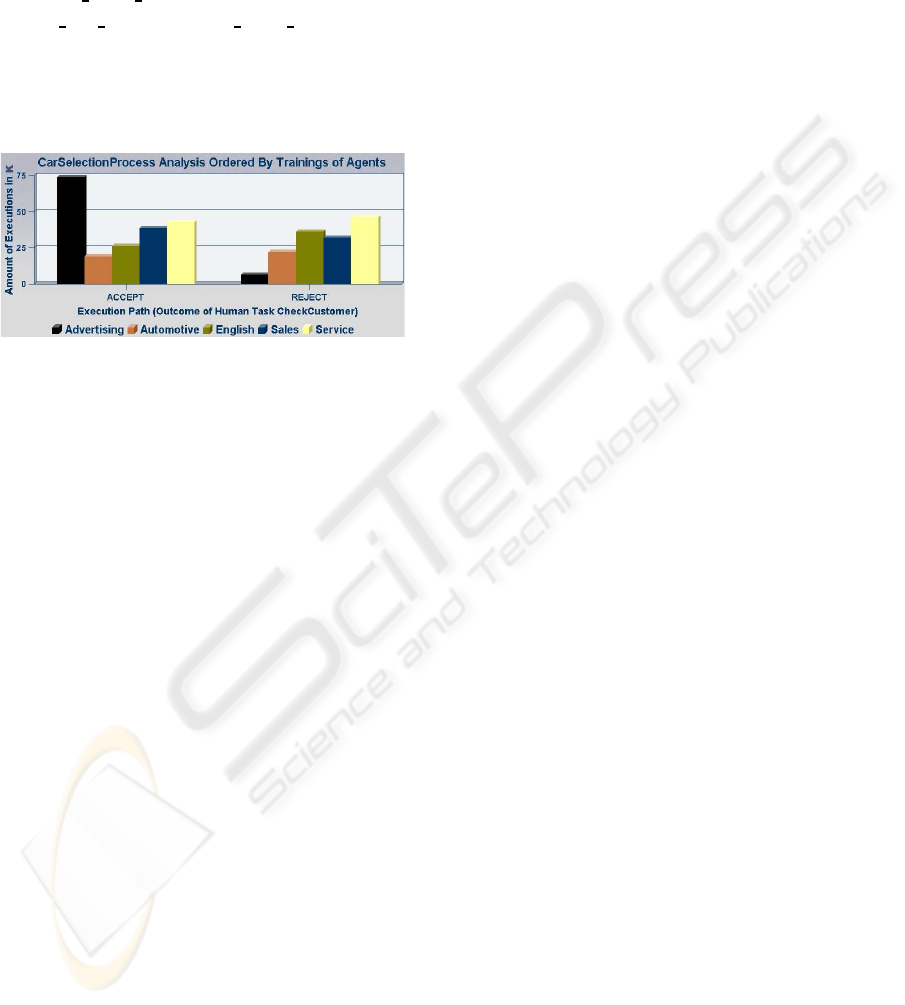
to the agent’s trainings. So we count the activity ex-
ecutions grouped by its outcome and the employee’s
trainings:
SELECT COUNT(*)
FROM BIASUB(EMPLOYEEID, CHECKCUSTOMER,
ACT EXEC TABLE) AS BIA,
B OBJ TABLE BO, ACT EXEC TABLE A
WHERE BIA.ACTIVITYINST = A.ACTIVITYINST
AND BO.BOID = A.BOID
AND BO.VARNAME = ”OUTCOME”
GROUP BY BIA.TRAINING, BO.VALUE
Figure 4: Result of Query.
The result of this query is depicted in Fig.4. This
result clearly shows that the majority of cases with
#outcome#=’accept’
are achieved by employees that
are trained for advertising and that in the least cases
this group of employees is responsible for a nega-
tive outcome, i.e.
#outcome#=’reject’
. As a resulting
measure of process optimization, the employee group
should be changed: Only agents that are skilled in ad-
vertising should be allowed to execute the task instead
of all employees from Dept A, B and C. This may lead
to a better process performance and company profit,
because less processes might be canceled.
Via another query we investigate the processing
time of activities. We discovered for instance, that
process instances with the activity
GetCarAvailability
and
#RentalCarName#=’AudiTT’
, are slower in their
processing time than other ones. The reason for the
car selection delay might be a high choice of extras,
e.g. direct shift gearbox S-Tronic and magnetic sus-
pension system, that needs a lot of callbacks to the
customer. For a process optimization we change the
process model and add an extra activity at the begin-
ning that asks for additional information from the cus-
tomer for the
’AudiTT’
selection.
A third query could help to simulate a changed
process execution, e.g. if we wouldopen an additional
car rental branch office. If we analyze customers’
rental behavior and choose an appropriate area we
could reduce the shortcomings of certain car models
and the detention period in certain process sections
for the selection of these cars.
5 BIA-MINING
In complementing BIA-OLAP, we define BIA-
Mining for extracting hidden optimization patterns
from the large audit trails and operational data. This
sections shows how the common mining techniques
clustering, classification, association and prediction
(all specified in detail e.g. in (Han, 2005)) are adapted
to the BIA approach. We are not interested here in the
specific algorithms to fulfill the mining, but how to
use the mining techniques for the BIA approach. The
analyses are based on the car rental scenario again.
5.1 BIA-Clustering
Grouping a set of related objects into certain classes
of objects that are similar to each other and dissimilar
to other classes is called clustering (Jain et al., 1999).
It can be used for data segmentation because it parti-
tions large data sets into groups, but also for outlier
detection. Outliers are objects whose values lay far
away from any cluster (Ceglar et al., 2007). The ma-
jor clustering algorithms can be classified into various
categories, that include e.g. statistical methods and
high-dimension clustering among many others. Sta-
tistical methods are separated again into hierarchical
algorithms that group successively data objects into a
tree of clusters and into partitioning algorithms that
just organize the objects in k partitions.
BIA-Clustering always has at least two major
clustering axes: process and operational data. Es-
pecially high-dimension clustering methods (Parsons
et al., 2004) are very interesting for BIA because of
the high number of sub-dimensions that result from
the changing number of variables in a process activity.
Fig.5, however, confines itself to clustering the execu-
tion time of activity instances of
GetCarAvailability
in relation to only one attribute
customer ranking
of
one sub-dimension
customer
. We gain three clusters
with the labels:
VIPService
,
FastService
,
VIPProb-
lemService
. BIA-Clustering is suited as a first anal-
ysis method to identify the activities that have prob-
lems and that must be further analyzed for optimiza-
tion. Here, the
VIPProblemService
cluster has to be
examined in detail to discover the delay reasons and
to reorganize the processes.
Outlier detection is also important for BIA. One
activity instance in Fig.5 doesn’t belong to any clus-
ter. Outliers can have many causes. The process
server may have suffered a transient malfunction and
didn’t store the correct execution time. There may
have been an error in data transmission. Alternatively,
an outlier could give important information, e.g. for
fraud detection within the customer ranking, calling
KMIS 2009 - International Conference on Knowledge Management and Information Sharing
80
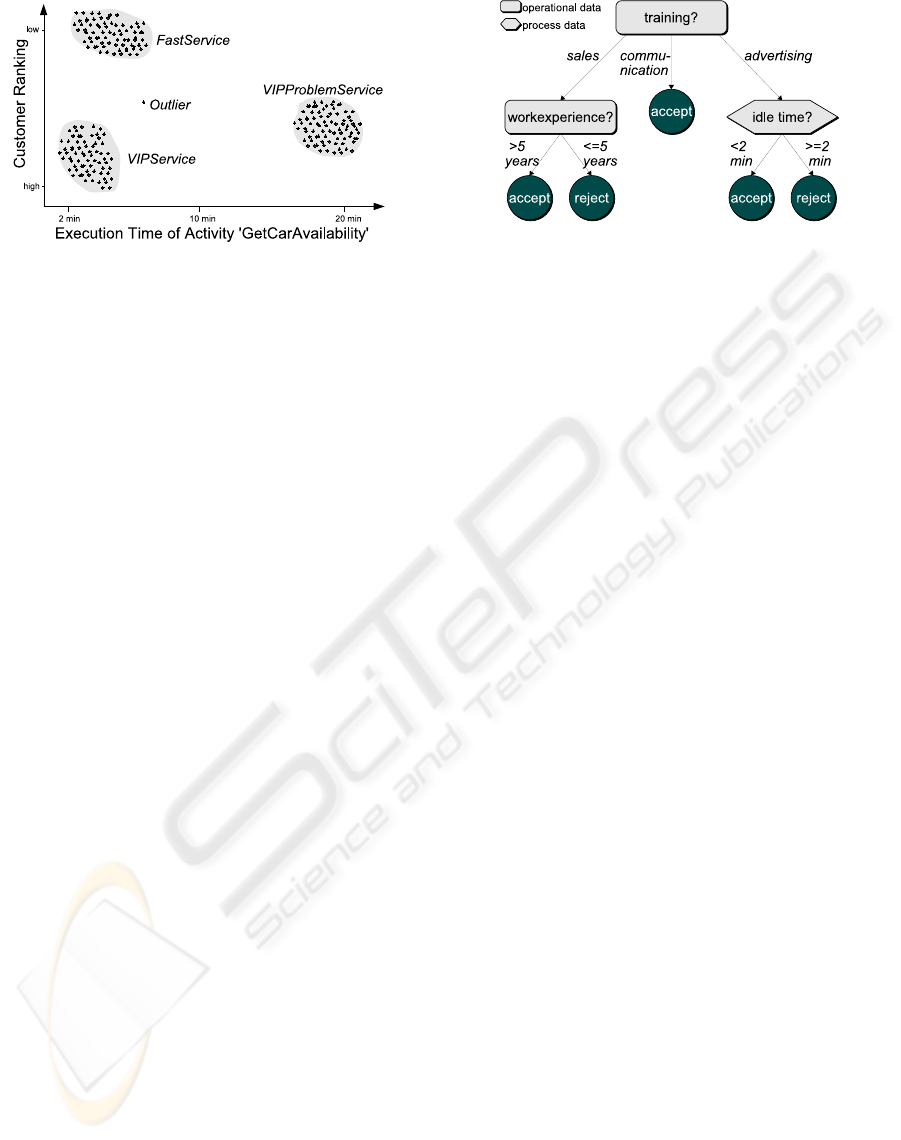
Figure 5: BIA-Clustering Example.
for further investigation.
5.2 BIA-Classification
Classification is a data analysis method that can be
used to extract models describing currently available
information in categories (Michie et al., 1994). This
model is created on training data sets. It helps to un-
derstand the data and to predict categorical labels. In
machine learning or pattern recognition many classifi-
cation methods have been developed that include e.g.
decision tree classifiers or Bayesian belief networks.
In BIA, classification is very helpful for categoriz-
ing processes. Fig.6 shows a decision tree induction
for the activity
CheckCustomer
and its class label at-
tribute
#outcome#
which has two distinct values
’ac-
cept’
and
’reject’
. The partition of the tuples depends
on process data and on operational data related to the
employee who executes the task. The attribute
train-
ing
has the highest information gain and becomes the
first splitting attribute. If the employee is trained in
’communication’
the activity is accepted at once. For
’sales’
training there’s an additional differentiation on
the
work experience
attribute (employed more or less
than 5 years). On the
’advertising’
side, we have a
second differentiation on
#idle time#
of the activity
(customer waiting for less or more than 2 minutes
until he gets an alternative offer). We can use this
technique to restructure the process model in order to
avoid rejected paths.
5.3 BIA-Prediction
Prediction is closely related to classification. While
classification has discrete results, prediction methods
predict continuous-valued functions, e.g. by regres-
sion (Uysal and G¨uvenir, 1999), a statistical method.
Regression models the relationship between predictor
variables and a response variable that is numeric.
For our application in BIA, we can predict e.g.
how long the execution of a process activity will last
Figure 6: BIA-Classification Example.
depending on numeric values of its variables and fur-
ther operational sub-dimensions. So we examine the
duration of the activities of finding an adequate car
and working out the contract, if a customer has ac-
cepted an alternative car in our scenario. The regres-
sion might show that the duration depends on the ages
of customer and employee and on the duration of the
customer’s license possession. A flexible allocation
of employees for these tasks considers this predicted
duration and reduces bottlenecks and long delays.
5.4 BIA-Association Rule Mining
Association rule mining is a popular method for dis-
covering interesting relationships between attributes
in large databases. Attributes that occur frequently
together in transactions are called frequent itemsets.
The task of this mining method is to find all frequent
itemsets, e.g. by the apriori algorithm (Agrawal and
Srikant, 1994), and use them to create association
rules. The association rule {A, B}⇒{C} indicates
that if A and B appear together, also C is likely to
appear in this transaction.
Association rules that consider both process vari-
ables and operational data may be necessary in BIA
for an efficient resource planning. Thus, the BIA-
rules are more complex than the one above, be-
cause we don’t consider only the activities in a pro-
cess, but examine also which business objects and
which operational data models together with their val-
ues play a role in the analyzed activities and lead
to the execution of other activities very likely. In
our example scenario we look at the activity
Get-
CarAvailability
that might be called for
#Rental-
CarName#=’CorvetteC6ZR1’
. From the car’s
cate-
gory=’sports’
obtained by its related operational data
follows that there is afterwards very likely an activity
SpecialBriefing
needed for the customers. In contrast,
a call of the activity with a value
’RenaultScenic’
needs a
CompleteInteriorCleaning
activity after re-
turn, as it is a
’family’
car. Based on these results the
rental company may provide always enough skilled
EXTENDED ANALYSIS TECHNIQUES FOR A COMPREHENSIVE BUSINESS PROCESS OPTIMIZATION
81

Figure 7: BIA Prototype.
enployees to guarantee a fast processing.
6 EXPERIENCE &
CONCLUSIONS
Fig.7 shows our prototype system that consists of
an integrated data warehouse system as well as ex-
tended BIA analysis and ETL facilities. These ex-
tended ETL facilities enable the integration of oper-
ational and process data based on their correlations
which are introduced in (Radesch¨utz et al., 2008).
For performing the extended analysis techniques
BIA-OLAP and BIA-Mining, we developed a BIA-
Cube Model that holds both operational data and pro-
cess data dimensions. We extended the usual OLAP
operators by a new function BIASUB in order to sup-
port the right query abstraction and efficiency. Early
experience shows the usefulness of the architecture
and the benefits obtained by the BIA approach. A
practical example that sketches the assets behind our
BIA approach is given in Section 4.4.
In our future work we will further explore the
adaption of data and process mining algorithms for
process optimization in order to develop concrete
BIA-OLAP and BIA-Mining algorithms for realizing
the analysis examples introduced in this paper.
REFERENCES
Agrawal, R., Gunopulos, D., and Leymann, F. (1998). Min-
ing process models from workflow logs. In Proc. of
Extending Database Technology, London, UK.
Agrawal, R. and Srikant, R. (1994). Fast algorithms for
mining association rules in large databases. In Proc.
of Very Large Data Bases, Chile.
Bruckner, R. M., List, B., and Schiefer, J. (2002). Striving
towards near real-time data integration for data ware-
houses. In Proc. of Data Warehousing and Knowledge
Discovery, France.
Casati, F., Castellanos, M., Dayal, U., and Salazar, N.
(2007). A generic solution for warehousing business
process data. In Proc. Very Large Data Bases, Austria.
Ceglar, A., Roddick, J. F., and Powers, D. M. W. (2007).
Curio: a fast outlier and outlier cluster detection algo-
rithm for large datasets. In Proc. of Integrating artifi-
cial intelligence and data mining, Australia.
Han, J. (2005). Data Mining: Concepts and Techniques.
Morgan Kaufmann Publishers Inc., CA, USA.
IBM (a). Infosphere Warehouse. Available: http://www-
01.ibm.com/software/data/infosphere/warehouse/.
ISO/IEC 9075-2 (2003). Information technology – database
languages – SQL – part 2: Foundation.
Jain, A. K., Murty, M. N., and Flynn, P. J. (1999). Data
clustering: a review. ACM Comput. Surv., 31(3):264–
323.
McCoy, D. (2002). Business activity monitoring: Calm be-
fore the storm. Technical Report LE15-9727, Gartner.
Michie, D., Spiegelhalter, D. J., Taylor, C. C., and Camp-
bell, J., editors (1994). Machine learning, neural and
statistical classification. Ellis Horwood, Upper Sad-
dle River, NJ, USA.
Microsoft (a). Analysis Services. Available:
http://www.microsoft.com/sql/technologies/analysis.
Oracle (a). Business Activity Monitoring. Available: http://
oracle.com/technology/products/integration/bam/.
Oracle (b). JDeveloper 11g. Available:
http://oracle.com/technology/software/products/jdev/.
Parsons, L., Haque, E., and Liu, H. (2004). Subspace clus-
tering for high dimensional data: a review. SIGKDD
Explor. Newsl., 6(1):90–105.
Radesch¨utz, S., Mitschang, B., and Leymann, F. (2008).
Matching of process data and operational data for a
deep business analysis. In Proc. of I-ESA, Germany.
Rubin, V., G¨unther, C. W., van der Aalst, W. M. P., Kindler,
E., van Dongen, B. F., and Sch¨afer, W. (2007). Process
mining framework for software processes. In Proc. of
International Conference on Software Process, USA.
Sayal, M., Casati, F., Dayal, U., and Shan, M.-C. (2002).
Business process cockpit. In Proc. of Very Large Data
Bases, China.
Uysal, I. and G¨uvenir, H. A. (1999). An overview of re-
gression techniques for knowledge discovery. Knowl.
Eng. Rev., 14(4):319–340.
Weerawarana, S., Curbera, F., Leymann, F., Storey, T., and
Ferguson, D. F. (2005). Web Services Platform Archi-
tecture. Prentice Hall PTR.
zur Muehlen, M. (2004). Workflow-based Process Con-
trolling. Foundation, Design, and Application of
workflow-driven Process Information Systems. Logos.
KMIS 2009 - International Conference on Knowledge Management and Information Sharing
82
