
System Interface of an Integrated ISS for Vehicle
Application
M. A. Hannan, A. Hussain and S. A. Samad
Department of Electrical, Electronic and Systems Engineering
Faculty of Engineering and Built Environment, National University of Malaysia
43600 Bangi, Selangor, Malaysia
Abstract. This paper deals with the system interface of the integrated
intelligent safety system that involves the vehicle applications of airbag
deployment decision system (ADDS) and tire pressure monitoring system
(TPMS). Lab Window/CVI in C interface program is developed for prototype
implementation. The prototype implementation is the interconnection between
the hardware objects of the intelligent safety devices such as load cell,
Logitech web-camera, Cross-bow accelerometer, TPM module and receiver
module, data acquisition card, CPU card and touch screen. Integration of
several safety subsystems decision such as the image processing module,
weight sensing module and the crash detection module are fused for intelligent
ADDS. The integrated safety system also monitors the tire pressure and
temperature and analyze the TPMS data for tire condition classification. The
system interface developed the integrated system prototype performance that is
evaluated through several test runs. Their result proven the embedded
intelligent safety system is unique, robust and intelligent for vehicle safety
application.
1 Introduction
The term “intelligent safety” does not literally mean that intelligence resides inside
the vehicle. The “intelligence” implies here as an active essential part of the vehicle
that contribute to safety, security and driving comfort. Intelligent safety system
provides operation to ensure the safety and comfort level of the occupant in the
vehicle [1]. However, due to occupant expectation of high level of control and safety,
a large number of individual safety systems are needed [2]. This increased concern for
safety issues has resulted to design accurate integrated intelligent safety system that
involves features technologies, characteristic of safety issues and providing solutions
by monitoring, detecting, classifying, impending crash or unsafe driving conditions,
warning the driver, improving his or her ability to control the vehicle and prevent the
accident [3].
Many individual researches have been focused on the safety issues such as
occupant detection, classification and position, vehicle crash detection and its severity
analysis, TPMS etc. For example, occupant detection and characterization are the
fundamental importance [4] to improve the safety and comfort features of the
Hannan M., Hussain A. and Samad S. (2009).
System Interface of an Integrated ISS for Vehicle Application.
In Proceedings of the 3rd International Workshop on Intelligent Vehicle Controls & Intelligent Transportation Systems, pages 106-119
Copyright
c
SciTePress

occupants. However, it is a difficult task, despite the success of some of these
systems, the occupant detection such as human, non-human object and its
classification still pose a number of challenges with respect to real time
implementation and operation [5].
The vehicle crash detection is very helpful for preventative safety, preventing
accidents and collision for minimizing human injury when an accident occurs [6].
However, in past it has been a rather seldom discussed on research and theoretical
analysis of crash in the field of traditional engineering [7]. It is therefore NHTSA and
other safety concern made rule that vehicle crash detection and analysis are
mandatory for safety issue [8].
Similarly, the safety issue on TPMS is a
significant factor in the driving experience and
vehicle
performance [9]. Accordingly, the NHTSA made a legislation known as the
TREAD act in which after 31 October 2006, all vehicles in United States should have
the option of TPMS [10].
The system interface for the prototype implementation of intelligent safety system
is the most important. It is therefore, this paper pursue the interface program that are
used for the development of an innovative integrated intelligent safety system to
identify major hazards and assess the associated risks in an acceptable way in various
environments where such traditional tools cannot be effectively or efficiently applied.
The safety device provides data to the intelligent safety system that is useful for the
development of ADDS and TPMS. The objective of this paper are met by integrating
and developing the advance solution of the innovative safety issues likewise occupant
detection, classification and position, vehicle crash detection and its severity analysis,
TPMS and other detrimental issues.
2 System Integration
There are a number of limitations with the conventional architecture of the vehicles
intelligent safety systems. The safety measures are challenging and increasing
awareness of the automotive companies, due to customer expectation of high level of
control and safety. However, because of the wide variety of individual safety system,
it needs a large library of programs and much expensive individual platforms. This
wide variety of safety is continuous increasing the complexity that would lead to a
physical maximum and interdependence between the systems. So as to extract the
most of the individual demands, the platform need to be integrated, addressed a robust
algorithm and calibration process to optimized and validate the vehicle integrated
safety system. The principle motivation behind the system integration is to reduce
individual systems safety device management cost in the performance domain. The
integrated intelligent safety system aims to provide heterogeneous workload
management concepts and functions to the safety issues and validate them based on
performance diagnosis of collected monitoring data in a developed platform.
The intelligent vehicle safety platform identifies the hardware and software
execution environment of a system. The hardware platform identifies a set of
hardware objects associated with processors. The system interface provides a high
level of interface between software objects running on different processors that
control the hardware. The proposed integrated safety system deals with the safety and
107

comfort issues in the modern vehicle such as TPMS, occupant detection, detection
and position and vehicle crash detection. This integrated safety system gathers data
through a set of sensors, collected the data through acquisition processes and
eventually reacts through a CPU and finally, safety issues are monitored in a LCD
display unit.
3 Method and Algorithm
We have developed the algorithms for ADDS and TPMS. In ADDS, we have
developed the individual algorithms for occupant detection, classification and position
based on weight sensing and image process as well as for vehicle crash detection. In
weight sensing, in order to classify, the weight measurement data are used with logic
combination. We consider that less than 10 kg as a non-human object, while the child
setting is ‘10 kg<child<35’ and the adult setting is 35kg<adult<100kg. For example,
when an adult occupant is on the seat, the adult logic is true, and child and non-human
object logics are false, which the dynamic output classifies as adult and displays its
decision on the monitor. In position detection, we have calculated the centroidal
distance Fx
and Fy are as follows.
)4321(
)4321(
FFFF
FFFF
xFx
+++
+
−
+
−
=
(1)
)4321(
)4321(
FFFF
FFFF
yFy
+++
−
−
+
=
(2)
where F1, F2, F3 and F4 are weight forces of the four sensors, while x and y are the
distances from the centre to the sensor in x and y directions, respectively. These
calculations of Fx and Fy provide the appropriate position of the occupant.
In image processing, the algorithmic approach for detection and classification of
occupant, non-human object and non-object as shown in Fig. 1. The proposed system
is functioned with the combination of fast neural network (FNN) and classical neural
network (CNN), in which the FNN is trying to extract any positive detection
including false detection. Post-processing strategies are applied to converts
normalized outputs and for adjusting intensity histogram equalization or lighting
correction function are also applied to solve false detection. The output of FNN is
then feed to CNN to verify which region is indeed the system detection. This
proposed combined network is quite robust on detecting accuracy and computation
efficiency rather than single network, which is unable to fully eliminate false
detection problem.
108
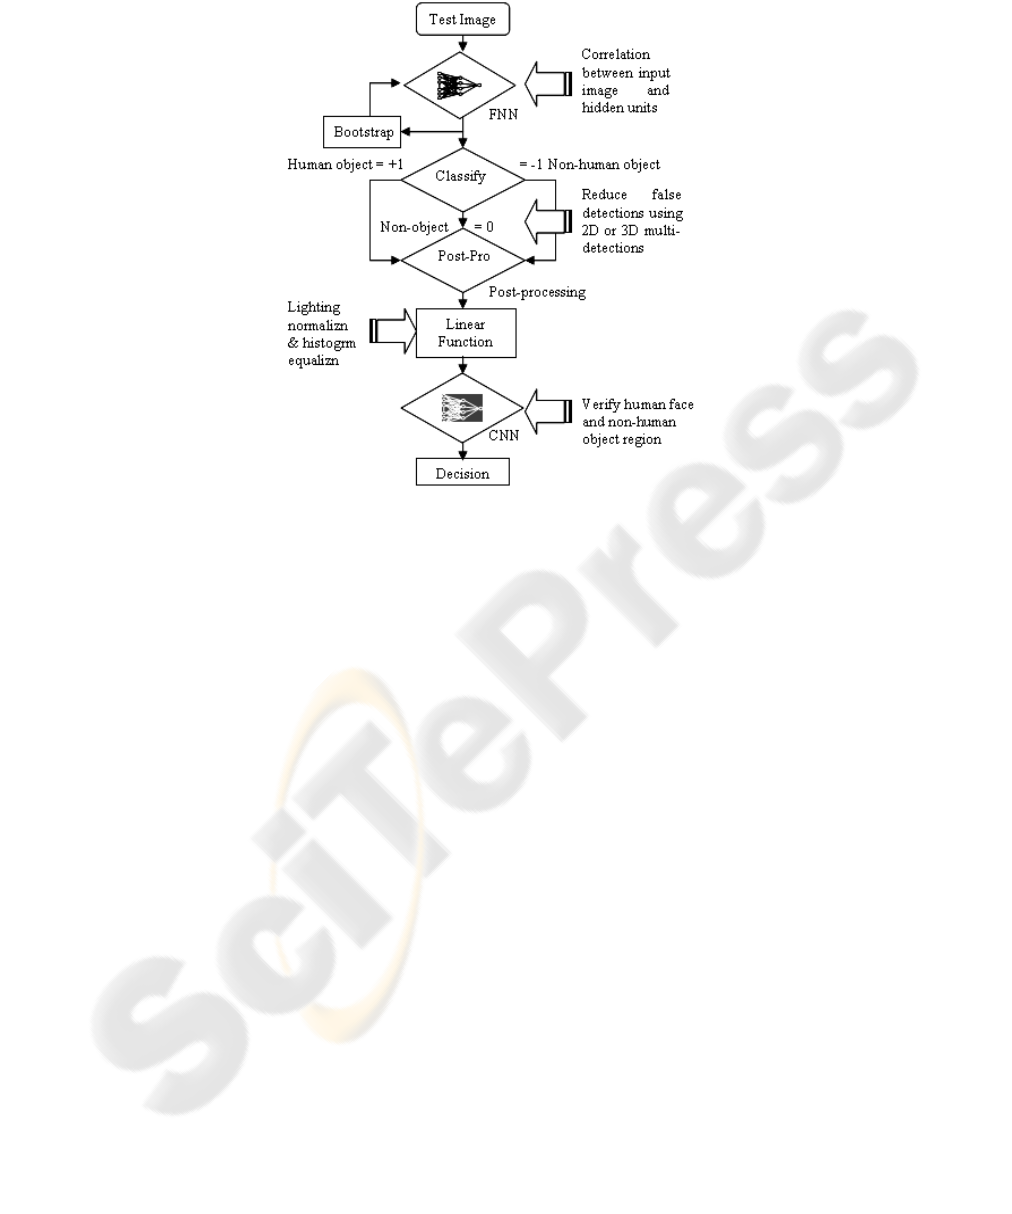
Fig. 1. Neural network algorithm for the occupancy detection.
This variable, Δv(t) is an essential parameter for crash detection that can be found
in the algorithms development. The change in vehicle velocity, Δv(t) is obtained by
computing the integration of the acceleration signal [hannan elsevier] as shown in
below.
)(cos)()(
2
δωω
+−==Δ
∫
∫
tAdttatv
(3)
Selecting a threshold value of the vehicle velocity, V
th
, is therefore required to
facilitate the decision making of whether or not an effective crash has occurred. Such
threshold V
th
value can easily be determined from the lowest speed of an effective
crash defined by NHTSA i.e. 22.54 km/h. In order to detect crash, the developed
algorithmic steps are as follows,
i) If Δv(t) ≥ V
th
, then output =‘1’; DECISION: Effective crash is detected.
ii) If Δv(t) < V
th
, then output =‘0’; DECISION: Effective crash is not detected.
An increase in vehicle speed during crash increases the crash severity factor. The
change of velocity, Δv(t), over a period of time, T, at the detection state can be
computed since the integral over the noise component is approximately zero. The
circuit for computing Δv(t) can be designed using systolic architecture to achieve the
real-time speed. The output of the detection state is fed into a data acquisition card for
system development.
In TPMS methodology, there are two ways to acquire data from the sensor
likewise, using a successive approximation algorithm or by a threshold check. A
successive approximation provides an accurate conversion of the sampled temperature
109
or pressure reading into an 8-bit value. In the threshold check, the DAR is preloaded
with a threshold value during standby/reset mode to detect whether the pressure or
temperature has crossed a particular level. The receiver module is capable of
receiving both OOK and FSK through UHF receiver that communicates with the CPU
by a SPI. The UHF receiver detects and demodulate the signal through Manchester-
encoded bit stream, sending out the important data to the CPU that is monitor in the
display unit. The TPM and receiver module is loaded with a simple software program
to effective the functionality of the hardware. The assemble code for TPM tire module
is written using the “WIN IDE” integrated development environment and
programmed into RF2 through the programmer board that transmitted data to the
receiver module. Receiver module communicates with the UHF receiver using the
Turbo C Borland C compiler run under DOS. A function “TPMReceiverModule”
created in the main interface program is called in UKM.dll to monitor pressure and
temperature that is extracted from TPM receiver through SPI connection to CPU.
4 Prototype Structure
The hardware prototype is a vital representation of final design of integrated safety
system. It is also the basic tool to find deep bugs in the hardware. This is why; it has a
crucial step in the whole hardware structure design of embedded system.
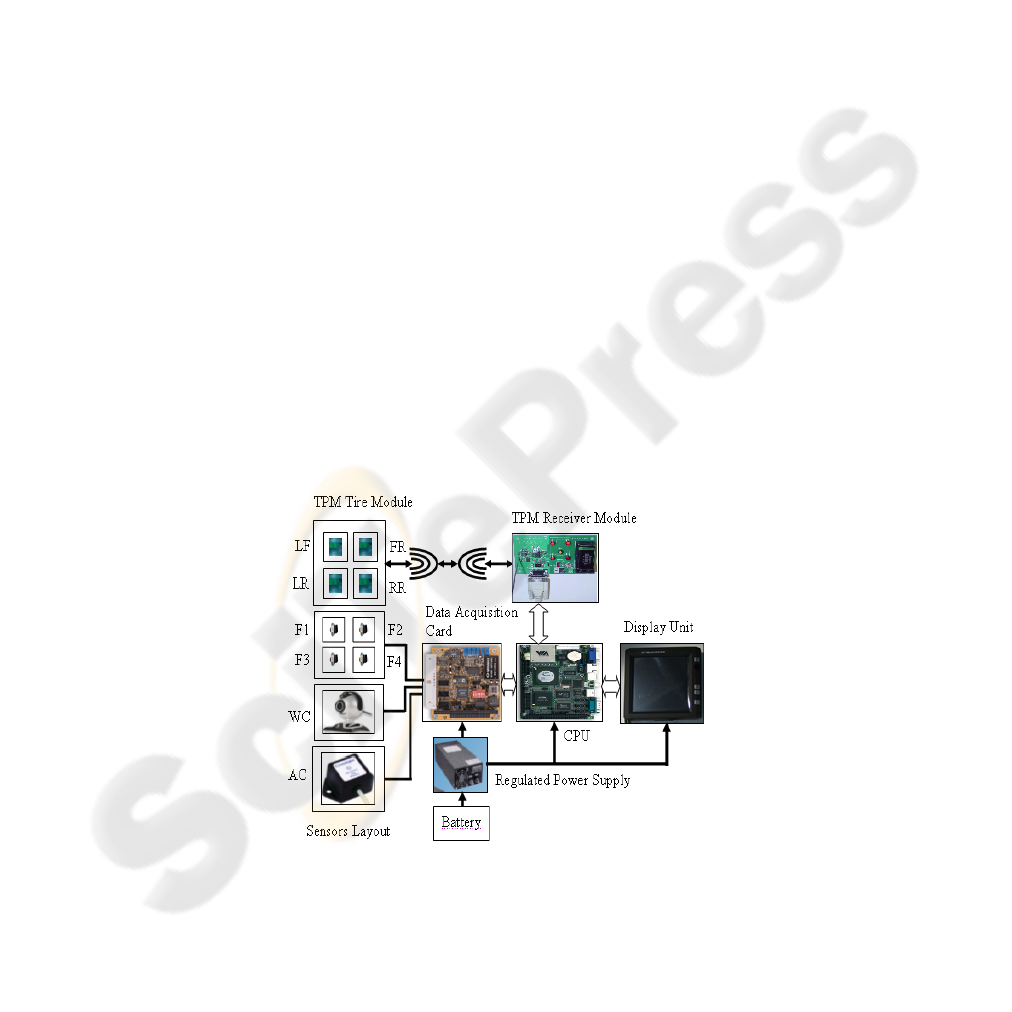
This system implementation is developed through the physical interconnections
between hardware objects using standard hardware design technique. The whole
developed system structure consists of the following hardware objects such as sensors
as tire pressure monitoring modules, load cell weight sensor, Logitech web-camera
(WC) and Cross-bow accelerometer (AC) crash sensor, data acquisition card for
analog to digital conversion, CPU card, touch screen for deploying result and ATX
switch mode power supply (SMPS) as shown in Fig. 2.
Fig. 2. Hardware structure of integrated prototype system.
110

5 System Interface
In this interface program, data are acquired from the weight sensor inside the
passenger seat and crash accelerometer sensor fixed on the vehicle bumper through
AXIOMTEK AX10410A acquisition card. This weight and crash sensor provides
analog signal that received by CH0 to CH6 of the A/D converter of DAQ card from
the 4 weight sensors and a 3 axis of crash sensor. A web-camera is connected to the
CPU through USB. The program firstly determined whether the seat is empty, human
or non-human something is on it according to the logic combination of measured
weight sense and image on the seat. Then classify the occupant size based on weight
measurement data with logic combination. For example, when an adult occupant is on
the seat, the adult logic is true, and child and non-human object logics are false, which
the dynamic output classifies as adult and displays its decision on the monitor. The
interface system also determined the centriodal position of the occupant to find
whether the occupant is in good position or not. Occupant detection, classification and
position along with vehicle crash detection decision provides decision to the ADDS.
TPM receiver module is connected to the CPU through SPI that extracted pressure
and temperature for monitoring and provide warning system to the display unit.
Details interfacing connection among the external sensors and power supply to the
data acquisition card and CPU are shown in Table 1 and Table 2.
Table 1. Connection the external sensor to the DAQ and CPU.
DAQ and
CPU
Sensor T
y
pe Wire Color
Channel 0 Weight Senso
r
Blue (Left
Bottom)
Channel 1 Weight Senso
r
Violet (Left Top)
Channel 2 Weight Senso
r
Orange (Right
Top)
Channel 3 Weight Senso
r
White(Right
Bottom)
Channel 4 Crash Senso
r
Violet (X-axis)
Channel 5 Crash Senso
r
Yellow (Y-axis)
Channel 6 Crash Senso
r
Black (Z-axis)
USB Web-Camera USB Por
t
SPI TPM Receiver
Module
Serial Por
t
Table 2. Power connector on the power supply and CPU card.
Wire Colour Wire T
y
pe
Yellow 12 vol
t
Re
d
5 vol
t
Blac
k
Groun
d
111

The displays are shown on a touch screen. The touch screen has three different
connectors likewise USB, VGA and 12 volt regulated power supply.
Table 3. Touch screen display unit connectors.
Connector on the Touc
h
Screen
Connection to the
Other End
USB connector
Connected to the
USB connector on
the CPU card.
VGA connector
Connected to the
VGA connector on
the CPU card.
Power connector, Red wire
– 12 Volt Black wire –
Ground
Red wire goes to
the Yellow
connector on the
SMPS and the
Black wire goes to
the black
connector on the
SMPS.
6 Interface Program
The system interface between the software and hardware is developed based on Lab
Window/CVI in C programming language. The Low level driver called
“c:\cvinterface\UKM.dll” is written as a Win32 DLL file where the functions inside
the DLL are called by the Lab Window/CVI C program. In this DLL file, the function
called “Func1” processes the analog signal received by CH0 to CH6 of the A/D
converter of DAQ card from the 4 weight sensors and 3 axis of crash sensor. The
function “HumanDetection” provides the decision based on weight sensing whether
the occupant is adult, child or empty. The function “ImageProcess” is called inside the
UKM.dll to perform the face detection. This function returns a 1 if the image captured
by the web-cam is detected as “human” else if it detects a “Non Human” the function
returns a 0.
This 1 and 0 is fused with the logic combination of weight sensor to detect
occupant as adult, child, non-human object or empty. The function “CrashSensor” is
responsible for whether crash is generated or not. The function for position detection
“PositionDetection” calculates the centroidal distance of x and y axis from the
UKM.dll that display is the GUI and provides the decision for occupant position.
Finally, the function “ABagParm” provides the airbag deployment decision upon
fusing logic combination of occupant classification, position and vehicle crash
detection decision. The function “TPMReceiverModule” also called in UKM.dll to
monitor pressure and temperature that is extracted from TPM receiver through SPI
connection to CPU. The Fig. 3 shows the details program flowchart diagram of the
UKM.dll.
112
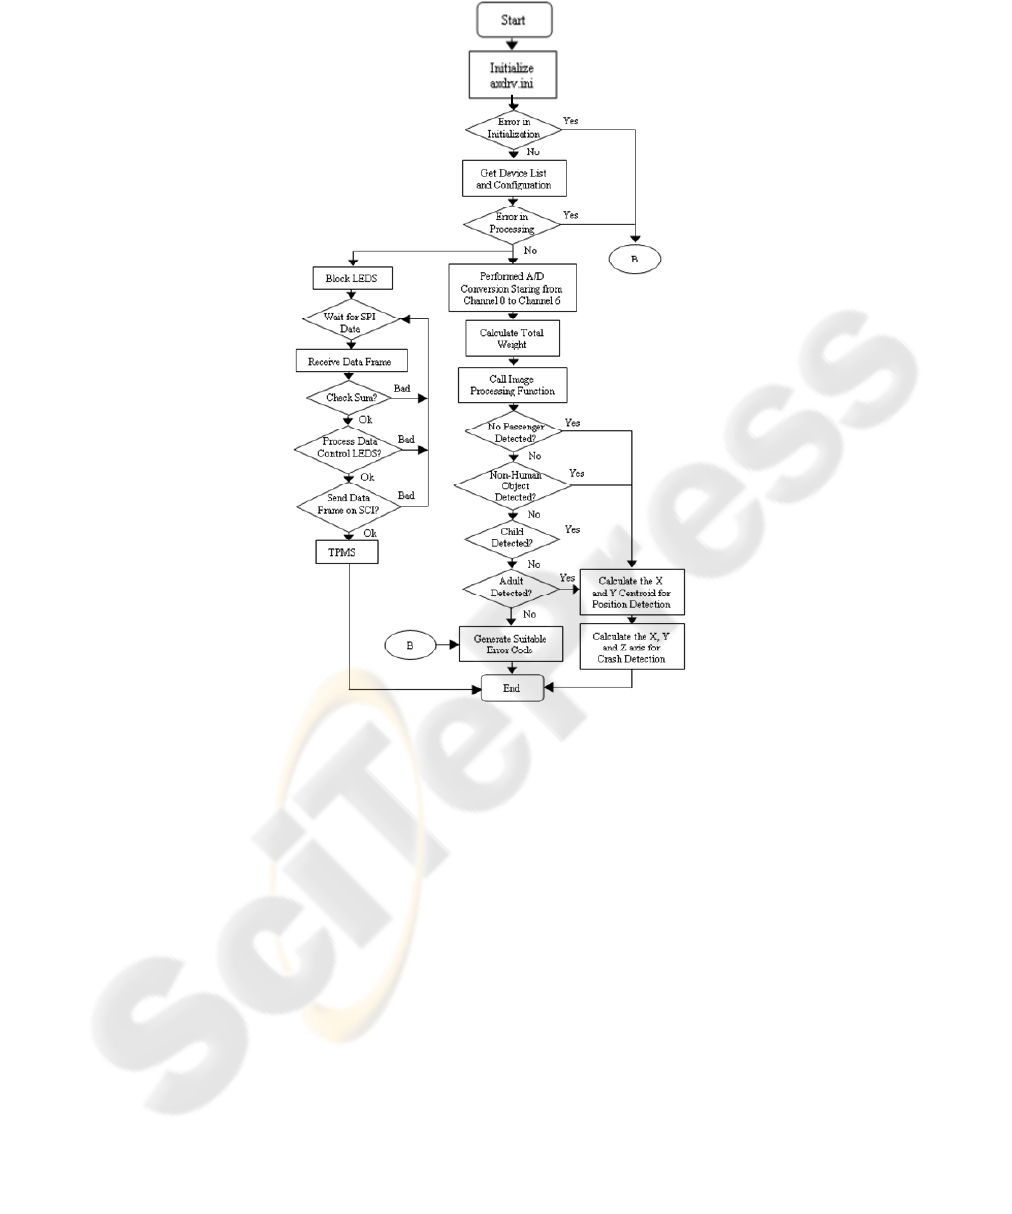
Fig. 3. Interface program flowchart of the integrated system.
7 Experimental Results and Discussion
The experimental results and graphical user interface on the touch screen graphs
representing real-time field applications of the integrated intelligent safety system.
The results contain for network interface processing, image and signal processing for
occupant detection, classification and position, vehicle crash detection and its severity
analysis towards ADDS and the performance monitoring of TPMS. Usually the real-
time constraints vary up to 1 minute. However, in our prototyped hardware, the
execution vectors of whole system are derived from the experimental measurements
within 50 ms. The results in decision and graph on the GUI, the resource library is
assumed that contain CPU, data acquisition card, sensors and their interface between
sensor and CPU. Details of experiment results and its analytical discussions are given
below.
113

7.1 Results and Discussion
Occupant detection, classification and position is confirm based on the logic fusion of
image and signal processing data. In image processing, the intelligent safety system is
used two-data sets of images in the experiments to test the detection performance of
human face and non-human object, which are distinct from the training sets. The first
sets consist of 253 test images, whose have a wide variety of complex background in
the various environment and scale changes for the object of interest along with some
occlusion and variations in lighting. 25 human face image of interest is taken for a
total of 253 test image. The second data sets contain 112 test images that have been
collected from 7 non-human object of interest is taken. The systems undergo the
bootstrapping cycle with ending up 4500 to 9500 zero samples, to evaluate the
performance of true detection of the test images and the rate of false detection from
the image of natural scenes that do not contain human face or non-human object.
Table 4 shows the performance of human face detection results of various
methods on the test set 1 and compare with other systems in term of the number of
detect faces, miss faces, false detection and computation time. The successful rate of
the proposed method is 97.6 %, with 6 false alarms. It should be noted that the
number of false alarms is quite small in compared to methods Yacoub et al. [11] and
Fasel et al. [12] which is 347 false alarms. This may show the capability of the
combination of two networks to highly separate human face from non-object
examples. The higher performance of Rowley et al. 1998 [13] is likely due to the size
of training data. We used a 7344 human face images and 8000 non-object examples,
while Rowley et al. 1998 trained with 16000 face images and 9000 non-faces images.
However, the technique is less efficient than our techniques in term of the false
detection and response time. On the other hands, Yacoub et al. [11] shows a very fast
time processing but have a drawback of higher false alarms.
Table 4. Detection Rate of Set 1 on Different Methods.
Method
Human
Detect
(%)
Miss
Human
(%)
N
o.
False
Detec
Proces
s
Time
FNN+CN
N
97.63% 2.37% 6 2.3s
Rowley et
al.
97.86% 2.14% 13 0.013M
Yacoub et
al.
84.31% 15.69% 347 0.7s
Fasel et
al.
96.8% 3.2% 278 3.1s
Similarly, Table 5 shows the summarized results of non-human object on the test
set 2 and compare with other systems. We found that non-human object detection rate
is 96.42%, which mean 108 out of 112 numbers of non-human objects are detected.
The false detection rate is 3.58%, which is lower that Agarwal et al. [14] and others
methods [15]. However, the average process time is almost same with others method
providing additional calculation on CNN. Based on the results shown in Tables 4 and
114

5, we can concluded that both human face and non-human object detection system
make acceptable tradeoffs between the number of false detection and detection rate.
Table 5. Detection rates of set 2 on different methods.
Method
N
-Human
Object
Detect
Miss N-
uman
Object
No.
False
Det.
Proces
s
Time
FNN+CN
N
96.42% 3.58% 4 2.9s
Agarwal
et al.
94% 6% 30 3.6s
Mahmud
& Hebert
82% 18% 187 4.0s
Viola &
Jones
95% 5% 71 0.7s
Once the image processing part completed, the “ImageProcess” function provides
1 for human and 0 for non-human object. This 1 and 0 is fused with the weight sense
of the sensor situated inside the vehicle seat to provide accurate occupant detection
and classification for the integrated intelligent safety system. To illustrate the
performance, some exemplary results obtained from the prototype system are
demonstrated for instances such as, when the seat is occupied or empty. If occupied,
the occupant is classified as an adult, child or non-human object. Usually, human in
the seat provides its weight with positional variation. However, non-human object like
grocery bag is static and provides its weight without positional variation. It also
demonstrates that the position of the occupant can be determined for consideration of
safety issues in airbag application or for measuring the comfort level.
Figure 4 shows the centroidal position of y_centroid vs. x_centroid of the vehicle
front passenger seat of size 50x50 cm that indicates various position of the occupant
such as standard, good and bad with marking blue, green and violet lines,
respectively. Figure 4 (a) shows that occupant in the seat is good position with relax
mode aligning to the back of the seat. Figure 4 (b) shows that the occupant is in bad
position i.e. the occupant is aligned very much right to the seat. On the other hand,
Figure 4 (c) indicates that occupant is in bad position and very close proximity to the
airbag. In that case, our safety device will not provide decision for airbag deployment.
Similarly, Figure 4 (d) also indicates that the occupant is in extreme left of the of the
vehicle seat.
115
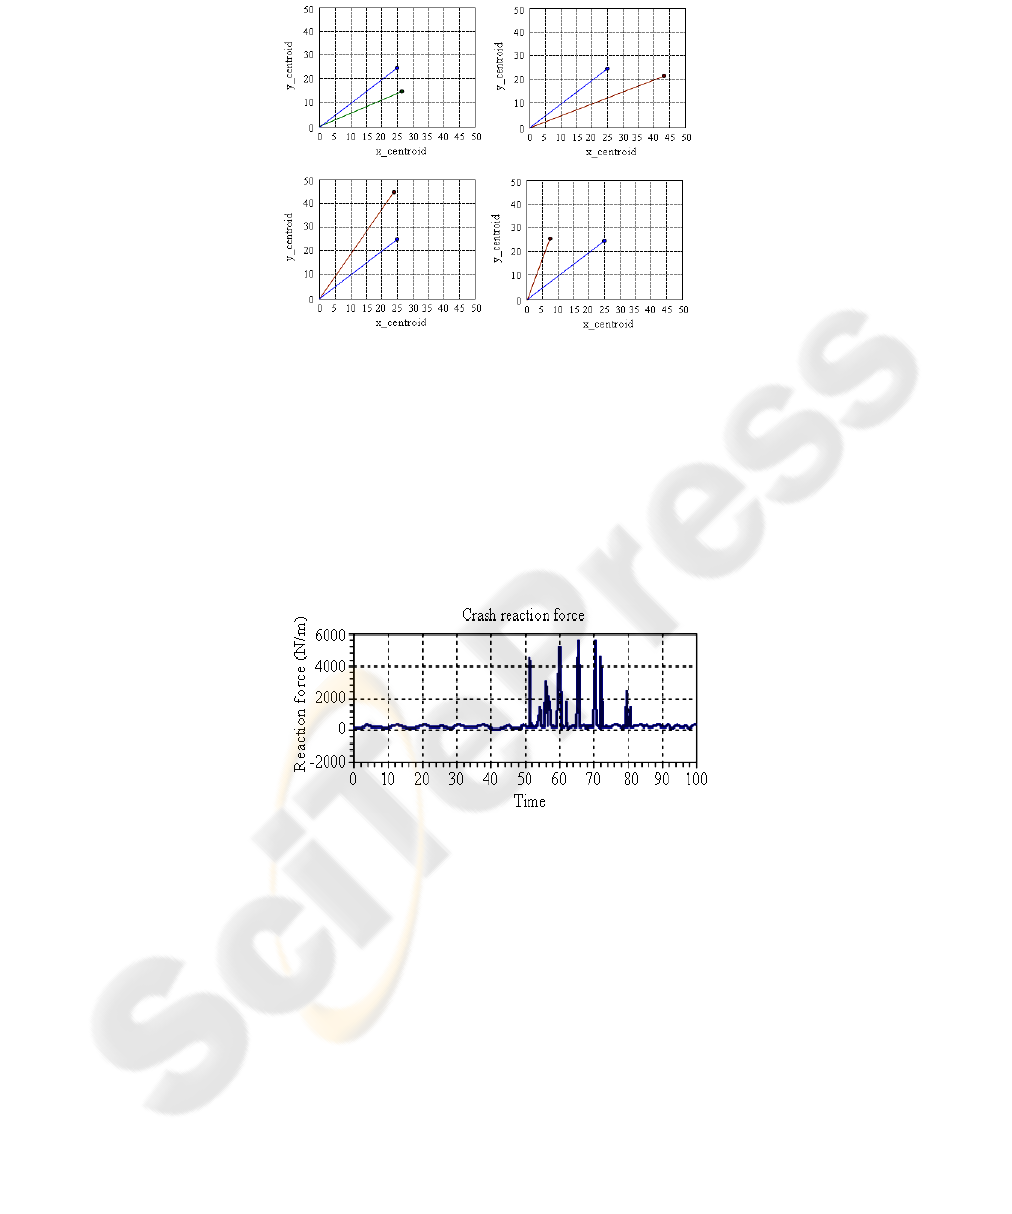
Fig. 4. Occupant centroidal position calculation.
Next, we have implemented the experiments of the frontal static crash using crash
generating device and with the interface program. The experimental result of the crash
reaction force being applied to generate crash is shown in Fig. 5. We have tried to
obtain the reaction force during the repeated crash conduction at a time 51 sec to 80
sec. Figure 11 shows, during repeated crash, it gains a huge force of ~ 1000 N/m to ~
5800 N/m and definitely the crash velocity immediately before the crash is greater
than the 22.54 km/h. The reaction force depends on the crash velocity of the system.
It is stated that as velocity increases the reaction force also increases, which in turn
increases the crash severity. This is a situation that put the occupant at a higher risk.
Fig. 5. Vehicle crash reaction forces.
For analysis of tire data, the ‘Goodness of Fit’ statistical analysis for the model is
tested with all the variables. Figure 6 shows the ‘Goodness of Fit’ of the principle
component analysis with polynomial fitting. The fitting result of parametric model of
SSE is 0.1358 with 95% confidence bounds, which is close to 0 and indicates that the
data fits well. The value of the multiple correlations R
2
coefficient is 0.8452, whilst
the adjusted R
2
value is 0.8267. Both reveal about 85% and 83% match in the
outcome which indicates a good fit. In addition, the RMSE value of 0.161, which is
close to 0, also implies that the data fits well. In Fig. 6 (b), residuals of the
polynomial fit appear to be randomly scattered around zero, which again indicates the
model perfectly fits the data under the study. In short, we have statistically proven
116
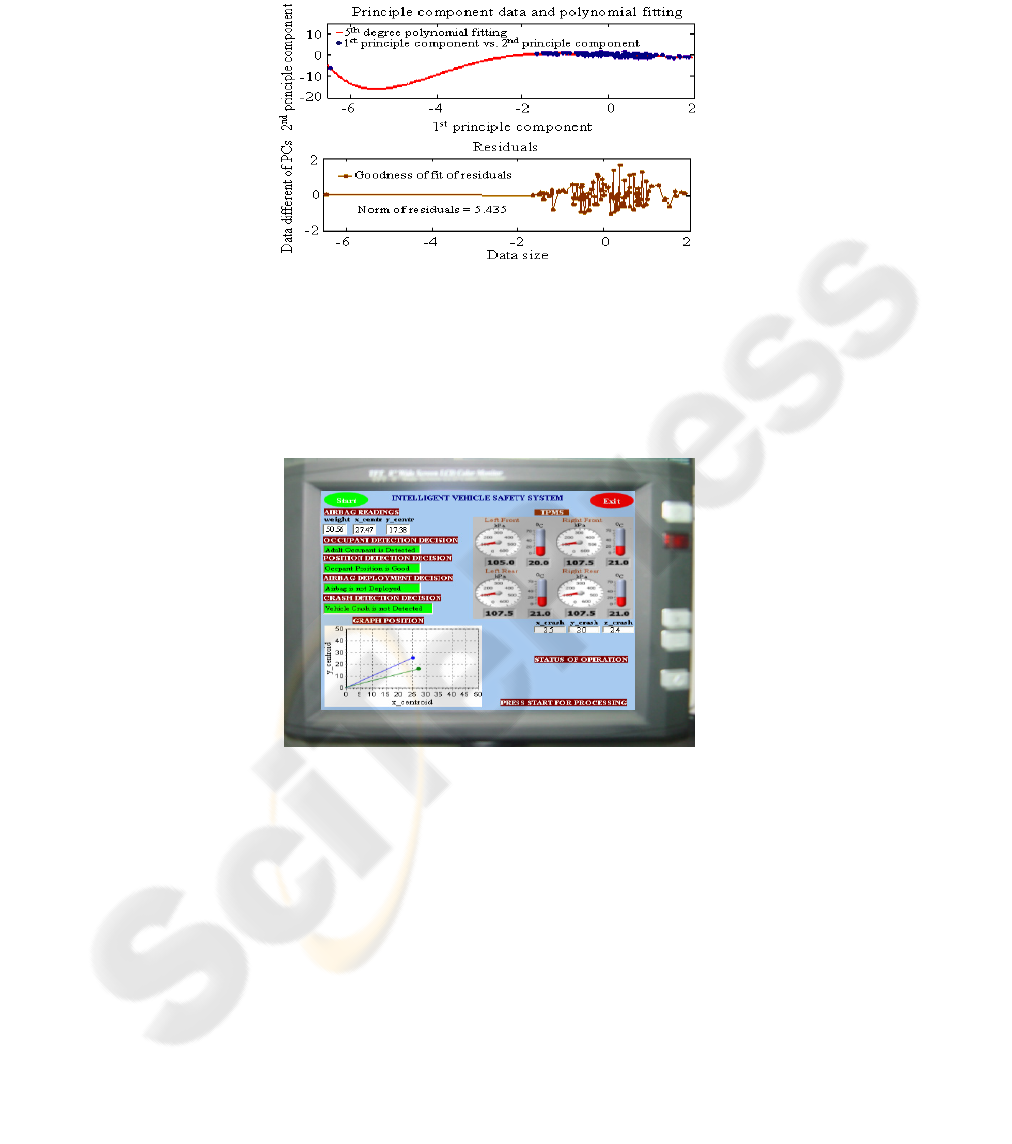
that TPMS can play an important role to enhance tire safety, performance and
maintain reliable operation in combine with vehicle intelligent safety system.
Fig. 6. Principle component analysis and goodness fit.
The Fig. 7 shows the display unit of experimental results and decision monitoring
operation of the implemented integrated intelligent safety system towards ADDS and
TPMS. The ADDS is involved on occupant detection, classification and position,
vehicle crash detection and its severity analysis. The safety feature functions are
activated by pressing start button.
Fig. 7. Display of integrated intelligent safety system.
The display unit successfully achieved the decision application of safety features.
Several safety issues related decision performances are fused using logic combination.
In Fig. 7, its shows that when the system detect adult occupant and keeping good
position, the airbag will not be deploy, provided there is no crash detected by the
system. All the decisions in the display unit are shows as green mark. Accordingly,
the icons of occupant total weight, centroidal position, axis wise crash data and
position graph are displayed. For TPMS, the display unit also shows that all four tire
acquiring the real-time temperature and pressure data, respectively. Therefore, the
integrated prototype provides the optimum and their fused decision on various safety
117

issues that is very useful related to the safety issues for vehicle driving assistance
system.
Similarly, when adult occupant is detected and keeping good position, airbag is
deployed only whenever the vehicle crash is detected.
However, if the occupant position is bad i.e. occupant is very close to the airbag
unit, the airbag would not deploy though the vehicle crash is detected. This is because
of the huge reaction force would hit the occupant due to close proximity between
occupant and airbag unit. This is a situation that put the occupant at a higher risk.
8 Conclusions
In this paper, the system interface of the integrated prototype implementation of
vehicle intelligent safety system has been presented. Lab Window/CVI in C interface
program is used for the real-time intelligent safety systems prototype implementation.
The safety system such as TPMS, occupant detection, classification and position,
vehicle crash detection and its severity analysis are integrated. The prototype is made
by developing the algorithms and methodologies of the hardware platform and system
interface program. The application of the embedded intelligent safety system has
resulted in successful real-time working device, which will provides the validation of
the performance diagnosis of the safety system. The contribution of the interface
system of this prototype are performance characterization, problem determination
and real-time work load data monitoring of a distributed safety issues and provides
safety warning, whose are applicable in successfully operation.
Acknowledgements
The authors would like to thank the Malaysian Ministry of Science, Technology and
Innovation (MOSTI) for funding this work through IRPA research grant 03-02-02-
0017-SR0003/07-03.
References
1. D. S. Timothy, and M. M. Trivedi, “Real-time stereo-based vehicle occupant posture
determination for intelligent airbag deployment” Proc. of the IEEE International
Conference on Intelligent Vehicles, June, 2003, pp: 570-574.
2. M. Devy, A. Giralt, and A. Marin-Hernandez, “Detection and Classification of Passenger
Seat Occupancy using Stereovision” Proc. of the IEEE Intelligent Vehicle Symposium,
Dearborn (MI), USA, Oct. 3-5, 2000, pp: 714-719.
3. M. Shiraishi, H. Sumiya, and Y. Ysuchiya, “Crash Zones based on Driver’s Collision
Avoidance Operation for ITS”. Proc. of the IEEE Conf. on Intelligent Transportation
System, Singapore, 3-6 Sept. 2002, pp: 210-215.
4. H. Kong, Q. Sun, W. Bauson, S. Kiselewich, P. Ainslie and R. Hammoud “Disparity Based
Image Segmentation For Occupant Classification” Proc. of the IEEE Computer Society
118

Conference on Computer Vision and Pattern Recognition Workshops(CVPRW’04), Vol. 1,
2004, pp. 126-134.
5. N.Shigeyuki, “Development of occupant classification system for advanced airbag
requirements”, Mitsubishi Motors Technical Review, 16: 61-64, 2004.
6. T. Marunaka, T. Kimura, M. Taguchi, T. Yoshikawa, H. kumamoto, and K. Kishida,
“Study on the Crashworthiness of Rail Vehicles” Proc. of the IEEE/ASME Railroad
Conference, 17-19 April, 2001, pp: 251-257.
7. A. Rovid, and G. Melegh, “Modelling of Road Vehicle Body Deformation Using EES
Detection ” Proc. of the IEEE Conf. on Intelligent Signal Processing, Budapest, Hungary,
4-6 Sept. 2003, pp:149-154.
8. NTSB (National Transportation Safety Board), “Safety Recommendations H-97-19 through
-21” http://www.ntsb.gov/recs/letters/1997/H97_19_21.pdf, Washington, D C 20594
(January 10, 2005).
9. Ronald K. J. 1989. Global 90 cars: electronics-aided. IEEE Spectrum, 26(12): 45-49.
10. Burgess, J. 2003. Application Note AN1951/D: Motorola Tire Pressure Monitor System
Demo. Freescale Semiconductor, Inc.
11. S. Ben-Yacoub, B. Fasel and J. Luettin, “Fast Face Detection using MLP and FFT”, Proc.
Second International Conf. On Audio and Video-based Biometric Person Authentication
(AVBPA ’99), 1999.
12. B. Fasel, S. Ben-Yacoub and J. Luettin, “Fast Multi-Scale Face Detection”, IDIAP-Com 98-
04, 1998, pp. 1-87.
13. H. A. Rowley, S. Baluja, and T. Kanade, “Neural Network-Based Face Detection”, IEEE
Transaction on Pattern Analysis and Machine Intellignce, Vol. 20, No. 1, 1998, pp. 23-38.
14. S. Agarwal, A. Awan, and D. Roth, “Learning to Detect Objects in Images via a Sparse,
Part-Based Representation”, IEEE Transaction on Pattern Analysis and Machine
Intelligence, Vol. 26, No. 11, 2004, pp. 1475-1490.
15. S. Mahamud and M. Hebert, “The Optimal Distance Measure for Object Detection”, Proc.
of the IEEE Computer Society Conference on Computer Vision and Pattern Recognition
(CVPR’03), Vol. 1, 2003, pp. 248-255.
119
