
ATTACK GRAPH GENERATION WITH INFUSED
FUZZY CLUSTERING
Sudip Misra
1
, Mohammad S. Obaidat
2
1
School of Information Technology, Indian Institute of Technology, Kharagpur, India
2
Department of Computer Science, Monmouth University, New Jersey, U.S.A.
Atig Bagchi
3
, Ravindara Bhatt
4
, Soumalya Ghosh
1
3
Department of Computer Sc. & Eng., Indian Institute of Technology, Kharagpur, India
4
Dept. of Electronics and Elect. Comm. Eng., Indian Institute of Technology, Kharagpur, India
Keywords: Attack Graph, Connectivity Matrix, Privilege Matrix, Fuzzy Logic Clustering, Computer Network Security.
Abstract: Modern networks have been growing rapidly in size and complexity, making manual vulnerability
assessment and mitigation impractical. Automation of these tasks is desired (Obaidat and Boudriga, 2007;
Bhattacharya et al., 2008). Existing network security tools can be classified into the following two
approaches: proactive (such as vulnerability scanning and use of firewalls) and reactive (intrusion detection
system). The modus operandi of proactive approaches have an edge over the reactive ones as they have
threat information prior to the attack. One approach, viz., generation and analysis of attack graphs, in this
class has gained popularity. In this paper, we present an algorithm to automatically generate attack graphs
based on the prevalent network conditions. The nodes in the graph that are generated by executing our
proposed algorithm have been grouped based on logical graph paradigm which helps in visualizing the
dependencies among various initial and generated network configurations towards obtaining the attacker’s
goal. In addition, fuzzy logic based clustering has been applied on the generated data corresponding to each
such group. This form of clustering is beneficial, because in the real world the boundaries between clusters
are indistinct. This form of clustering leads to better visualization of the attack graph.
Our goal is to design and develop an efficient approach for automatic attack graph generation and
visualization. The approach uses attack graph generation algorithm, and requires network initial conditions
as input. Fuzzy logic based clustering, Fuzzy C-Means (FCM) (Bezdek, 1981), is applied at the output of
attack graph generation algorithm to improve visualization. Our approach helps network administrator to
visualize attack graph in an efficient way. This reduces the burden of network administrator to a larger
extent.
1 INTRODUCTION
In the recent years, the volume of network traffic has
increased monotonically. The proliferation of the
Internet has made organizations vulnerable to cyber
attacks. Along with this, the sophistication levels of
contemporary cyber attacks as well as their severity
and anonymity have also increased.
Present day security technology can broadly be
classified as proactive (such as vulnerability scanning
and use of firewalls) and reactive (intrusion detection
system). Proactive technology aims at identifying
vulnerabilities, which a malicious attacker can
exploit, and mitigating the risk involved before these
vulnerabilities can be exploited. On the other hand,
the reactive technology bases on the analysis and
mitigation of network attacks after the attacks are
detected. To overcome the passive nature of reactive
risk management approach, the proactive methods
are favored.
Proactive methods are extensively used in
enterprise networks spanning several hosts and
subnets. Such networks typically span multiple
platforms, software packages and employ several
modes of connectivity (Sheynar, 2004). Furthermore,
organizational perimeters have been rapidly
increasing as a consequence of globalization. Such
diversified configurations present a multitude of
vulnerabilities, which can be exploited by attackers.
Existing vulnerability scanners are able to detect such
92
Misra S., Obaidat M., Bagchi A., Bhatt R. and Ghosh S. (2009).
ATTACK GRAPH GENERATION WITH INFUSED FUZZY CLUSTERING.
In Proceedings of the International Conference on Security and Cryptography, pages 92-98
DOI: 10.5220/0002277000920098
Copyright
c
SciTePress

vulnerabilities in isolation, i.e., they detect
vulnerabilities present per service per host. Normally,
an attacker will typically break into a network, by
exploiting a sequence of vulnerabilities and their
corresponding exploits, where the post-condition of
each exploit satisfies the precondition for subsequent
exploits and forms a causal relationship among them
(Sheynar, 2004).
The task of vulnerability detection is very
challenging for an administrator who needs to
consider the interactions of local isolated
vulnerabilities and find global security holes due to
such a correlation (Sheynar, 2004). Such a logical
sequence is known as attack path. Combination of all
possible attack paths over a given network forms an
attack graph. Attack graphs, which are largely used
by present day system administrators for network
monitoring, determine if designated goals can be
reached by the attacker starting from initial state
(Lippmann and Ingols, 2005). Moreover, the current
focus is towards an amalgamation of an automated
attack graph with the network’s intrusion detection
systems (IDS) to perform real-time analysis of the
attacks. The generated attack graph can be extended
to serve the purpose of network monitoring and
alarming. It has been seen that real life networks,
modeled as graphs, have millions of edges, which
makes the resultant graph incomprehensible for an
administrator.
Since the attack graphs generated on
organizational networks are very large and complex,
there arises a need to extract information to be
presented to the administrator. This process of
extracting of previously unknown information from a
large collection of data is known as Data Mining
(Han and Kamber, 2001). Data Mining can be
applied to increase the readability of the attack graph
as well as maintaining information. Clustering, a data
mining technique, concerns the grouping of similar
data points. The fuzzy clustering technique, FCM,
was first introduced by Dunn (Dunn, 1974) and later
extended by Bezdek (Bezdek, 1981). Fuzzy
clustering is advantageous over traditional clustering
techniques as in real applications there are no sharp
boundaries between clusters. The FCM technique can
be applied on attack graphs to increase a graph’s
readability. FCM can help in deciphering patterns in
the data latent in attack graphs.
In this paper, we have proposed an attack graph
generation algorithm. Our algorithm takes initial
network conditions to generate the attack graph. In
order to increase the readability of the attack graph,
FCM was applied on the output of the graph
generation algorithm. The rest of the paper is
organized as follows. Section 2 describes the related
work. This is followed by the proposed algorithm in
Section 3. Section 4 discusses the results obtained.
The conclusion and future work have been described
in Section 5.
2 RELATED WORK
An attack graph of a network is a representation of
all possible attack paths on the networks, given an
initial set of capabilities to an attacker. It can be used
as a tool for qualitative and quantitative analysis of
security attributes and vulnerabilities. One of the
earliest works of the attack graph was done by
Moskowithz and Kang (Moskowithz and Kang,
1997), in which the authors used a graph based
technique to identify the possible loop-holes, using
probability, in a network and represents insecurity
flow. The algorithm proposed by them runs in
exponential time. Phillips and Swiler (Phillips and
Swiler, 1998) provided a formal definition of attack
graphs. They designed a tool, founded on graph-
based approach to network vulnerability that
identifies the set of attack paths having high
probability of success for an attacker. Their
approach represents attack states and transitions
between them, and was based on attack graphs.
However, the attack graph of realistic size was not
generated by them. Swiler et al. (Swiler et al., 2001)
also described an attack graph generation tool for
assessment of security attributes and vulnerabilities
in computer networks. The input provided to the tool
includes pre- and post-conditions, network
information and attacker capabilities. The tool was
used to build shortest path (s) to the specified goals.
It also provided grouping of hosts representing
similar network conditions (e.g., grouping of hosts
on a LAN), and handling of unknown values (default
values, if some missing values exist).The tool has
some drawbacks such as poor scalability, and
manual input (Lippmann and Ingols, 2005).
Ou et al.
(Ou et al., 2006) presented a logical attack graph
algorithm using formal methods. The nodes in the
graph can be classified as fact nodes and derivation
nodes. The fact nodes can be further be divided into
primitive fact nodes and derived fact nodes. Each
fact node is labeled with a logical statement, which
represents a network configuration such as services
running, privileges, and connectivity. A derivation
node takes as input one or more fact nodes, which
together satisfy the pre-conditions of the rule
representing the derivation node. This node serves as
a medium between the set of conjunctive pre-
conditions and post-conditions which occur as a
result of exploiting the vulnerability corresponding
to that rule. The node corresponding to the post-
ATTACK GRAPH GENERATION WITH INFUSED FUZZY CLUSTERING
93

condition is a derived fact node. The algorithm has
asymptotic CPU time between Ο (n
2
) and Ο (n
3
),
where n represents the number of hosts in a network.
However, their algorithm requires one to express
network condition as a propositional formula
(Sheyner et al., 2002).
Visualization plays an important role in attack
graph readability and analysis. The readability of an
attack graph can be increased by employing data
mining approaches (such as traditional clustering or
FCM (Bezdek, 1981)), as well as maintaining
information. In FCM, mentioned in Section 1, each
data point can belong to a cluster specified by a
membership grade, between 0 and 1 (both inclusive).
The FCM partitions a collection of n data points into
c fuzzy clusters (where c<n), and simultaneously
seeking the best possible locations of these clusters.
For example, 200 data points can be partitioned into
4 clusters. The number of clusters is user defined.
The distance measure that forms the usual FCM
algorithm is Euclidean distance. FCM can help in
deciphering patterns in the attack graphs.
We proposed an attack graph generation
algorithm which can be used on large networks. The
output obtained by applying our attack graph
generation algorithm is clustered using the FCM
algorithm. Moreover, our algorithm runs in Ο (n
3
).
3 PROPOSED ALGORITHM
In this Section, we propose the algorithm to
automatically generate an attack graph when the
initial network conditions are provided. Our proposed
algorithm works with nodes of type base & derived
fact nodes, and rule nodes (Ou et al., 2006).
The proposed algorithm, described in Section 3.1,
requires the following inputs: Privilege-matrix
(privilege level over machine), Connection-matrix
(machine connectivity for services). In addition, the
following data structures are used: Ruleset (pre-
condition and post-condition privilege levels for each
service), and Label (nodes in the graph). The nodes
set can be of three types: Base-fact nodes (initial
network conditions), derived-fact nodes, and rule-
nodes. The derived-fact node and rule-nodes are
dynamically created and populated as algorithm
advances.
The graph generation module relies on many
matrices which need to be maintained throughout the
run and change dynamically as per requirements to
generate new nodes which are classified into types
mentioned earlier.
Once an attack graph has been generated,
different matrix operations can be performed on the
final graph’s adjacency matrix for various IDS-based
integration related work, as mentioned in Section 1.
Along with this, as mentioned already, there is a need
to increase the readability of the generated graph,
since they can be extremely large in size and
complexity. We have focused on increasing the
readability of the output graph by employing
clustering methods. We have used, FCM (Bezdek,
1981) (Section 3.2), a fuzzy logic-based clustering
method for the purpose. This method has been
applied to represent clusters. Clustering can greatly
reduce overhead by reducing the amount of data to be
visualized. The output of the graph generation
algorithm is fed as input to FCM. This result in
clustering the attack graph generated data set into
user defined clusters.
3.1 Graph Generation Algorithm
Initialization:
Number of hosts in the network: n
Number of attackers in the network: 1
1) Initialize Privilege-matrix (Priv), which is a
(n+1) field row vector. Fill it up with values
0 for no privilege, 1 for user privilege and 2
for root privilege. The (n+1) values have
been used as one machine is the attacker
itself. Initially, the attacker has root
privilege only over his own machine.
2) Fill in Connection-matrix (Conn), which is
one n×n binary matrix for each of the s
services. Each n×n matrix is to be filled
with a 1 if there exists a machine
connectivity over that service.
3) Make a Ruleset (Ruleset) for each service
and fill it up with precondition and post-
condition privilege levels for each service.
We assume that each service is vulnerable.
4) A null set Label (Label) is added to
identify nodes of the graph.
5) Three node sets are initialized. Base fact
nodes contain initial network condition.
This will have one label each for every
service running on every machine. Attacker
privilege is also to be added here. Derived
fact nodes and rule nodes are dynamically
created when the algorithm runs.
6) An empty set of edges also needs to be fed
to the algorithm as input.
SECRYPT 2009 - International Conference on Security and Cryptography
94
Input:
1) Priv[n+1][n+1] Å Has Values 0(none),
1(user), 2(root), Init: Priv[i][i] Å 2, rest 0.
2) Conn[i][j][k] Å Is 1 if machine j can
connect to k via service i.
3) Ruleset[s] Å Rules for each service
Ruleset[i] Å Struct with 2 fields pre
(int) and post (int) privilege levels for
service i.
4) Label Å Label to identify node
5) Node sets:
a) Base Å Contains labels of base fact
nodes
b) Derived Å Contains labels of derived
fact nodes
c) Rule Å Contains exploit labels
6) Edges Å of form (i,j) for edge from node i
to j
Output:
1) Graph nodes and edges
Algorithm:
1) Loop over each service s
a) Check for each node i:
If attacker has precondition privilege level
or above on machine i and machine i can
connect to service s running on machine
some machine j, then do the following:
i.) Priv(k) Å max(current value of Priv(k),
postcondition privilege level as per
Ruleset).
ii.) Put the label of the new privilege in
derived fact
node set.
iii.) Make edge from service node
corresponding to s
and old privilege node to rule node (for this
service s on machine j from machine i).
iv.) Make and edge from that rule node to
new
privilege node
2) Go to line 1 if any new node is added.
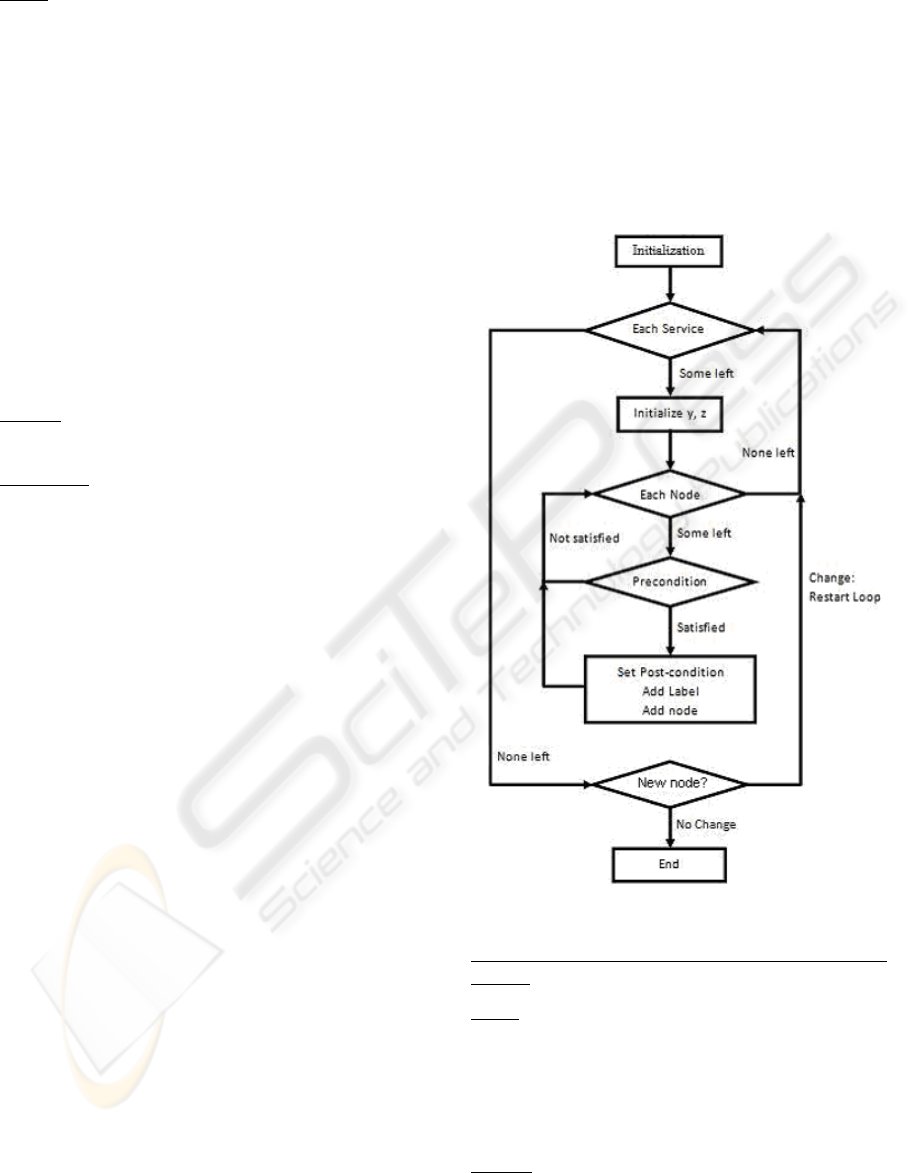
3.2 Flow Chart of the Graph
Generation Algorithm
The control flow of the graph generation algorithm
is elucidated in Figure 1.
3.3 Fuzzy Clustering Algorithm
The output of graph generation algorithm (Section
3.1) is used as input to the FCM algorithm
(Bhattacharya et al., 2008). The output is arranged
into a matrix. The columns of the matrix are various
attributes of the attack graph. These attributes
include service running on a particular machine,
source identification (I.D.) of the machine, privilege
on the machine, target identification of the machine,
and privilege on target machine. The data points are
grouped into various clusters (user defined). These
clusters have “fuzzy” boundaries, in the sense that
each data value belongs to every cluster to some
degree.
Figure 1: Graph generation algorithm.
FCM Algorithm (adopted from (Bhattacharya et al.,
2008)):
Input:
(Graph nodes and edges)
1) Let x
k
be the k
th
(possibly m – dimensional
vector) data point (k = 1, 2, …, n). In our
case nÅ22, and m Å 5 (Refer Table 2).
2) Membership matrix.
3) Number of clusters.
Output:
1) n data points are clustered into c fuzzy
clusters where (c<n).
ATTACK GRAPH GENERATION WITH INFUSED FUZZY CLUSTERING
95

Algorithm:
1) The first phase is initialization. In
initialization phase the membership matrix
M, and number of clusters are initialized
with random values 0 and 1.
2) The initialization phase is followed by
iteration phase. In this phase cluster is
computed according to the objective
function until the objective function reaches
a specified (user defined) threshold.
3) The termination phase is the last phase. It
signifies that algorithm has reached a stable
phase
4 RESULTS
4.1 Test Network
The network shown in Figure 2 is a simulated
network consisting of one attacker, one host and a
screened subnet having three hosts. It has been
adopted from the network considered by Sheynar
(Sheynar, 2004). The network consists of four hosts:
Host 0 (H0), Host 1(H1), Host 2 (H2), and Host
3(H3). The system characteristics are shown in
Table 1; the Connectivity Matrix.
4.2 Connectivity Matrix
The Connectivity Matrix shown in Table 1 is the
input to graph generation algorithm.
Table 1: Connectivity Matrix.
To→
Attacker
H0
H1
H2
H3
From
↓
Attacker
- IIS_Web_Service None None None
H0
- - ftp,ssh net Squid
H1
- IIS_Web_Service - net Squid
H2
- IIS_Web_Service ftp,ssh - Squid
H3
- IIS_Web_Service ftp,ssh ---- -
4.3 Results of Graph Generation
Algorithm
The result of graph generation algorithm (Section
3.1) on Table 1 (Connectivity Matrix) is shown in
Table 2. Each row in the table represents one run of
the graph generation algorithm. Further, results
shown in Table 2 are used to generate Figure 3
(Attack Graph).
Table 2: Data points for clustering.
Sl.No. Service
Number
Source
ID
Source
Privilege
Target
Number
Target
Privilege
1 0 4 2 0 2
2 1 0 2 1 1
3 2 0 2 1 2
4 3 0 2 3 2
5 3 1 2 3 2
6 4 0 2 2 1
7 4 1 2 2 1
8 0 1 2 0 2
9 0 2 1 0 2
10 0 3 2 0 3
11 0 4 2 0 2
12 1 0 2 1 2
13 1 2 1 1 2
14 1 3 2 1 2
15 2 0 2 1 2
16 2 2 1 1 2
17 2 3 2 1 2
18 3 0 2 3 2
19 3 1 2 3 2
20 3 2 1 3 2
21 4 0 2 2 1
These attributes in Table 2 include service
running on a particular machine (Service number),
source identification (Source ID) of the machine,
privilege on the source machine (Source privilege),
target identification of the machine (Target number),
and privilege on target machine (Target privilege).
The various attributes in Table 2 are given some
number as per the conventions mentioned below:
1) The service number can be of the
following four types:
a) IIS_Web_Service : 0
b) ftp: 1
c) ssh: 2
d) sqid: 3
e) netbios:4
2) The Source ID and Target Number can be
of following four types:
a) Host 0 : 0
b) Host 1: 1
c) Host 2: 2
d) Host 3: 3
e) Attacker :4
3) The Source Privilege of following four
types:
a) No Privilege: 0
b) User Privilege: 1
c) Root Privilege: 2
SECRYPT 2009 - International Conference on Security and Cryptography
96
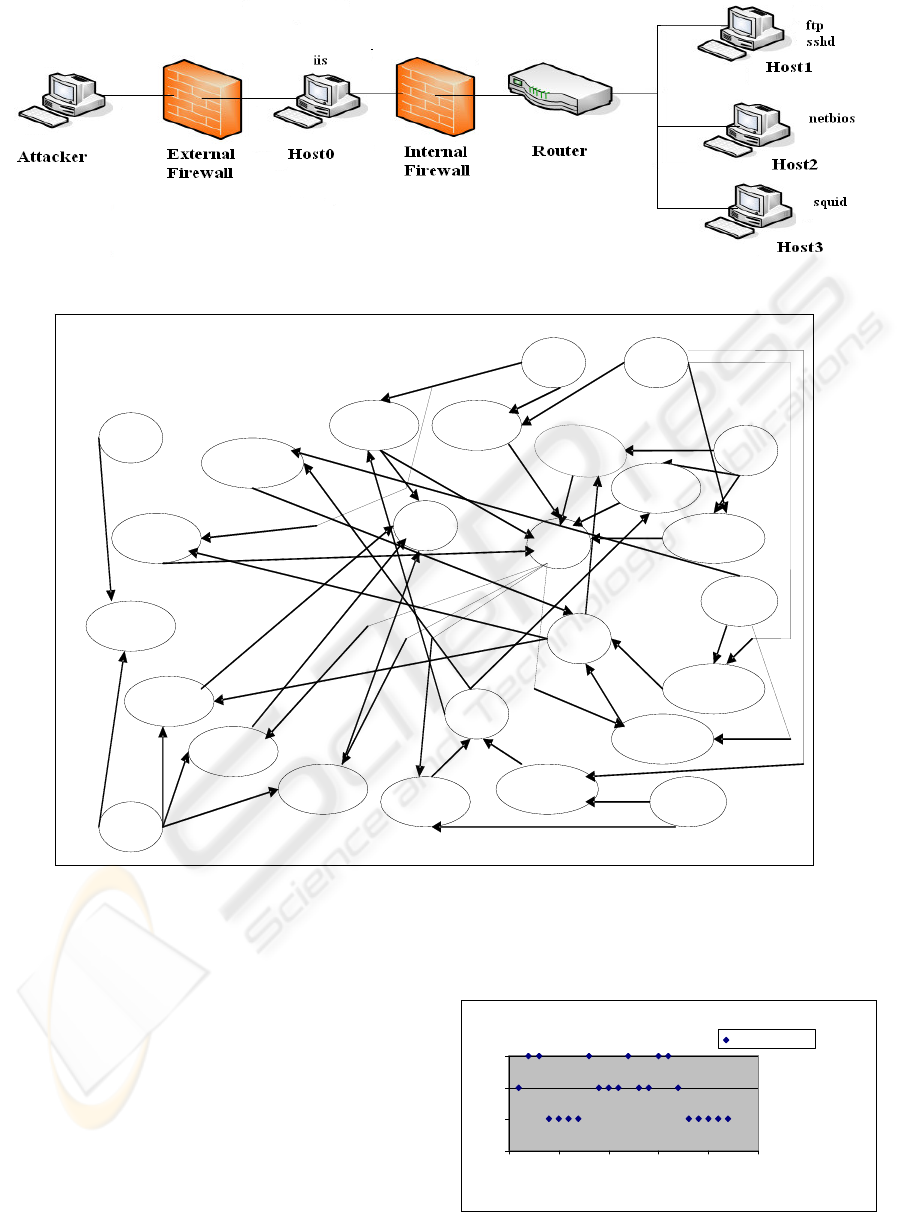
Figure 2: Test network.
ftp(1)
(0,2)
Figure 3: Attack Graph Generation.
4.4 Results of FCM Algorithm
The result of FCM algorithm on the output of the
graph generation algorithm, Table 2 (Data Points for
Clustering) results in cluster formation shown in
Figure 4 and Figure 5.
As can be inferred from the clusters formed, if we
use the number of clusters to be equal to the number
of hosts in the network, then each cluster
approximately aggregates on a per host basis. This is
shown in Figure 4. On the other hand, if a different
grouping is used (in case of three partitions), clusters
aggregate approximately on the basis of different
levels in attack paths used, such as entry level, mid
level and exit level. This is shown in Figure 5.
Data Point Clustering Using Clustering Size =3
0
1
2
3
0 5 10 15 20 25
Data Points
Cluster Number
Cluster Number
Figure 4: Data Points Clustering using Cluster Size = 3.
IIS_b(2,0)
IIS_b(4,0)
IIS(0)
(4,2)
(0,2)
ftp_r(0,1)
ssh_b(0,1)
ssh(1)
(1,2)
squid_r(0,3)
Squid(3)
(3,2)
squid_r(1,3)
net_n(0,2)
net(2)
(2,1)
net_n(1,2)
IIS_b(1,0)
IIS_b(3,0)
ftp_r(2,1)
ftp_r(3,1)
ssh_b(2,1)
ssh_b(3,1)
squid_r(2,3)
ATTACK GRAPH GENERATION WITH INFUSED FUZZY CLUSTERING
97

Data Point Clustering Using Cluster Size =5
0
1
2
3
4
5
0 5 10 15 20 25
Data Points
Cluster Number
Cluster Number
Figure 5: Data Points Clustering using Cluster Size = 5.
5 CONCLUSIONS AND FUTURE
WORK
In this paper, we have proposed a graph generation
algorithm. Our algorithm runs in Ο (n
3
)
computational time. The algorithm currently does
not prevent cycles. Moreover, clustering improves
visualization on attack graph. Clustering greatly
reduces overhead in IDS operations by reducing the
amount of data to process as in each case as it
generates super nodes.
We are currently working on improving the
computational efficiency of the algorithm by
utilizing matrix multiplication methods so that
building graphs for large network takes less time.
Further on the output data set of our proposed
algorithm, we intend to perform “false threat” and
“missed threat” detection in context of IDS alarms.
REFERENCES
M. S. Obaidat and N. Boudriga,” Security of e-Systems
and Computer Netwokrs,” Cambrdige Univeristy
Press, 2007.
S. Bhattacharya, S. Malhotra, S.K. Ghosh, “A Scalable
Representation towards Attack Graph Generation”,
Proceedings of the 2008 1st International Conference
on Information Technology, (IT 2008), 19-21 May
2008, Gdansk, Poland.
J.C. Bezdek, “Patten Recognition with Fuzzy Objective
Function Algorithms”, Plenum Press, New York,
1981.
O. M. Sheynar, “Scenario Graphs and Attack Graph,” PhD
Thesis, Carnegei Mellan University, USA, April 2004.
R. P. Lippmann, and K. W. Ingols, “An Annotated review
of past papers on attack graphs,” Project report IA-1,
Linchon Laboratory, MIT, 31
st
March 2005.
J. Han, M. Kamber, Data Mining: Concepts and
Techniques, Morgan Kaufmann Publishers 2001.
J. C. Dunn., “A fuzzy relative of the ISODATA process
and its use in detecting compact well seperated
clusters”, J. Cybernetics, Vol. 3, pp. 32-57, 1974.
I. S. Moskowithz, and M. H. Kang., “An insecurity flow
model”, In Proceedings of the 6
th
New Security
Paradigms Workshop, Langdale,UK, pp. 61-74, 1997.
C. Phillips, L. P. Swiler, “A graph-based system for
network-vulnerability analysis”, In Proceedings of the
Workshop on New Security Paradigms (NSPW), pp.
71-79, 22-26 September 1998.
L. P. Swiler, C. Phillips, D. Ellis, and S. Chakerial ,”
Computer- Attack Graph Generation Tool,”
Proceedings of the Second DARPA Information
Survivability Conference and Exposition (DISCEX II),
Volume II, pp. 307-321, IEEE Computer Society,
2001.
X. Ou, W. F. Boyer, M. A. McQueen, “A Scalable
Approach to Attack Graph Generation”, Proceedings
of the 13th ACM conference on Computer and
Communications Security (CCS), Alexandria,
Virginia, USA, pp. 336-345, 30 October - 3 November
2006.
O. Sheyner, J. Haines, S. Jha, R. Lippmann, and J.
M.Wing, “Automated generation and analysis of
attack graphs,” In Proceedings of the 2002 IEEE
Symposium on Security and Privacy, pages 254–265,
2002.
SECRYPT 2009 - International Conference on Security and Cryptography
98
