
GIS MODEL FOR EFFECTIVE POLICE DEPARTMENT'S
PERFORMANCE
Balqies Sadoun and Samih Al-Rawashdeh
Surveying and Geomatics Engineering Department, Al-Balqa’ Applied University, Al-Salt, Jordan
Keywords: Geographic Information System (GIS), Global Positioning System (GPS), Police Department (PD), Remote
Sensing (RS), Satellite Images.
Abstract: Police department's (PD's) performance has become more and more important due to the increase in crimes
and their fast spreading. In order to allow improved police services, modern technologies need to be utilized
to serve this goal. In this work we are employing a Geographic Information System (GIS) to permit efficient
planning, informed decision making and optimal performance, especially in emergencies. GIS creates an
efficient database system that is easy to manage, manipulate, analyze, present and update for in action
policeman as well as for a planner. All information is provided accurately and it is organized and located
geographically in a timely manner. GIS provides a number of specialized tools to help dispatchers collect
and relay all kind of information to the officers on the scene of crime, or in a natural disaster when help is
needed desperately. The locations of schools, hospitals, gas stations or neighborhoods with different
socioeconomic status influences the patterns and rate of incidents (road accident, fire, crime, burglar…etc).
Hence, using GIS technology is a must if we need to save time and life.
Maps and analysis results provided by GIS can play a major role in reducing crime and improving the
effectiveness of the Police activities. In this work, we built a GIS Model for the police stations in the city of
Amman, Jordan, as an application to improve their efficiency, especially in emergencies. GIS allows
informed decision making and better planning in different ways: relocation, redistribution, initiation of PD's
etc. Multiple data sources were used to enrich the built GIS including available and field collected data
(remotely sensed data with medium and high resolutions, LandSat ETM+ IKONOS images, and ground
control points measured using global positioning systems etc.). A transportation network model was
included to help in promoting the efficiency and to employ the state of the arts technologies and local based
services in the PD’s work. We analyzed the current locations of PD stations (we call them here PDs) and
proposed better locations as well as proposed new ones (Sadoun, 2006; Al-Hanbali and Sadoun, 2006;
Sadoun and Saleh, 2005; Saleh and Sadoun, 2006).
1 INTRODUCTION
The rates of crime, fire, burglar incidents are rising
with time and new technologies are needed to be
employed to promote people safety and provide
ways to minimize their occurrences. In general, the
distribution of incidents across the landscape is not
geographically random since incidents are human
phenomena. Police departments are on the duty of
protecting the citizen’s safety and taking safety
measures to reduce the risk of breaking the law. It
has long been common exercise for the police to
identify locations and times that are more prone to
criminal activities. GIS technology with the help of
geodatabase of the PD's can definitely improve the
effectiveness of police work in protecting cities and
enhancing citizen security and safety (Sadoun,
2006; Al-Hanbali and Sadoun, 2006; Sadoun and
Saleh, 2005; Saleh and Sadoun, 2006).
GIS is a technology that is used to observe and
analyze data from a geographic perspective. It ties
location to information (such as people to addresses,
buildings to parcels, or streets within a network) and
layers in order to give a better understanding of how
it all interrelates according to a purpose. A GIS is
most often associated with maps and an Information
System for Geography. The Maps are constructed
and used as windows into the database to support
queries, analysis, and editing of the information
(Sadoun and Saleh, 2005; Saleh and Sadoun, 2006).
5
Sadoun B. and Al-Rawashdeh S. (2009).
GIS MODEL FOR EFFECTIVE POLICE DEPARTMENT’S PERFORMANCE .
In Proceedings of the International Conference on e-Business, pages 5-12
Copyright
c
SciTePress
What can GIS do for emergency management
and planning? Five Phases of emergency
management were proposed (Donohue, 2002):
alleviation protection from hazards and their effects,
avoidance of any incident from occurring, vigilance
plans to save lives and facilitating rescue, rapid
response immediately after an event occurs,
recovery and rebuilding communities to return to
normal life and protection against future hazards. All
phases rely on critical data from various sources
which are simply managed using GIS.
The Louisiana Department of Transportation
developed a GIS application (New Orleans Regional
Planning Comission Agency, 2006) to identify city
streets, highways, and infrastructures and to be used
as a tool in analysis of traffic patterns, future
construction projects, and land use. The utilization
of this application was enormous after Hurricane
Katrina ravaged the city of New Orleans. It was used
by emergency responders linking street addresses
with global position coordinates, in order to locate
citizens during the Katrina storm and flooding. It
was a critical, life-saving tool which was used by
decision-makers and first responders in such
unforeseen situations. Clearly, flexibility of GIS
during unforeseen conditions is one of the benefits
of such a dynamic tool.
GIS is very important in every day emergencies
circumstance such as emergency health care
provision, monitoring demands and intervention
over time (Moore). It can determine the "response
times" needed for individual stations to service their
areas within target timescales or may be analyzing
data from road traffic accidents to find the hot spots
where more control is needed.
The global Internet and GIS can work jointly to
provide access to distributed data (spatial & non-
spatial) located at geographically isolated locations
and shared dynamically for better decision making
nationally or internationally in all times (Ghosh and
Samaddar). A local preparedness objective is to
accomplish and carry on risk-based target levels of
capability in order to avert, protect against, respond
to, and pull through from main human-caused or
natural events in order to reduce the danger and
shock to lives, property and the local economy
(Oblinsky, 2007).
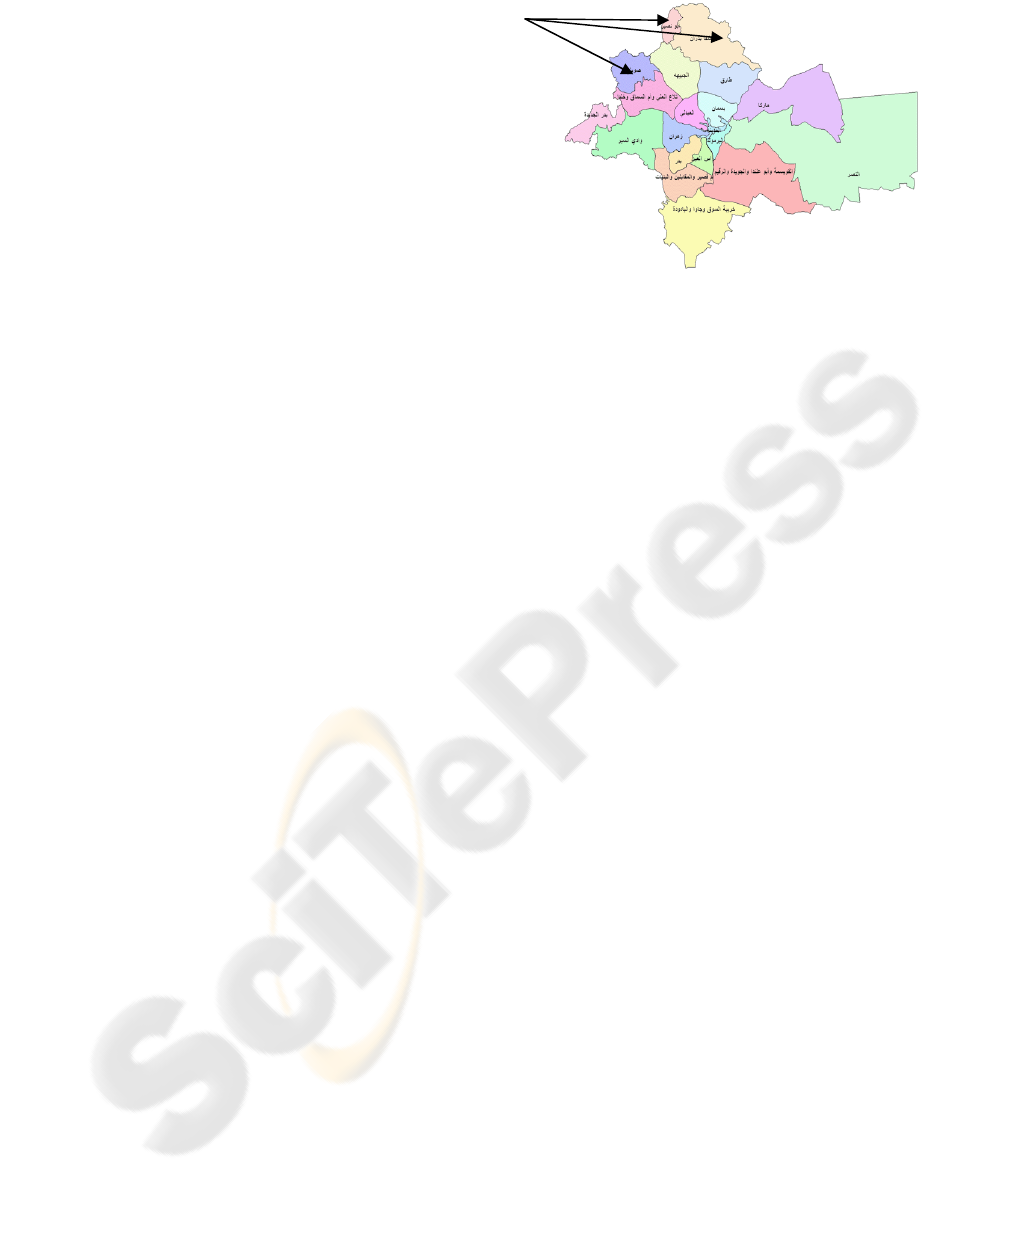
In this paper, we are building a GIS Model for
the PD’s in part of the city of Amman, the capital of
Jordan, as a case study. The chosen parts are the
regions of Shafa Badran, Abu Nsair and Swieleh
(Fig.1), which are located in the north part of the
city.
Figure 1: The study areas: Shafa Badran, Abu Nsair and
Swieleh regions of Amman.
These regions represent the highly populated
regions which include middle and lower-class
population with a medium rate of incidences and
crimes. The population of the area under study
exceeds 600,000 inhabitants and it covers about 60
km
2
. The location, service boundary and many
attributes are included in the database to allow
analysis and improvement, in addition to immediate
reflections (response time) and guidance in
emergencies. The ultimate goal of a law
enforcement GIS is to use the power of analysis and
planning to reduce crime. City planners and
engineers can establish a visible police presence in
troubled areas by monitoring crime sources and
reacting immediately in case of emergency.
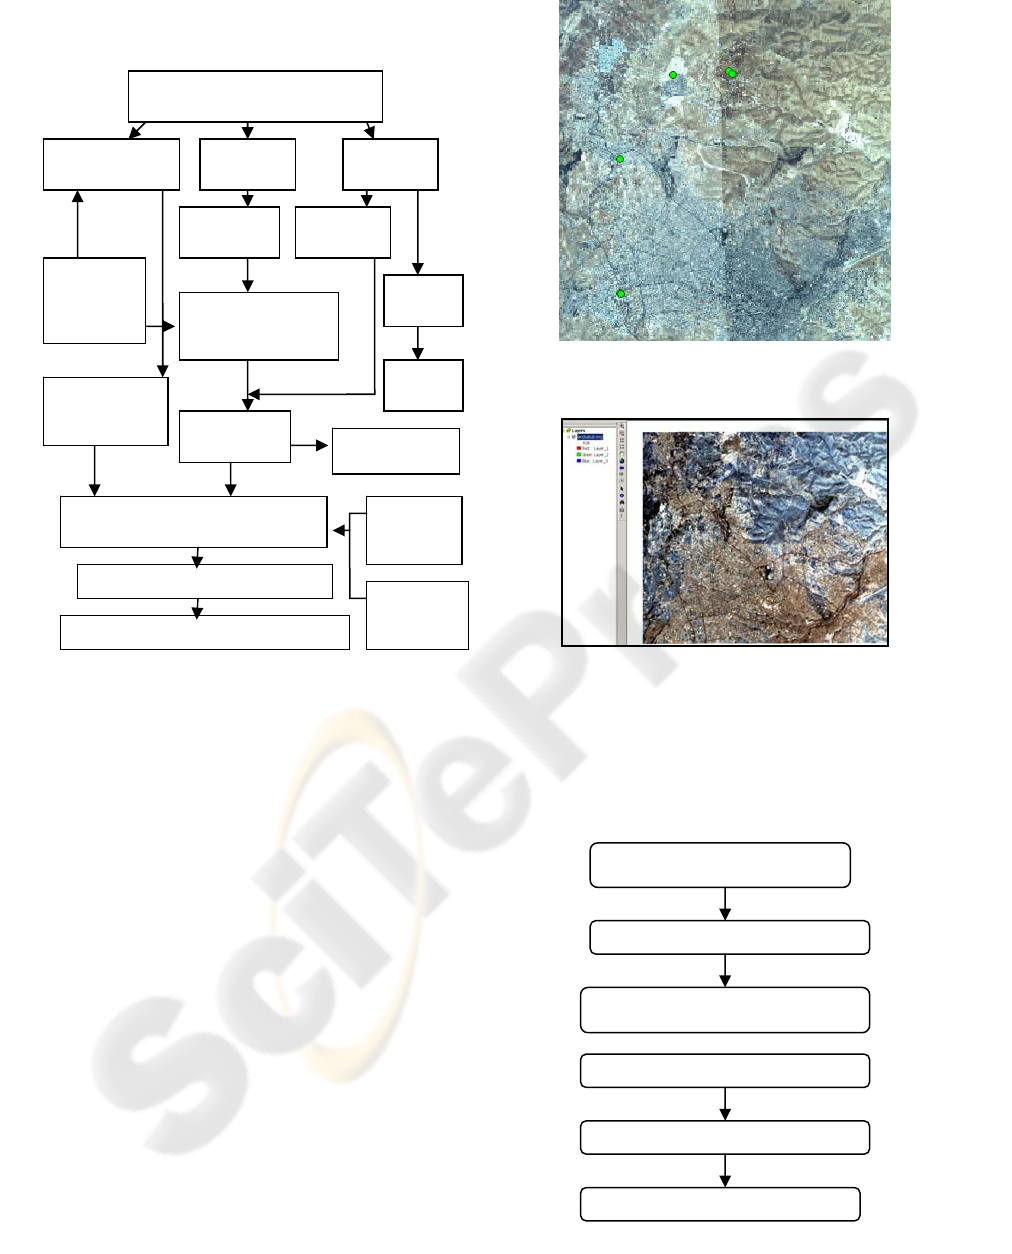
2 METHODOLOGY AND DATA
PROCESSING
The methodology starts by collecting data from
satellite images, aerial photographs and paper maps,
then building a transportation network using GIS.
Next step is to perform analysis on data; see
flowchart depicted in Figure 2.
Data Acquisition. The data were collected in analog
form then encoded in our computer. Spatial data
from IKONOS and LandSat images, topographic
maps, ground control points (GCPs), Amman tourist
map (scale 1:25000) and from the field attribute data
were used. Four IKONOS images resolution 1 meter
covering an area of 10*10 km for the north of
Amman were used in this work to produce the
studied area (Fig. 3). Medium resolution satellite
images LandSat ETM+ are shown in Figure 4.
Ground Control Points were taken using hand held
GPS with an accuracy of 5-6 m for Georeferencing
ICE-B 2009 - International Conference on E-business
6
and registration of the satellite images and the PD’s
locations.
Figure 2: Flowchart of our methodology.
Attribute data obtained from maps include roads
names, districts names, land marks and
administrative units. Field data about police stations
were collected from each police station such as:
police station area of coverage, area of
specialization, population within the administrative
boundaries, among others. Additional field data was
needed such as the census data especially about
streets, addresses and locations. From the acquisition
phase we should know the needed data and how it
will be entered and used (import of existing data,
digitizing or scanning). Data entry and development
goes through edits and several stages of quality
control. Then, Geo-referencing is to put the data in a
geographic reference system that is meaningful to
the organization (after the data entry and edits
procedures). The processing procedure is
summarized by the flowchart shown in Figure 5.
Figure 3: The produced single image from 4 IKONOS
images (PD’s locations).
Figure 4: Landsat image.
By using LandSat image shown in Fig. 6, we
were able to trace the main streets due to the high
resolution of 30 m. Then we traced the local streets
from Amman tourist map. Next, we built a main and
secondary streets layer as depicted in Fig. 7.
Figure 5: The flowchart of the processing procedure.
Data Processing
Definition of the Coordinate System
Measurements of the reference
points
(
GPS
)
Registration of the images
Digitizing
The output Layers & GIS
Input Data
Paper
Map
Satellite
Images
Vector layer
Result
paper Map
Building Geospatial Database
Adding
GPS points
Scanning
Geo referencing
And Registration
Coordinate
System
Definition
Digitizing
Cleaning and
Editing
IKONOS
Land
sat
Result
Editing & maintenance
Adding
Attribute
data
Analysis –Documentation- Plotting
GIS MODEL FOR EFFECTIVE POLICE DEPARTMENT'S PERFORMANCE
7
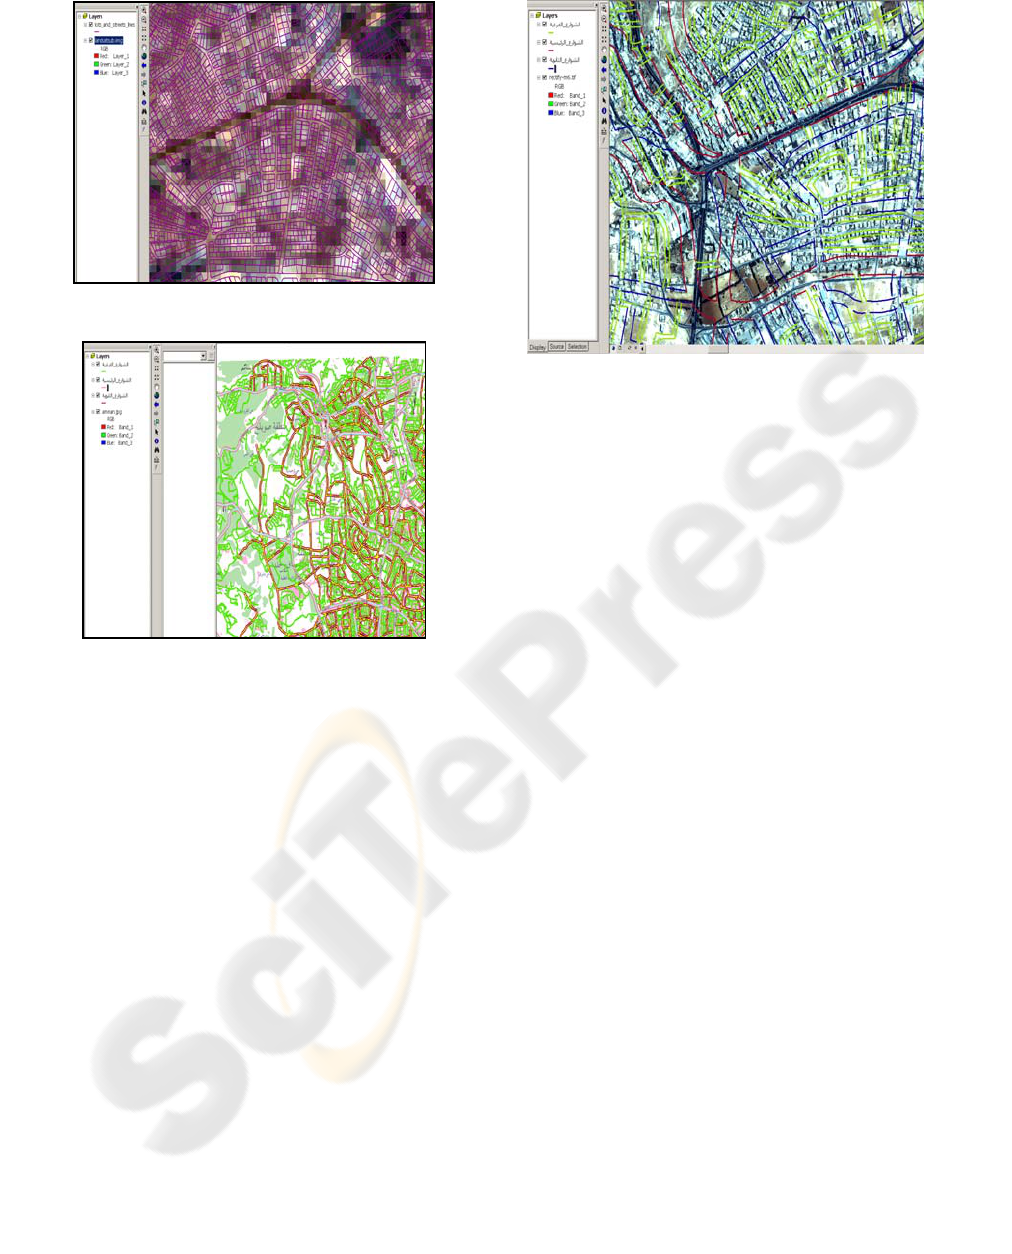
Figure 6: Landsat image shows only main streets.
Figure 7: Main, Secondary, and Local Streets layers Built
from Amman tourist map.
A rectification of this map was made using map
to image registration. A transportation layer was
extracted (streets edges) from the rectified and
scanned tourist map. We used the produced street
layers from the tourist map and overlaid it with
IKONOS images; see Fig.8. We found that some
local streets were missing and in other cases the
streets were larger than realty. We needed to trace a
street centerline layer from a high precise registered
image. Then IKONOS images were chosen to carry
on this project.
Building the Geodatabase. Image Registration: We
used four IKONS images to be one georeferenced
image (Fig. 3) in order to produce the street
network; the image was registered using Ground
Control Points (GCPs).
Figure 8: IKONOS images overlaid by the street layers
from the tourist map.
Geo-Referencing. Raster data is obtained by
scanning maps or collecting aerial photographs and
satellite images. The location information delivered
with aerial photos and satellite imagery is often
inadequate. Thus, in order to establish the
relationship between an image (row, column)
coordinate system and a map (x, y) coordinate
system, we need to georeference the raster data
(image). Ground Control Points (GCPs) were used
to establish a relationship between the image
coordinate system and the geographic coordinate
system.
Digitizing. This is the process of encoding
geographic features into a digital form. It is carried
out to create spatial data from existing hardcopy
maps and documents. Our geo-referenced raster
images were digitized using Arc View 9.1(on-line
digitization) package. A road network of the area
under study was digitized as line features; see Fig. 9.
Administrative units, forests, gardens, are digitized
as polygon features to create the needed layers. Gas
stations, Governmental facilities, hospitals, hotels,
hydrants, ministries, mosques, schools-universities,
and trade (shopping) centers were digitized as point
features; see Fig 10. The PD’s were located on
IKONOS images using GPS and were made into a
layer. Then, the service area of each PD's (Abu Nsair
39 km
2
, Sweileh 22 km
2
and Albeader) was created
in another layer; see Fig.11.
ICE-B 2009 - International Conference on E-business
8
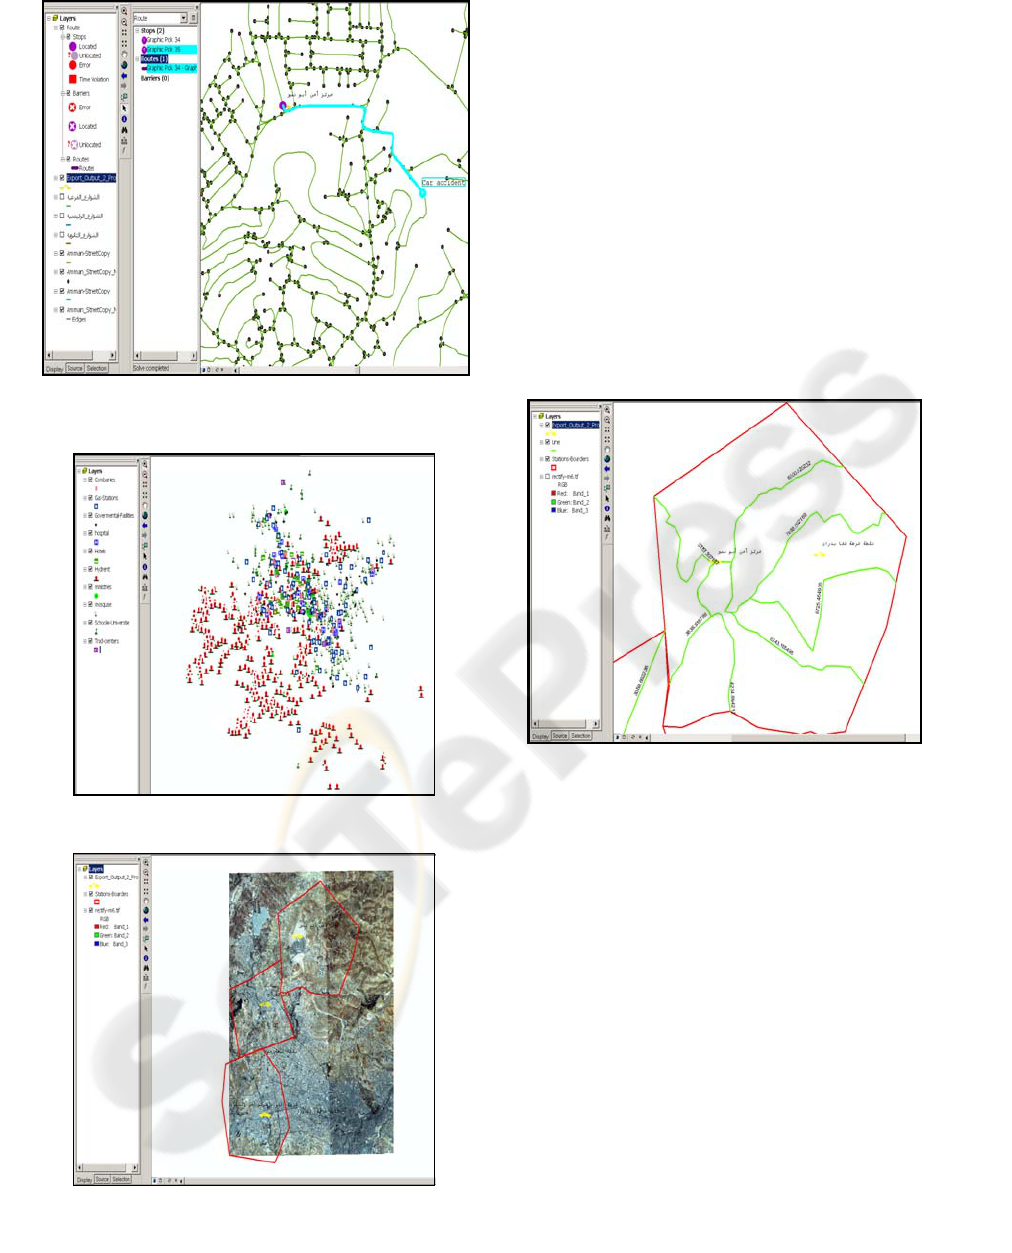
Figure 9: The network layer analysis showing the best
route.
Figure 10: Point land marks.
Figure 11: Police stations and service boundaries layers.
3 ANALYSIS AND DISCUSSION
GIS analysis is the process of looking at geographic
patterns in the GIS database and the relationships
between features, which is done by making a map,
models or by combining many data layers.
The location of the PD’s were analyzed and
found to be distributed arbitrary meanwhile, their
locations should be in the center of their
administrative boundaries measured using the street
length and not direct distance to the edges; see
Fig.12.
We proposed new boundaries for the PD’s using
point circle buffers around each PD’s (2,800 m
radius) and fitting buffers with main streets edges to
get easy access as shown in Fig.13.
Figure 12: The main streets length from each PD to the
edges of its boundary.
We suggested the initiation of new police
stations and upgrading the already existing ones by
considering urban and population growth
(Aljbaihah) or newly established areas such as the
Hussein Gardens/Park, which has an area of about
20 km
2
and serves 50,000 residents. The selection
was based on fitting circular buffer of service area
with the main streets axis from the region; see
Fig.14.
We created the new service areas using the
network analysis provided by GIS. Suggestions for
one way streets were made. Endless functions could
be used for providing protection and safety.
Amman Network was created as well to find the
best route considering roads directions, the time or
distance. Figure 9 illustrates the shortest route
between a police station and an assumed accident
with directions to quickly and accurately reach the
place; see Fig. 15.
GIS MODEL FOR EFFECTIVE POLICE DEPARTMENT'S PERFORMANCE
9
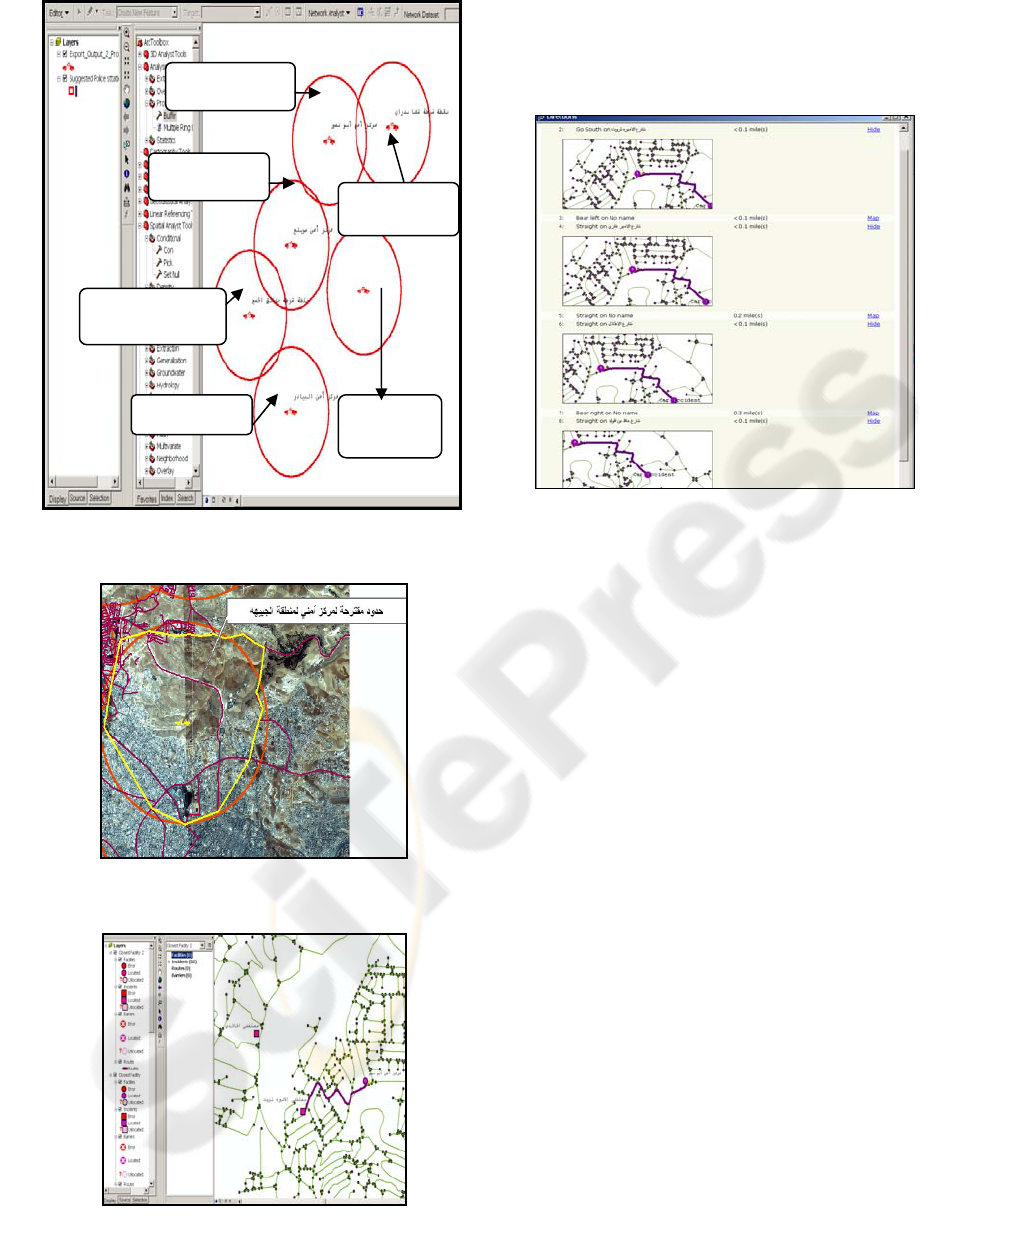
Figure 13: Old and new PD’s according to best fit
boundary to the buffer zone and streets.
Figure 14: The best fit boundary to the buffer zone and
streets.
Figure 15: The direction to be followed to reach the
assumed accident.
Figure 16 illustrates how to find the closest
facility application such as; closest hospital to Abu
Nsair PD, the closest hospital to a car accident, etc.
GIS offers more than we can ask
Prop. P.D
Ab-Nsair.
Ab-Nsair PD
Prop. P .D.
Hussein
Gardens
Prop. P.D
Gubeha
Al-Biadr PD
Sweilh P.D.
Figure 16: The closest hospital to an accident location.
4 CONCLUSIONS
In this paper, we applied GIS technology to help in
planning and optimizing police station locations in
the city of Amman. This is important in order to
have the optimum and bets locations as well as to
make sure that these stations are distributed properly
and can meet future growth of the city, demands and
situations.
The principal spatial and non spatial data
obtained from the Police Directorate, governmental
organizations and private sectors were organized and
managed using ArcGIS 9.1 software package. The
latter is efficient as it helps us to make accurate and
proper analysis and presentation.
Basically we developed a GIS and Geodatabase
for the PD’s in the northern part of the city to allow
the improvement of the PD’s work. A road network
for the capital city was created using different
technologies (Land sat and IKONOS images, remote
sensing etc.) in order to improve the PD’s efficiency
and planning. Clearly with the obtained GIS system,
maintenance and enhancement of base maps can be
performed easily with almost no time.
The created GIS will be useful in the
development of any web-based GIS application such
as vehicle crash location, safety analysis, etc. It also
permits data sharing and partnership with national or
international agencies.
ICE-B 2009 - International Conference on E-business
10

State of the art applications such as tracking,
traffic management, and location based services will
be possible.
Accurate Geo-referenced high resolution digital
image archive of the road network is created to
allow real efficiency and services.
The analysis of the PD’s locations in their zone
of influence led to the suggestions for new better
locations according to international criteria. In
addition, suggestions to establish new stations were
made. The system provides quick and accurate
search engine. This is very useful in matters related
to finding the shortest path to a hospital or the
closest gas station facility based on the selected
criteria such as distance or cost.
Finally, GIS can be used by law enforcement
agencies and community planners as will as by
private citizens to decrease crime and enhance police
work awareness with local communities.
REFERENCES
Balqies Sadoun, “GIS Applications to City Planning
Engineering,” Encyclopedia of Human Computer
Interaction, Idea Group Inc., pp. 234-241, January
2006.
Nedal Al-Hanbali and Balqies Saodun,” A GIS-Based
Interactive Database System for Planning Purposes,
“Encyclopedia of Human Computer Interaction, Idea
Group Inc., pp. 242-255, January 2006.
Balqies Sadoun and Bassam Saleh,” Geographic
Information System (GIS) for Tourism Planning
Purposes,” Proceedings of the 2005 International
Conference on Information Technology, ICIT 2005,
pp. 306-313, Amman, Jordan, May 2005.
B. Saleh and Balqies Sadoun,” Design and
Implementation of a GIS System for Planning,”
Journal of Digital Libraries, Springer-Verlag, Vol. 6,
No. 2, pp. 210-218, April 2006.
Keith Donohue, "Using GIS for all-hazard emergency
management", NRS 509, fall 2002
http://www.edc.uri.edu/nrs/classes/NRS409/509_2002
/Donahue.pdf
New Orleans Regional Planning Commission Agency,
"GIS Use in the Hurricane Katrina Response and
Recovery Efforts", March 10, 2006.
http://coastal.lic.wisc.edu/urpl969-katrina/urpl969-
spring06-NORPC-paper.pdf
David Moore, "GIS in Emergency Planning: A Spatial
analysis of Ambulance services. Spatial planning
solutions",
http://www.spatial.ie/downloads/GIS%20in%20Emerg
ency%20Planning.pdf.
Subrato Ghosh and Arun B Samaddar, "Distributed and
Interoperable GIS for Planning and Emergency in
Indian Mines",
http://gsdidocs.org/gsdiconf/GSDI-
7/papers/TSsdSG.pdf .
Michelle Tilley Oblinsky, "GIS as a Tool for Emergency
Management", Emergency planner/GIS coordinator
city of Cheasapeak, VA.
http://www.scag.ca.gov/rtptac/pdf/2007/tac051707_Se
curityPreparednessWhitePaper.pdf.
GIS MODEL FOR EFFECTIVE POLICE DEPARTMENT'S PERFORMANCE
11
