
CULTURAL SWARMS
Knowledge-driven Framework for Solving Nonlinearly Constrained Global
Optimization Problems
Mostafa Z. Ali, Yaser Khamayseh
Computer Information Systems, Jordan University of Science & Technology, Irbid, Jordan
Robert G. Reynolds
Department of Computer Science, Wayne State University, Detroit, Michigan, U.S.A
Keywords: Evolutionary computation, Nonlinearly constrained global optimization problem, Cultural swarms, Social
interaction, Knowledge source interaction.
Abstract: In this paper we investigate how diverse knowledge sources interact to direct individuals in a swarm
population influenced by a social fabric approach to efficiently solve nonlinearly constrained global
minimization problems. We identify how knowledge sources used by Cultural Algorithms are combined to
direct the decisions of the individual agents in solving optimization problems using an influence function
family based upon a Social Fabric metaphor. The interaction of these knowledge sources with the
population swarms produced emergent phases of problem solving. This reflected an algorithmic process that
emerged from the interaction of the knowledge sources under the influence of a social fabric using different
configurations. This suggests that the social interaction of individuals coupled with their interaction with a
culture within which they are embedded provides a powerful vehicle for the solution of nonlinearly
constrained optimization problems. The algorithm can escape from the previously converged local
minimizers, and can converge to an approximate global minimizer of the problem asymptotically.
Numerical experiments show that it is better than many other well-known recent methods for constrained
global optimization.
1 INTRODUCTION
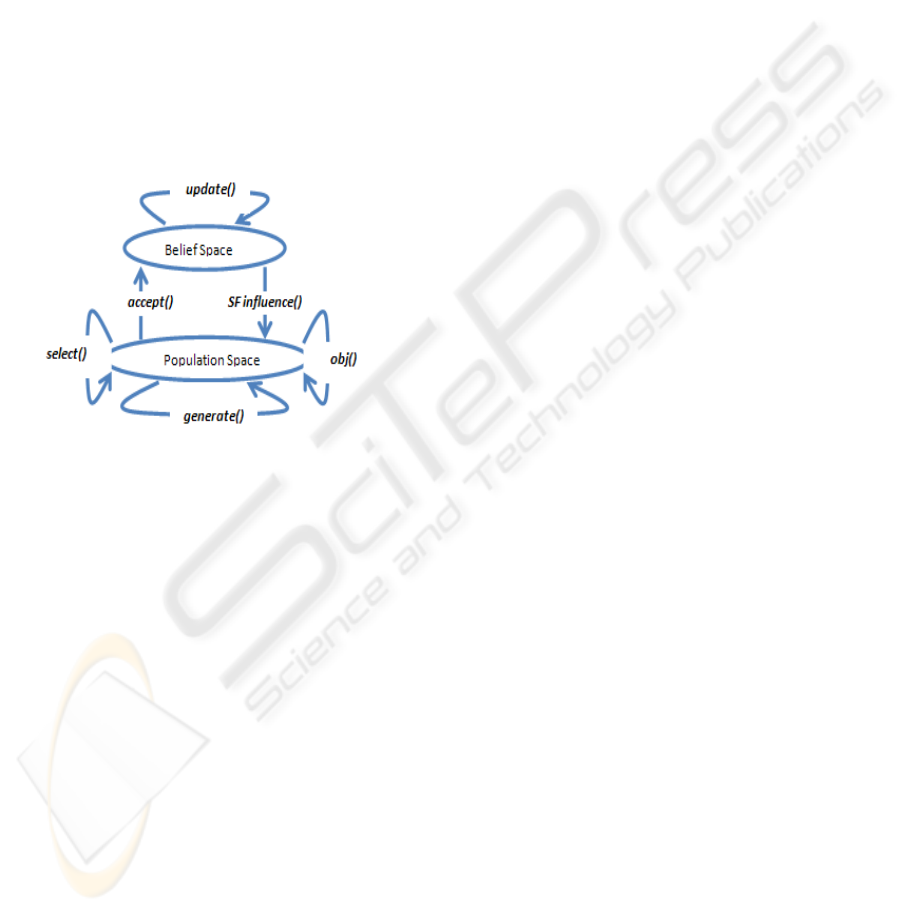
The Cultural Algorithm (CA) is a class of
computational models derived from observing the
cultural evolution process in nature. It is a dual
inheritance system that characterizes evolution in
human culture at both the macro-evolutionary level,
which takes place within the belief space, and at the
micro-evolutionary level, which occurs at the
population space. Knowledge produced in the
population space at the micro-evolutionary level is
selectively accepted or passed to the belief space and
used to adjust the symbolic structures there. This
knowledge can then be used to influence the changes
made by the population in the next generation. The
basic framework is shown in Figure 1.
Previous work by Reynolds (Reynolds and
Saleem, 2003) identified five basic categories of
knowledge that were useful in decision making.
They were normative knowledge (ranges of
acceptable behaviours), situational knowledge
(exemplars of successful and unsuccessful
solutions), domain knowledge (knowledge of
domain objects, their relationships, and interactions),
history knowledge (temporal patterns of behaviour),
and topographical knowledge (spatial patterns of
behaviour). This set of categories is viewed as being
complete for a given domain in the sense that all
available knowledge can be expressed in terms of
one of these classifications.
Reynolds (Reynolds and Saleem, 2003) looked at
the roles and contribution of these five generic
knowledge classes (normative, topographical,
domain, situational, and history knowledge) to the
optimization problem-solving process using
Evolutionary Programming (EP) as the population
model. They observed the emergence of certain
103
Z. Ali M., Khamayseh Y. and G. Reynolds R. (2009).
CULTURAL SWARMS - Knowledge-driven Framework for Solving Nonlinearly Constrained Global Optimization Problems.
In Proceedings of the International Joint Conference on Computational Intelligence, pages 103-110
DOI: 10.5220/0002282301030110
Copyright
c
SciTePress
problem solving phases in terms of the relative
performance of different knowledge sources over
time. They labelled these phases as the coarse
grained, fine grained, and backtracking phases. Each
phase is characterized by the dominance of a suite or
subset of the knowledge sources that are most
successful in generating new solutions in that phase.
In fact, the dominant subset of knowledge sources is
often applied in a specific sequence within each
phase. It appears that one knowledge source
produces new solutions that are consequently
exploited in by another knowledge source.
Transitions between phases occur when the solutions
produced by one phase can be better exploited by
knowledge sources associated with the next phase.
These phases emerged in static, dynamic, and
deceptive problem environments.
Figure 1: The framework of cultural algorithm.
The coarse grained phase often dominates at the
beginning of the search process or when the problem
solving landscape changes dynamically, and a search
for a new solution must begin anew. In the coarse
grained phase topographical knowledge dominates,
producing the best new solution over 50% of the
time. Situational knowledge is the second most
successful, producing the best new solution over
25% of the time. In the fine-grained phase
situational knowledge is the most successful at
generating the best new individual, while Normative
and Domain knowledge are a distant second best. In
the backtracking phase all of the knowledge sources
are equally successful at generating new solution.
Static problems are the exception, in which cases the
history component has little effect. Likewise, in non-
deceptive environments backtracking occurred less
frequently than the other two phases.
Cultural Algorithms can provide a flexible
framework in which to study the emergence of
complexity in a multi-agent system (MAS)
(Reynolds, 1986). In this scenario the Cultural
Algorithms framework has been embedded with the
recursive porous agent simulation tool (Repast)
(North, Collier, and Vos, 2006), producing a toolkit
that is called Cultural Algorithms Toolkit (CAT).
This tool is used to view the power Cultural
Algorithms in solving many Engineering problems
and other type of problems (Reynolds and Ali
,
2007).
While many successful real-world applications
of Cultural Algorithms have been produced, we are
interested in studying the fundamental
computational processes involved the use of Cultural
Systems as problem solvers. In previous work the
influence of the knowledge sources have been on
individuals in the population only. The goal of this
paper is to examine how Cultural Algorithms solve
nonlinearly constrained global optimization
problems. In our investigation here, we employ a set
of standard test problems with differentiable
objective function. These test problems are
considered diverse enough to cover many kinds of
difficulties that constrained global optimization
faces. Agents then interact socially via the various
knowledge sources to find the optimum after
weaving the social fabric to motivate interaction. We
then investigate the emergence of social patterns in
both the population space and the belief space when
the problem is successfully solved.
In this new approach, the Social Fabric influence
function is the gear to find the optimal for a certain
minimization problem. The agents are connected
through a topology that determines connectivity type
between agents, through which the fabric is weaved
after the initial signal is sent from the Knowledge
Sources.
2 PREVIOUS WORK
Several researchers have used different types of
Algorithms for solving constrained optimization
problems. A quick overview is as follows:
Coello and Mezura (Coello and Mezura-Montes,
2002) implemented a version of the Niched-Pareto
Genetic Algorithm (NPGA) (Horn, Nafpliotis, and
Goldberg, 1994) to handle constraints in single-
objective optimization problems. The NPGA is a
multiobjective optimization approach in which
individuals are selected through a tournament based
on Pareto dominance. However, unlike the first
NPGA, Coello and Mezura’s approach does not
require niches (or fitness sharing (Deb and
Goldberg, 1989)) to maintain diversity in the
population. The NPGA is a more efficient technique
than traditional multiobjective optimization
IJCCI 2009 - International Joint Conference on Computational Intelligence
104

algorithms, because it only uses a sample of the
population to estimate Pareto dominance.
Deb (Deb and Goyal, 1996) proposed a Genetic
Adaptive Search (GeneAS) to solve engineering
optimization problems. He proposed to use both,
binary and real encoding for each solution. This
approach was tested on three engineering problems
(Deb and Goyal, 1996), making emphasis in
problems that have discrete and continuous
variables. The obvious drawback of the approach is
the need of implementing combined operators for
the special encoding adopted. Mezura-Montes
(Coello and Mezura-Montes, 2002) presented an
enhanced Evolutionary Algorithm that doesn’t
require the definition of extra parameters other than
those used by the Evolutionary strategy. The
implemented mechanism allows the algorithm to
maintain diversity during the process. Reynolds
(Reynolds and Peng, 2005) implemented an
algorithm that uses the Marginal Value Theorem
(MVT) to influence the individuals in the population
and drive the process of obtaining better solutions.
The algorithm was a more efficient one than the one
presented in (Coello and Mezura-Montes, 2002;
Coello, 2002) and (Coelho, Souza, and Mariani,
2009).
3 THE SOCIAL FABRIC
INFLUENCE FUNCTION
3.1 Concept
Knowledge sources are allowed to influence
individuals through a network. From a theoretical
perspective we view individuals in the real world as
participating in a variety of different networks.
Several layers of such networks can be supported
within a population. The interplay of these various
network computations is designated as the “social
fabric”. This notion of social fabric has appeared
metaphorically in various ways within Computer
Science. For example, IBM among others developed
tools to reinforce the “social fabric” whereby
designers and programmers interact to solve
complex problems (Cheng, Patterson, Rohall,
Hupfer, and Ross, 2005).
We adapt the Brock-Durlauf model of interactive
discrete choice (Brock and Durlauf ;2001) to
arbitrary interaction topologies represented by an
arbitrary adjacency matrix Г: All individuals faces
the binary choice set S = {-1, 1}: Let agent i choose
ω
i
, ω
i
Є S, so as to maximize her utility, which
depends on the actions of her neighbours: Ui =
U(ω
,ω
), whereω
denotes the vector of
dimension d
i
containing as elements the decisions
made by each of agent i's neighbours, j . The
I-vector of all agents' decisions, ω = (ω
,…,ω
); is
also known as a configuration, and ω
is known
as agent i's environment. We assume that an agent's
utility function Ui is additively separable in a private
utility component, which without loss of generality
(due to the binary nature of the decision) may be
written as hω
i
, h > 0; in a social interactions
component, which is written in terms of quadratic
interactions between her own decision and of the
expectation of the decisions of her neighbours,ω
,
ω
|
|
∑
ω
; and a random utility
component, ω
; which is observable only by the
individual i.
The social fabric is viewed as a computational
tool that influences the action and interaction of the
various knowledge sources. Informally, we have N
networks and M individuals. An individual can be
associated with one or more networks. For a given
network only certain information is allowed to flow
along that network between nodes. Each network
can be viewed as being produced by a single thread
that links up the participating nodes.
3.2 Weaving the Social Fabric into the
CAT System
The networks that comprise the social fabric can
emanate from either the Belief Space or the
Population Space. In terms of the population, the
network could reflect a kinship network or an
economic network for example. In terms of the
Belief Space, the network could be the Internet, or a
local area network, or some other network directly
accessible to the knowledge sources. It may be that
the Knowledge Sources know something about the
networks that they can access but are not sure how
those networks are linked up to the low level social
networks of the population. In other words, they
may be aware of the outer layer of the social fabric,
but can only infer about what is in the interior lining.
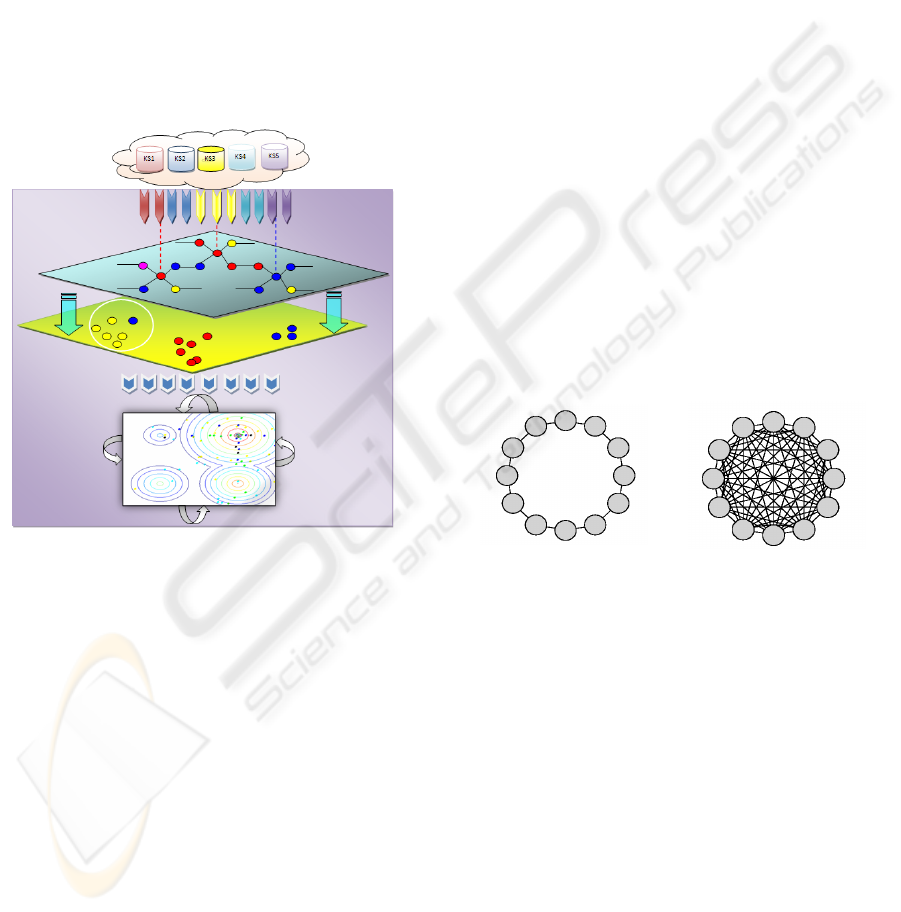
The experimental framework for the social fabric
component is illustrated in Figure 2. The figure
shows the initialization step, where each individual
first will be affected by one knowledge source (as a
special case) that will represent the initial signal to
be passed to other individuals. The signal is passed
to adjacent individuals in the topology. The
individual is represented as a node in the landscape,
where the number of connections or hops over
CULTURAL SWARMS - Knowledge-driven Framework for Solving Nonlinearly Constrained Global Optimization
Problems
105
which it can transmit this information to its
neighbours will correspond to its influence, by a
maximum hop distance and will be limited. The
number of hops can be either 0 or d meaning either
no connections or d connections at a time. The
current system is using 0 hops as the individuals
don’t have any connections with each other.
From the standpoint of the Knowledge Sources
they can seed or influence a subset of the population,
and that subset may have population level affects but
they can only guess what they might be. The key is
to “seed” a subset of the population how represent
“the weave” to these other networks, assuming that
those that represent the weave between the networks
have certain properties.
Figure 2: Embedded Social Fabric component in CAT
with activated dynamics in the environment.
As a simple configuration in CAT we can simply
specify just one network, one that is accessible to the
Knowledge Sources in the Belief Space. What we
wish to investigate is whether just having access to
the Social Fabric is sufficient for the Knowledge
Sources to improve the performance of the influence
function as opposed to not having a network to
distribute their influence at all.
The process starts where each individual first
will be affected by one knowledge source (as a
special case) that will represent the initial signal to
be passed to other individuals. The signal is passed
to adjacent individuals in the topology based on the
network connectivity. The individual is represented
as a node in the landscape, where the number of
connections or hops over which it can transmit this
information to its neighbours corresponds to its
influence. The maximum number of hops can be
either 0 or d meaning either no connections or d
connections at a time. The simplest case is
configured by assuming that each individual is
connected to a fixed number of other individuals
using a constant topology. The topologies that we
used here were taken from work in Particle Swarm
Optimization where the impact of various topologies
on the communication of local information among
particles has been studied.
Several frequently used topologies taken from
the Particle Swarm Optimization literature are
supported in CAT. For example, the lBest model is
the simplest form of a local topology is known as the
ring the ring model. The lBest ring model connects
each individual to only two other individuals in the
landscape and is shown in figure 3(a). Another
frequently used topology is the gbest topology. In
this topology each individual in the network is
connected to all the individuals in the network as
shown in figure 3(b). The advantage of the lbest
model may lie in its lower convergence rate relative
to the gbest model which may reduce the change of
premature convergence to a false peak.
Another topology supported in CAT is the square
topology in which each individual has four
connections in addition to other individuals in the
population.
Figure 3: Topologies used in the Social Fabric model for
connection between individuals. (a) lBest ring topology.
(b) gBest topology.
At each time step, every individual is influenced
by one of the knowledge sources. In this simplest
version, Knowledge Sources do not know anything
about the network and the selected individuals’
position in it. The individual then transmits the name
of the influencing Knowledge Source to its
neighbours through as many hops as specified. Next,
each node counts up the number of Knowledge
source bids that it collects. It will have the direct
influence from the Knowledge Source that selected
it plus the names of the Knowledge Sources
transmitted to it by its neighbours. The Knowledge
Source that has the most votes is the winner and will
direct the individual for that time step. In case of a
tie, there are several tie breaking rules implemented
in CAT. They include, select the “most frequently
IJCCI 2009 - International Joint Conference on Computational Intelligence
106

used KS, “the least frequently used Knowledge
Source”, and “the Knowledge Source that selected
the individual this time”, among others. In later
sections, we will compare the performance of the
lBest and square topologies when solving an
example Engineering problem, used a benchmark.
The topographical knowledge in the belief space
is used to generate a search direction d at a given
solution x, and then use it to generate new trial
solutions in a neighbourhood of x. The
topographical knowledge structure is initialized by
sampling a solution in every cell in the grid and
creating a list of best cells. The update occurs when
a cell is divided into sub-cells when an accepted
individual’s fitness value is better than the best
solution in that cell, or if the fitness value of the
cell’s best solution has increased after a change
event is detected.
4 EXPERIMENTAL
FRAMEWORK & RESULTS
ANALYSIS
4.1 Experimental Framework
The number of individuals is fixed to 100, and the
total number of generations is 9000. If a tie is found
when the social fabric is weaved the resolution
approach used is to use the Knowledge Source that
directly affected the individual at that step.
The algorithm will be tested on a set of standard
test problems G1-G13 (Hedar and Fukushima, 2006;
Hock and Schittkowski, 1981; Koziel and
Michalewicz, 1999; Michalewicz and Schoenauer,
1996) except G2, since the objective function of
problem G2 is not differentiable. These test
problems are considered diverse enough to cover
many kinds of difficulties that constrained global
optimization faces (Hedar and Fukushima, 2006;
Wenxing Z., Ali, M., 2009), and have been used to
test performances of algorithms for constrained
global optimization.
The algorithm was used to solve each problem
30 times with 100 individuals for the population
space and a varying number of generations for each
problem depending on its complexity with a
maximum of 15000 generations for problems G1
and G15. We experimented with different kinds of
topologies through which we found that the best was
the lBest topology.
Throughout the next subsection, we will use
problem G4 for explaining how our algorithm is
used to solve such constrained optimization
problems efficiently.
4.2 Analysis of Results
In this section we report the performance of our
technique on 13 well-known test problems G1-G13.
We put in Table 1 the best known objective function
value in the second column. We report in Table 1 the
best and the worst optimal values obtained from 30
runs for each test problem. To understand quality of
the obtained solutions, we report in Table 1 for each
problem the average optimal value and the standard
deviation of the obtained objective function values
for all 30 runs. Moreover, the success rate, the
maximum number of generations before we stop
each run, used to obtain these results in 30 runs, are
reported in the third and the last columns of Table 1
for each problem respectively.
The approach used by Reynolds in (Reynolds
and Peng, 2005) did not assume that there is any
kind of connection between the individuals in the
population space. Knowledge sources will pass their
signals to the individuals at each time step. Our
approach uses different topologies to pass abstract
information obtained from the Knowledge Sources
and then weave the social fabric to allow the
individuals to pass the received info through the
assumed used topology. The amount of interaction
appears to affect the way the system solves the
presented problem of a certain complexity. Not only
the individual follows the successful Knowledge
Source but also tries to adapt through neighbours in
the built network to find a better value in the
landscape. The results in table 2 show a statistical
comparison between our new approach and some
other known approaches from literature. When
plotting the population swarms, individuals are
plotted in different shapes to indicate which
knowledge source is in control.
The population swarm plots in Figures 4-a and 4-
b show the population (individuals) moving within
the problem’s constructed landscape using the lBest
topology used by our Social Fabric (SF) approach.
Each individual is shape coded to reflect the
knowledge source that has influences it in that
generation. The best individual of a generation is
stressed using a big cross ‘X’. Since the results of
the dimensions of problems can be explained
similarly we discuss only dimensions x1 and x2.
Figure 5 shows a sample of the constructed Social
Fabric-lBest topology for problem G4.
Figures 4-a and 4-b show the initial generation
and generation 119 when running the system using
CULTURAL SWARMS - Knowledge-driven Framework for Solving Nonlinearly Constrained Global Optimization
Problems
107
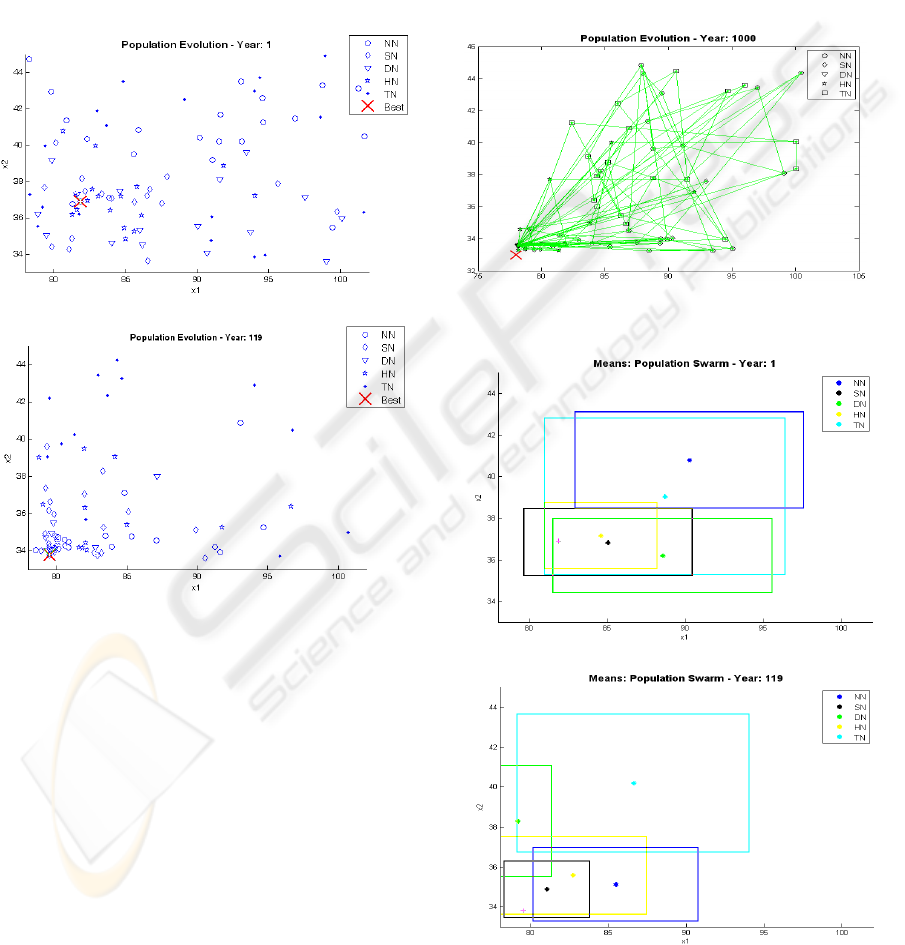
the Social Fabric-lBest to illustrate how the different
knowledge sources work under the influence of the
social fabric technique to control individuals. The
Topographic Knowledge followers draw the fine-
tuning knowledge followers: Situational, Normative,
and most of the Domain Knowledge followers.
By generation 119 most of the individuals are
swarming around the best. Topographic knowledge
individuals are still exploring the space hoping to
find a better solution to report it later to the fine-
tuning knowledge followers.
(a)
(b)
Figure 4: Population swarm of dimension x1+x2 using the
lBest topology. (a) Plotted at generation 1. (b) Plotted at
generation 119.
The power behind the algorithm lies in using the
bounding boxes that the system calculates at each
time step for each of the Knowledge Sources as
illustrated in figure 6.
A bounding box represents the standard
deviation of each “dot” produced during that
generation for the mutation process. It is considered
to be the focus of the generation process by each
knowledge source. The main idea is how these
bounding boxes of the Knowledge Sources interact
(overlap area), and how focused these bounding
boxes are at each time step. The branching phase of
the algorithmic process is shown in Figures 6-a and
6-b, where initially the bounding boxes associated
with the Topographic and Normative Knowledge
Sources cover most of the space. The exploitation
process takes place with time and the bounding
boxes for the fine-grained search process have
separated from those for the coarse-grained phase
(focused search vs. wider search) and have
surrounded the optimal value for this pair of
dimensions. These bounding boxes are effectively
channelling new individuals into this area as can be
seen in figure 6-b.
Figure 5: A sample Social Fabric swarm plot for problem
G4 using lBest topology.
(a)
(b)
Figure 6: Knowledge Swarm Plot of dimension x1+x2. (a)
Plotted at generation 1. (b) Plotted at generation 119.
IJCCI 2009 - International Joint Conference on Computational Intelligence
108

Table 1: Test results for problems G1-G13.
Prob. Opt. Succ.(%) Best Av.opt. Worst S.D. #generations
G1 ‐15 100 ‐14.99993 ‐14.99986 ‐14.99984 0.000140 15000
G3 1 100 0.999987 0.999977 0.999971 0.000032 9000
G4 ‐30665.539 100 ‐30665.52 ‐30665.47 ‐30665.40 0.055110 9000
G5 5126.4981 100 5126.499 5126.501 5126.520 0.098000 1000
G6 6961.81388 100 ‐6961.81 ‐6961.779 ‐6961.550 0.088575 1000
G7 24.3062091 100 24.30590 24.30595 24.306122 0.000400 90000
G8 0.095825 100 0.095825 0.095825 0.095825 0.000000 1000
G9 680.630057 100 680.6300 680.6310 680.6315 0.015212 10000
G10 7049.250 100 7049.244 7049.247 7049.253 0.050000 1000
G11 0.75 100 0.750000 0.700001 0.750004 0.000002 1000
G12 1 100 1.000000 0.999999 0.999989 0.000018 1000
G13 0.0539498 100 0.053950 0.053953 0.053959 0.000139 15000
Table 2: Comparison of test results for problems G1-G13.
Prob.:opt. PSO SR ASCHEA FSA Ouralg.
G1:‐15
Best
Av.
Worst
‐15.0001
‐13.2734
‐9.7012
‐15
‐15
‐15
‐15
‐14.84
N.A.
‐14.999105
‐14.993316
‐14.979977
‐14.99993
‐14.99986
‐14.99984
G3:1
Best
Av.
Worst
1.0004
0.9936
0.6674
1.000
1.000
1.000
1
0.99989
N.A.
1.0000015
0.9991874
0.9915186
0.999987
0.999977
0.999971
G4:‐30665.539
Best
Av.
Worst
‐30665.5398
‐30665.5397
‐30665.5338
‐30665.539
‐30665.539
‐30665.539
‐30665.5
‐30665.5
N.A.
‐30665.5380
‐30665.4665
‐30664.6880
‐30665.52
‐30665.47
‐30665.40
G5:5126.4981
Best
Av.
Worst
5126.6467
5495.2389
6272.7423
5126.497
5128.881
5142.472
5126.5
5141.65
N.A.
5126.4981
5126.4981
5126.4981
5126.499
5126.501
5126.520
G6:6961.81388
Best
Av.
Worst
‐6961.8371
‐6961.8370
‐6961.8355
‐6961.814
‐6875.940
‐6350.262
‐6961.81
‐6961.81
N.A.
‐6961.81388
‐6961.81388
‐6961.81388
‐6961.81
‐6961.779
‐6961.550
G7:24.3062091
Best
Av.
Worst
24.3278
24.6996
25.2962
24.307
24.374
24.642
24.3323
24.6636
N.A.
24.310571
24.3795271
24.644397
24.30590
24.30595
24.306122
G8:0.095825
Best
Av.
Worst
0.095825
0.095825
0.095825
0.095825
0.095825
0.095825
0.09582
0.09582
N.A.
0.095825
0.095825
0.095825
0.095825
0.095825
0.095825
G9:680.630057
Best
Av.
Worst
680.6307
680.6391
680.6671
680.630
680.656
680.763
680.630
680.641
N.A.
680.63008
680.63642
680.69832
680.6300
680.6310
680.6315
G10:7049.250
Best
Av.
Worst
7090.4524
7747.6298
10533.6658
7054.316
7559.192
8835.655
7061.13
7497.434
N.A.
7059.86350
7509.32104
9398.64920
7049.244
7049.247
7049.253
G11:0.75
Best
Av.
Worst
0.7499
0.7673
0.9925
0.750
0.750
0.750
0.75
0.75
N.A.
0.7499990
0.7499990
0.7499990
0.750000
0.700001
0.750004
G12:1
Best
Av.
Worst
1.0000
1.0000
1.0000
1.000000
1.000000
1.000000
N.A.
N.A.
N.A.
1.000000
1.000000
1.000000
1.000000
0.999999
0.999989
G13:0.0539498
Best
Av.
Worst
0.05941
0.81335
2.44415
0.053957
0.057006
0.216915
N.A.
N.A.
N.A.
0.0539498
0.2977204
0.4388511
0.053950
0.053953
0.053959
CULTURAL SWARMS - Knowledge-driven Framework for Solving Nonlinearly Constrained Global Optimization
Problems
109

5 CONCLUSIONS
The Cultural Algorithm is a stochastic
optimization method that uses evolutionary
algorithmic mechanisms to model cultural
evolution and social behaviors. Just as cultural
evolution contributes to the adaptability of human
society, CA provides an additional degree of
adaptability to evolutionary computation. In this
paper we have introduced the social fabric
influence function in the Cultural Algorithms
framework. This influence function is used to
produce population and knowledge swarms that
are used to optimally solve nonlinearly constrained
optimization problems. The SF metaphor allows
the knowledge sources to distribute their influence
through a social network. We apply this approach
to a set of well-known nonlinearly constrained
optimization problems. It turns out that the used
topology, frequency of distribution of influence,
and conflict resolution play an important role in
how efficiently the system produces knowledge
and population swarms that represent structural
patterns to solve problems.
ACKNOWLEDGEMENTS
Our thanks to Rose Ziad from Yarmouk University
Talal Ali from Wayne State University, and Imad
momani for help in developing the current design
and infrastructure of the new influence function.
REFERENCES
Cheng, L., Patterson, J., Rohall S., Hupfer S., Ross S.,
2005. Weaving a Social Fabric into Existing
Software AOSD 2005 - Fourth International
Conference on Aspect-Oriented Software
Development, March 2005, Chicago, IL. RC23485.
Coelho, L., Souza R., Mariani V., 2009. Improved
differential evolution approach based on cultural
algorithm and diversity measure applied to solve
economic load dispatch problems, Mathematics and
Computers in Simulation, Vol. 79 , Issue 10.
Coello, C., 2002. Theoretical and numerical constraint-
handling techniques used with evolutionary
algorithms: A survey of the state of the art,
Computer Methods in Applied Mechanics and
Engineering 191, 1245–1287.
Coello, C., Mezura-Montes, E., 2002. Handling
Constraints in Genetic Algorithms Using
Dominance-Based Tournaments. In I. Parmee,
editor, Proceedings of the Fifth International
Conference on Adaptive Computing Design and
Manufacture (ACDM 2002), volume 5, pages 273–
284, University of Exeter, Devon, UK, April 2002.
Springer-Verlag.
Deb, K., Goldberg, D., 1989. An Investigation of Niche
and Species Formation in Genetic Function
Optimization. In J. D. Schaffer, editor, Proceedings
of the Third International Conference on Genetic
Algorithms, pages 42–50, San Mateo, California.
Morgan Kaufmann Publishers.
Deb, K., Goyal, M., 1996. A Combined Genetic
Adaptive Search GeneAS for Engineering Design.
Computer Science and Informatics, 26(4):30–45.
Hedar, A., Fukushima, M., 2006. Derivative-free filter
simulated annealing method for constrained
continuous global optimization, Journal of Global
Optimization 35 521_549.
Hock, W., Schittkowski, K., 1981. Test Examples for
Nonlinear Programming Codes, Springer-Verlag,
Berlin, Heidelberg.
Horn, J., Nafpliotis, N., Goldberg, D., 1994. A Niched
Pareto Genetic Algorithm for Multiobjective
Optimization. In Proceedings of the First IEEE
Conference on Evolutionary Computation, WCCI
volume 1, pages 82–87, Piscataway, New Jersey,
June 1994. IEEE Service Center.
Koziel, S., Michalewicz, Z., 1999. Evolutionary
algorithms, homomorphous mappings, and
constrained parameter optimization, Evolutionary
Computation 7 (1) 19_44.
Michalewicz, Z., Schoenauer, M., 1996. Evolutionary
algorithms for constrained parameter optimization
problems, Evolutionary Computation 4 (1) 1_32.
North, M., Collier, N., and Vos, J., 2006. 'Experiences
Creating Three Implementations of the Repast Agent
Modelling Toolkit', ACM Transactions on
Modelling and Computer Simulation, 16(1): 1-25.
Reynolds, R., 1986. "A Metrics-Based System to
Monitor the Stepwise Refinement of Program
Modules", Fourth Conference on Intelligent Systems
and Machines, Oakland University, April 29-30.
Reynolds, R., Saleem, S., 2003, “The Impact of
Environmental Dynamics on Cultural Emergence”.
Festschrift, in Honor of John Holland, to appear,
Oxford University Press, pp.1-10.
Reynolds, R., Peng, B., 2005. Cultural algorithms:
computational modeling of how cultures learn to
solve problems: an engineering example.
Cybernetics and Systems 36(8): 753-771.
Reynolds, R., Ali, M., 2007. "Exploring knowledge and
population swarms via an agent-based Cultural
Algorithms Simulation Toolkit (CAT),"
Evolutionary Computation, 2007. CEC 2007. IEEE
Congress on, vol., no., pp.2711-2718, 25-28.
Wenxing Z., Ali, M., 2009. Solving nonlinearly
constrained global optimization problem via an
auxiliary function method, Journal of computational
and applied mathematics.
IJCCI 2009 - International Joint Conference on Computational Intelligence
110
