
SIMULA
TING ARTIST AND CRITIC DYNAMICS
An Agent-based Application of an Evolutionary Art System
Gary Greenfield
Department of Mathematics and Computer Science, University of Richmond, Richmond, Virginia, U.S.A.
Penousal Machado
Department of Informatics Engineering, University of Coimbra, 3030 Coimbra, Portugal
Keywords:
Evolutionary art, Quantifying aesthetics, Agent-based simulation.
Abstract:
We describe an agent based artist-critic simulation. Artist agents use a swarm based evolutionary art system
to evolve images that try to match their preferences. Preferred images are submitted to critic agents who then
decide, accordingly to their own criteria, which images should be displayed in a public gallery. The purpose
of our model is to enable the implementation of a variety of behavioral policies which result in different
dynamics. A reward system determines the impact of each critic and the success of each artist, which in turn
leads to behavioral and preference changes. The experimental results indicate the emergence of novel styles
and trends, artist-critic cooperation, and niche exploitation.
1 INTRODUCTION
We describe our implementation of an artists and crit-
ics simulation. The role of artists is to produce art.
The role of critics is to decide what should be exhib-
ited in a public gallery. Artists are software agents
that have recourse to a generative art system to evolve
images and decide whether or not to show them to
critics. Critics are software agents that critique art-
works with reference to examples of “masters” that
they are partial to and previous images they have been
asked to critique.
We wish to make clear at the outset that we ex-
pect every reader to disagree with our assumptions
about how a [public] art gallery actually functions.
This misses the point of our work. Our objective is to
establish a framework for implementing a model sup-
porting constraints and assumptions the reader might
wish to impose, and to do so in such a way that the dy-
namics resulting from the simulation can be archived
and analyzed.
2 BACKGROUND
The impetus for this investigation is three-fold. First,
we reconsider the approach of (Saunders and Gero,
2002) which made use of agents sharing a common
evolutionary art system in order to study artificial cre-
ativity via the dynamics of artists and critics. Sec-
ond, we invoke a grayscale swarm based evolutionary
art system (Aupetit et al., 2003). Third, we quantify
aesthetics by using image comparison techniques that
rely upon extracting information theoretic measure-
ments from the images under consideration (see, for
example , (Machado and Cardoso, 1998) (Machado
et al., 2007)). Some of our previous work in evolu-
tionary art involving co-evolving agent-critic systems
(e.g. (Greenfield, 2007) (Machado et al., 2007)) pro-
vides further inspiration for this research.
Saunders and Gero. (Saunders and Gero, 2002)
offer a conceptual framework for studying artificial
creativity supported by an implementation where a
community of software agents, each possessing a
Sims’ style image generating system (Sims, 1991),
attempts to generate a “cultural repository” of shared
aesthetic imagery. Their agents make use of neural
nets and self organizing maps. The alternative frame-
work we present is informed in part by the follow-
ing observations we made about their work: i) an
agent is simultaneously an artist and a critic, ii) agents
share genomes, iii) feature extraction and image eval-
uation use a neural net to evaluate a downsampled
32 ×32 = 1024 bit filtered and thresholded image, iv)
the policy for an image to be added to the cultural
190
Greenfield G. and Machado P. (2009).
SIMULATING ARTIST AND CRITIC DYNAMICS - An Agent-based Application of an Evolutionary Art System.
In Proceedings of the International Joint Conference on Computational Intelligence, pages 189-196
DOI: 10.5220/0002285701890196
Copyright
c
SciTePress

repository is that one agent decides an image is inter-
esting and better than its own work.
Swarm based Generative Art. Swarm art refers
to a generative technique which uses large numbers
of cooperative drawing agents to produce images in
a style that is often reminiscent of Jackson Pollack.
The term is perhaps attributable to Moura (Moura and
Ramos, 2002) who, arguably, along with Jacob (Jacob
et al., 2007), has done the most to popularize the art
form. We are motivated by the formulation of swarm
paintings as ant colony paintings in the manner of
(Aupetit et al., 2003) (Greenfield, 2005b) (Greenfield,
2006) and (Urbano, 2005). Since we are interested
in difficult questions pertaining to aesthetic merit and
artistic style, to simplify matters, we work solely in
grayscale. For a discussion of color considerations
see (Greenfield, 2009).
Image Evaluation and Aesthetics. Methods for
automated image evaluation on the basis of aesthet-
ics are eclectic and varied; the terminology itself
is problematic (Greenfield, 2005c). In the domain
of evolutionary art systems, the use of neural nets
traces back to (Baluja et al., 1994) and is also promi-
nent in (Machado and Cardoso, 1998) (Machado
et al., 2007). Greenfield uses geometric measure-
ments induced by image color organization (Green-
field, 2002). Noteworthy evaluation schemes based
on theories of aesthetics include (Greenfield, 2005a)
(Burns, 2006), (Ross et al., 2006), (Jacobsen, 2006),
and (Schmidhuber, 2007). Most of these schemes
make it difficult to account for factors such as culture,
trends, or history which are commonly recognized as
integral to aesthetics.
3 OVERVIEW OF OUR SYSTEM
To set the stage for the details to follow, it is first
necessary to provide a brief overview of the agent
based artist and critic simulation discussed in this pa-
per. There are N
a
artist agents and N
b
critic agents
prioritized by organizing them into a pyramid with
N
t
tiers. The larger the number of artists and crit-
ics, the more difficult it becomes to analyze simula-
tion results, therefore, in this paper we chose as a rea-
sonable compromise N
a
= 4 artists and N
c
= 7 crit-
ics organized into N
t
= 3 tiers where the top tier con-
sists of one critic, the second tier consists of two crit-
ics, and the third tier consists of four critics. At all
times, each artist agent has one target image from a
database of images painted by “masters” while each
critic agent has two images from this database. All
artist agents make use of the same swarm based evo-
lutionary art system. Artist agents access this system
to evolve small populations of art works from which
to select images to submit to the critics. Simulation
proceeds by rounds. At the start of each round every
artist evolves its image population for a fixed number
of generations and then is invited to submit one image
to the critics. Image populations are evolved and eval-
uated by artist agents according to differing criteria. If
an artist agent decides to submit an image, that image
is evaluated by N
t
critics selected in such a way that
one critic from each tier is represented. If at least one
critic accepts the image, then that image replaces the
oldest image in a public gallery. Artist agents are pro-
vided with the evaluation results of each image that
they submit to the critics. Critic agents receive im-
pact points for accepting images. At the conclusion
of each round, both artist agents and critic agents are
given the opportunity to modify their strategies and
behaviors based on the results, and the critic tier struc-
ture is updated on the basis of impact points. The
policies that govern the various behaviors of artists
and critics are presented as they arise during the more
comprehensive description of our system that follows.
4 THE IMAGES
In this section we discuss how we manage images in
our artist and critic simulation. All our images are
256 × 256 pixel grayscale images. A distinguishing
feature of our system is that it uses a database of 25
images consisting of five images selected from each
of five “masters” — Dali, Mondrian, Monet, Picasso,
and van Gogh. This database was culled from on-
line archives and subsequently resized and converted
to grayscale. Examples of four representative images
from this database are shown in Figure 1. For sys-
tem testing we also make use of a database of 13
grayscale “noise” images. All other images in our
system are generated from genomes that are fed to
a swarm-based generative algorithm. Genomes and
pixel maps of images generated from genomes are the
property of artist agents. They are never shared. Fea-
ture vectors extracted from those images are shared.
4.1 Feature Vectors
An image is viewed as organized into six regions —
the entire image, the upper left quadrant, the upper
right quadrant, the lower right quadrant, the lower
left quadrant, and the cental “quadrant” whose area
is one-fourth the size of the entire image. For each
region, along with the mean and standard deviation of
SIMULATING ARTIST AND CRITIC DYNAMICS - An Agent-based Application of an Evolutionary Art System
191
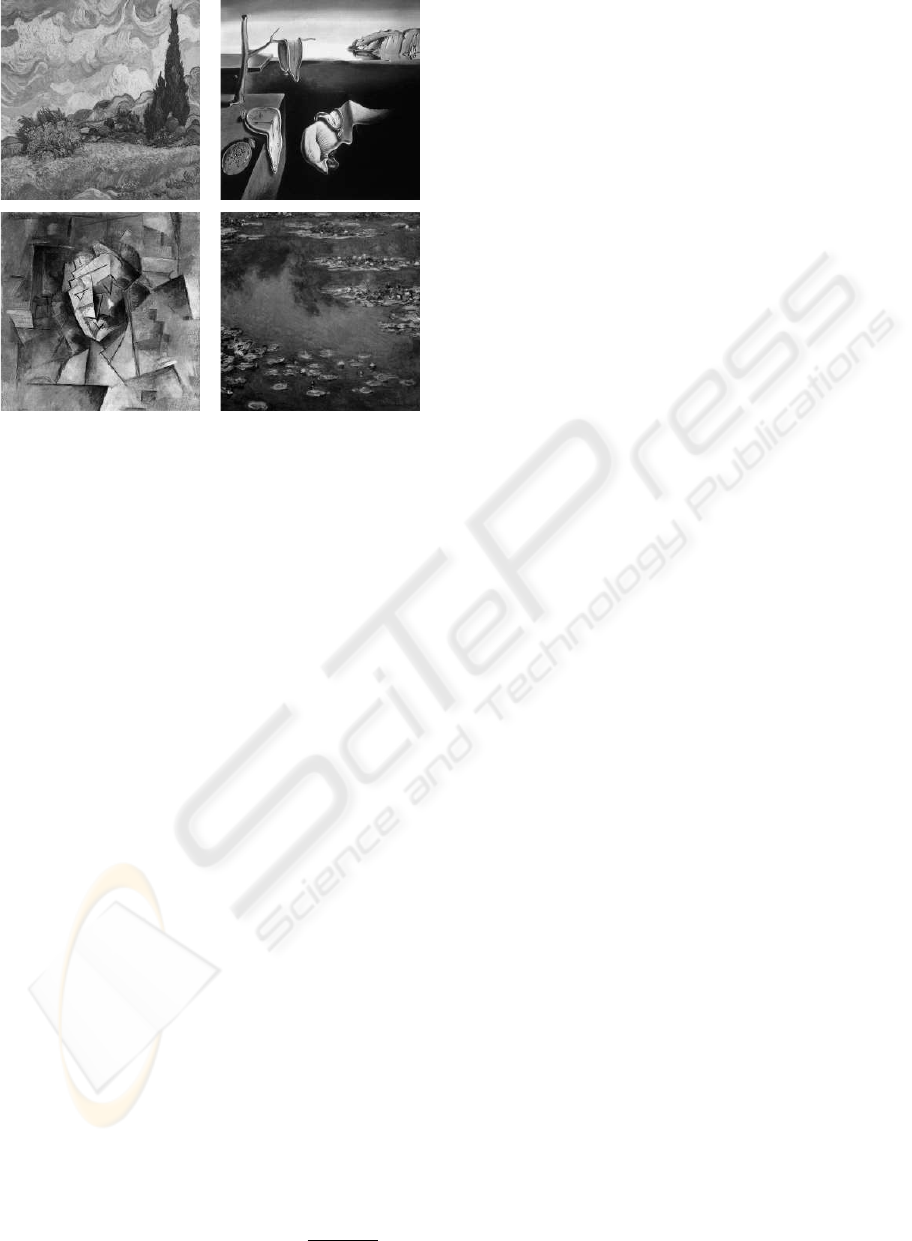
Figure 1: Four images from the “masters” database. Clock-
wise from top left: Wheat Field with Cypresses at the Haute
Galline Near Eygalieres by Van Gogh, The Persistence of
Memory by Dali, Water Lilies by Monet, Tete de Femme
by Picasso.
the luminance values of its pixels, its complexity is
estimated. This yields 6 × 3 = 18 components which
make up the feature vector.
4.2 Complexity Measure of a Region
Our approach to measuring the complexity of a re-
gion is founded upon two assumptions: i) region com-
plexity is an aesthetically relevant characteristic, and
ii) perceived complexity can be estimated using frac-
tal image compression. To estimate the perceived
complexity of a region, we use quad-tree fractal im-
age compression (Fisher, 1995). Our rationale is that
complex images are harder to compress, resulting in
larger files than simple images, therefore we assume
that the compression ratio is negatively correlated
with image complexity.
The fractal image compression scheme we use for
each region is lossy so there will be compression er-
ror, i.e., the compressed image won’t exactly match
the original. All other factors being equal, complex
images will tend toward higher compression errors
and simple images will tend toward lower compres-
sion errors. Thus, the compression error is positively
correlated with image complexity.
We estimate image complexity of region i from
image I using the following formula (Machado and
Cardoso, 1998):
Complexity(i) = RMSE(i,FC(i))×
s(FC(i))
s(i)
(1)
where RMSE stands for the root mean square error,
FC is the fractal compression transformation, and s is
the file size function.
Fractal image compression can provide a compact
encoding to images with high apparent visual com-
plexity, in fact this characteristic of is the basis for the
aesthetic judgement scheme described in (Machado
and Cardoso, 1998). Although the estimate used has
its shortcomings, previous work (Machado and Car-
doso, 2002) indicates that images with similar com-
plexity estimates tend to have similar visual complex-
ity. In the experiments described here we use the set
of parameters for our compression scheme given in
Table 1. Note that letting the minimum partition level
be 3 implies that the selected region is always first
partitioned into 64 blocks. Subsequently, at each step,
for each block, if one finds a transformation that gives
a good enough pixel by pixel match, then that trans-
formation is stored and the image block isn’t further
partitioned. (Here, pixel by pixel match is with re-
spect to the usual 0 to 255 grayscale interval encod-
ing.) If the pixel by pixel match error is more than 8
for at least one of the pixels of the block in the par-
tition, that image block is further partitioned into 4
sub-blocks, the level increases, and the process is re-
peated. Since the maximum partition level is 6, when
that level is reached the best transformation found is
stored even if the pixel by pixel match error for the
block exceeds 8.
Table 1: Image Compression Parameters.
Compression scheme Quadratic tree fractal
Image size 256 × 256 pixels
Minimum partition level 3
Maximum partition level 6
Maximum error per pixel 8
4.3 Comparing Two Images
Given an image I with feature vector X, and a re-
gion i of I, we let c
X
(i) be the complexity component
and m
X
(i) be the mean luminance component from
X of region i. We define an image comparison met-
ric C(A,B) for comparing two feature vectors A and
B by adding a complexity term together with a mean
luminance term as follows. Our complexity term is a
weighted, relative absolute difference of region com-
plexity terms obtained by summing over regions:
Σ
i
100|c
A
(i) − c
B
(i)|/max(c
A
(i),c
B
(i)). (2)
For our luminance term, we take into account both the
ordering of the mean luminances of regions within the
two vectors and the mean luminances between corre-
sponding regions of the two vectors. More precisely,
IJCCI 2009 - International Joint Conference on Computational Intelligence
192

we let r
X
(i) denote the rank of the mean luminance
of region i within its feature vector X , and obtain by
summing over regions:
Σ
i
10|r
A
(i) − r
B
(i)| + Σ
i
|m
A
(i) − m
B
(i)|/5. (3)
Note that we have a perfect match between A and B
when the comparison value C(A, B) is zero.
5 THE GENERATIVE SYSTEM
Our generative system is a swarm system modeled af-
ter a colony of ants. It most closely follows (Green-
field, 2006). Each virtual ant, or organism, is tracked
by maintaining a location and a compass heading for
it. At each time step, each organism senses the three
cells immediately in front of it in order to ascer-
tain their color luminances and their concentrations
of each of two organism produced pheromones. Each
organism then deposits color in the cell it currently
occupies and advances between 1 and 4 cells in a di-
rection determined by one of these three sensed cells.
5.1 Swarm Genomes
Each swarm painting is generated from a swarm
genome. A swarm genome has four global attributes:
a pseudorandom number generator seed value, the
number of organisms, the time to execute the painting
(viz. number of execution cycles), and the organism
footprint size. Since organism behavior is stochas-
tic, to make swarm paintings reproducible each paint-
ing must be associated with an integer seed to initial-
ize the pseudorandom number generator. The most
significant attribute is footprint size. Consistent with
an organism’s current heading, when it is depositing
color, footprint size determines the stroke width.
For each swarm painting, all its organisms are
assumed to be of the same species. Thus a swarm
genome must also include the following species at-
tributes: the number of color scents to recognize or
deposit (here six), the various scent detection thresh-
olds, the probability of following a color scent if one
is detected, the probability of following (or avoiding)
a virtual scent if one is detected, and the probabilities
for which direction (forward, left, or right) to follow
when either no scent is detected or scent is being ig-
nored. In support of color scents, a swarm genome
also includes a color scheme for the painting; here a
palette consisting of six shades of gray.
Which species attributes will actually come in to
play is determined by the caste an individual organ-
ism belongs to. There are three castes representing
three different behaviors. The explorer caste tries to
find unvisited cells. The color caste is sensitive to
detection of either the color it tries to deposit or the
color it is trying to find i.e., if the deposited color is
sensed then the ant tries to avoid it, but if the color it
seeks is sensed then (almost always) the ant follows
it. Similarly, the pheromone caste is sensitive to the
presence of virtual scent: one of the scents is an at-
tracting scent, the other is a repelling scent.
Finally, a swarm genome also includes attributes
for each of the individual organisms. Organisms are
differentiated by caste, color to deposit, color to fol-
low, and number of cells traversed at each time step.
Crossover and mutation operators needed to breed
swarm painting genomes are consistent with those de-
scribed in (Greenfield, 2006).
5.2 Generating a Swarm Painting
The number of organisms per swarm painting is re-
stricted to be between 20 and 80, in multiples of five.
Because we wish to evolve swarm paintings, it is nec-
essary to be consistent in the initial placement of the
organisms on the canvas. Rather than initially placing
all of the organisms at pseudorandom locations on the
grid, we cluster them into five equally sized groups.
One group is placed at the center of our canvas, while
the other four groups are placed at the centers of each
of the four quadrants. Further, we use identical initial
heading orientations for organisms within clusters.
5.3 Behavior Statistics
When the sense-decide-color-move cycle is per-
formed for each organism according to the number
of times determined by the time limit parameter in
the swarm genome, five statistics B
1
,. ..,B
5
are col-
lected for future use. Respectively, they are the num-
ber of instances where an organism: i) visited a previ-
ously unvisited cell, ii) was in “wandering” mode, iii)
pursued (or avoided) color, iv) pursued (or avoided)
scent, v) blended the color it deposited. Regarding
this last statistic, there is some duplication of effort. If
color is being deposited in a previously unvisited cell,
then it replaces the background color (black), other-
wise it blends with the existing color.
5.4 System Capabilities
From our cursory description of the generative sys-
tem, in light of master images such as those in Fig-
ure 1 that the artists and critics are assigned, it should
be clear that the generative system will never be able
to approximate such images closely! This is our inten-
tion. We treat images in the database done by “mas-
SIMULATING ARTIST AND CRITIC DYNAMICS - An Agent-based Application of an Evolutionary Art System
193

ters” either as if they were created by a process that
has been lost or forgotten, or as if they were retrieved
from an alien extraterrestrial site. Either way, they
have now become the inspiration for artists and crit-
ics alike.
6 THE ARTISTS
Each of our four artists has a population of swarm
genomes. Genome population size is 10, with 6
genomes culled after each generation and the remain-
ing 4 used to repopulate via standard evolutionary art
methods. In all the experiments run here, when an
artist agent invokes the generative system, its genome
population is evolved for 6 generations according to
the criteria it provides before examining the results.
At all times, each artist has a target image from the
database of masters, and a binary coefficient vec-
tor (c
1
,. ..,c
5
) for use with the behavior statistics
B
1
,. ..,B
5
that are gathered during the image gener-
ation procedure.
Image Fitness Calculation. When an artist calcu-
lates image fitness it compares its current target image
feature vector T with the feature vector X extracted
from the image under consideration I and obtains fit-
ness value F by letting
F = C(T,X) + Σ
j
c
j
w
j
B
j
, (4)
where the w
j
’s are scaling weights that are constant
for the simulation.
Submitting an Image to the Critics. Our policy is:
When queried, an artist submits an image to the crit-
ics by submitting its feature vector if and only if its
generative system has produced a more fit image than
the last time it was queried. In response, the simula-
tion provides the ranks (between 0 and 9) that were
assigned by the three critics — the tier 1 critic, a tier
2 critic, and a tier 3 critic — that were selected to cri-
tique it, and the decision about whether the image was
accepted for the gallery or not.
Changing an Artist’s Target. The policy we use to
change an artist’s target is: If the number of consecu-
tive submissions rejected reaches the threshold value
ATAR then it is time to change one’s target!
Changing an Artist’s Behavior. Because of the
way artist’s calculate image fitness, artists can choose
not to be slaves to the pursuit of trying to match their
target image’s characteristics. This means they can
pursue their own unique style, or further develop suc-
cessful styles, or change the evolutionary pressure
currently being exerted by a target that is not produc-
ing gallery acceptances. Artist behavior is changed
by flipping one or more of the bits in the binary co-
efficient vector (c
1
,. ..,c
5
). This is implemented by
making the probability of each bit being flipped 0.2.
The policy we use to change an artist’s behavior is:
Within the last ALAG rounds, if either no submission
has been made, or every submission has been rejected,
then it is time to change one’s behavior!
7 THE CRITICS
As previously stated, we use seven critics. At all
times, each critic has two target images from the
database of masters. In addition it has a rank-ordered
list of its preferences, or favorites, resulting from the
top ten evaluations it has given to all the images it has
critiqued so far.
Critiquing an Image. This favorites list makes the
actual act of critiquing an image simple. With tar-
get feature vectors T
1
and T
2
, given the feature vector
X from an image I to critique, our policy is: Take
the smaller of C(T
1
,X ) and C(T
2
,X ), insert I in the
favorites list by replacing the value of the highest
ranked image in the list of favorites with that value,
sort the favorites list in increasing order, and returns
the rank that I receives as a result.
Managing the Preferences List. During initializa-
tion we instantiate a “random artist” and generate an
initial population of images. We use that set of fea-
ture vectors to initialize all the critic preference lists.
Because critics have different targets, the way they
rank these images is different. Thus critic diversity is
present right from the start. In our model, critic pref-
erences are not fixed. Their tastes change over time.
The way we chose to implement this notion was to age
each preference list by artificially inflating the rank-
ing of the oldest critiqued image after every 3 rounds.
This causes the next image the critic is asked to cri-
tique to force this image to be dropped from the list.
Changing a Critic’s Target. If a change in target is
triggered, one of the two target images the critic cur-
rently has is replaced by an image chosen at random
from the masters database. Note that as a side effect,
some of the images in the preferences list must be re-
evaluated — in particular, those that were present be-
cause their comparison values were based on an im-
IJCCI 2009 - International Joint Conference on Computational Intelligence
194

age that is now gone — and the preferences list must
be re-ranked. The policy we use for triggering a critic
target change is: If a critic was unsuccessful in find-
ing an image to recommend for the gallery in the last
CTAR rounds it is time to change one of its targets!
8 THE SIMULATION
The overarching simulator for our artists and critics
is straightforward. After initialization, for each of N
rounds the artists are queried and invited to make sub-
missions. If a submission is made, the simulator se-
lects and asks three critics to evaluate it. If one or
more decide to accept it to the gallery, then the simu-
lator handles all the record keeping as well as enforc-
ing the various policies that apply to artists and critics
that we have previously described.
Managing the Gallery. The gallery of eight im-
ages is initialized by selecting image from the mas-
ters database. As artist generated swarm images are
accepted the oldest image in the gallery is replaced.
Selecting the Critics. Each critic has an impact rat-
ing. This rating increases when images are accepted
to the gallery by the critic. At the start of each round
all critics are sorted on the basis of this rating to de-
termine the tier 1 critic, the two tier 2 critics, and the
remaining four tier 3 critics. When a submission is re-
ceived, one critic from each tier is selected and asked
to evaluate the image. Our policy is: An image is con-
sidered to be accepted by the tier 1 critic if it places in
the top three of its preferences list, by the tier 2 critic
if it places in the top two of its preferences list; and
by the tier 3 critic if it places at the top of its pref-
erences list. For breaking acceptance ties our policy
is: In case of a tie the lower ranking critic gets credit
for having accepted the image. This last policy has
profound implications with respect to the dynamics
of impact ratings.
Assessing Artists and Critics. For artists, we keep
a running tally of the number of submissions and the
number of acceptances. For critics, in addition to
keeping a running tally of the number of critiques and
the number of acceptances, as previously mentioned,
we maintain an impact rating. We add a further twist
to the calculation of the impact rating by rewarding
critics for introducing novelty into the gallery as fol-
lows. The critic’s impact rating increases by 1 if it
accepts a submission to the gallery, but by 2 if, in
addition, the submission is sufficiently different from
the images currently in the gallery. Here “different” is
determined by considering the region that consists of
the entire image and checking to see if either its com-
plexity or average luminance is more than one stan-
dard deviation away from either of those quantities
averaged across the entire gallery.
9 SIMULATION RESULTS
To examine the dynamics resulting from our model,
we made several runs of our simulation lasting N = 50
submission-evaluation rounds using as default set-
tings ATAR = 5, ALAG = 3 and CTAR = 10. Fig-
ure 2 shows image diversity from one of these runs.
Figure 3 shows the style development of an artist that
had 8 of 29 submissions accepted during this same
run. The graphs in Figure 4 show the rank ordering
of artists on the basis of number of acceptances, and
of critics on the basis of impact rating, as well as the
cumulative totals of these quantities by rounds during
the course of the run. Note that by round #25 critic
rankings have stabilized. This is consistent with most
of the other experiments we performed. Under our
policies it is difficult for lower ranked critics to dis-
place higher ranked ones. Consequently, as a run pro-
gresses there is tendency for critic ranking to stabilize
and tier changes to become less frequent. Although
tier changes are uncommon, they still do sometimes
occur, and in such cases may even trigger dramatic
changes in both critic and artist rankings as well as in
the type of imagery accepted for the gallery.
10 FURTHER EXPERIMENTS
Our artist-critic simulation has several parameters and
many features. To further examine its capabilities
and help ascertain its limitations we performed sev-
eral tests. These tests included runs with:
• N = 30, ATAR = 10, and ALAG = 1,3, 5, and 7;
• N = 30, and ATAR = 5, 10, and 15;
• N = 30, and CTAR = 5,10, and 15;
• N = 30, where one master image is selected and
assigned to be the same target for all artists;
• N = 30, where one master is first selected and then
each critic is assigned two (not necessarily dis-
tinct) target images from the five that are available
in the master’s database by that master;
• N = 20, where one artist functions as a “ran-
dom artist” by submitting its highest ranked image
SIMULATING ARTIST AND CRITIC DYNAMICS - An Agent-based Application of an Evolutionary Art System
195
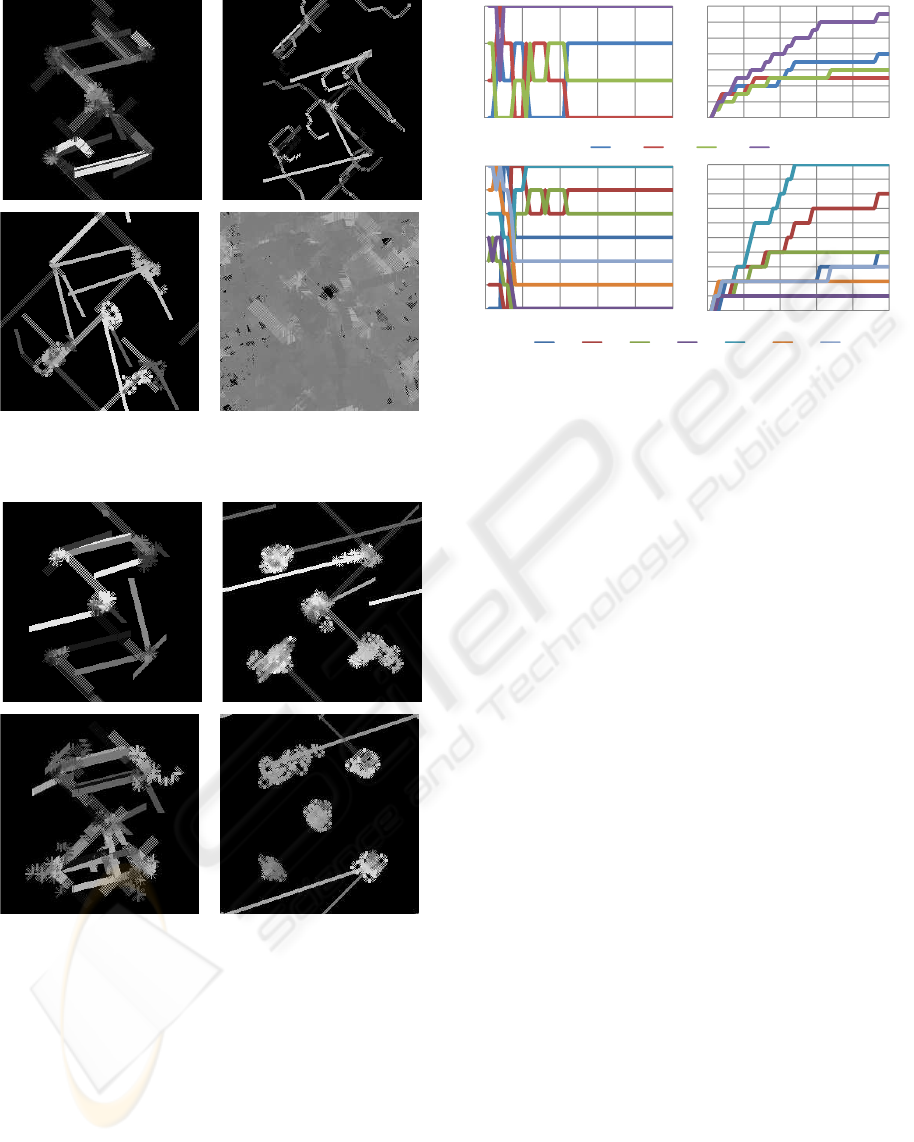
Figure 2: Artist diversity as evidenced by an accepted sub-
missions of each of the artists during rounds #7 through #10
of an N = 50 round run.
Figure 3: Artist style development is observed by consider-
ing an artist’s accepted images during the course of a run.
For the virtual artist chosen here, its acceptances are shown
(clockwise from top left) for rounds #3, #19, #23 and #46
of an N = 50 round run. Its accepted image from round #7
is shown at the top left in the previous figure.
from a random population each round (Reassur-
ingly, no image from this artist was ever accepted
by the critics beyond round 5);
• N = 20, where the master’s database is replaced
by “noise” images, the number of critics is re-
duced to 3, one master image is chosen, and both
targets for all critics are assigned to be this image
(This tests how successful the generative system
0
1
2
3
4
5
6
0 10 20 30 40 50
critic0
critic1
critic2
critic3
critic4
critic5
critic6
artist0
artist1
artist2
artist3
0
1
2
3
0 10 20 30 40 50
0
2
4
6
8
10
12
14
0 10 20 30 40 50
0
1
2
3
4
5
6
0 10 20 30 40 50
0
1
2
3
4
5
6
7
8
9
10
0 10 20 30 40 50
Figure 4: Graphs showing artist and critic dynamics from a
sample run lasting 50 rounds. The top row is for artists. The
bottom row is for critics. The first column shows rankings
(0 always represents highest rank) on the basis of accep-
tances for artists and impact points for critics. The second
column shows the cumulative totals of the number of accep-
tances for artists and the number of impact points for critics
by rounds.
is at “solving” the image duplication problem).
Due to space limitations we are unable to discuss
all of these experiments. We focus on two runs where
a single master was first identified; the two assigned
targets for each critic were selected from that mas-
ter; and critic targets did not change during the course
of an N = 30 round run. Because there were only five
targets available for critics, most critics shared at least
one target with another critic. However, if a critic had
an unshared target this created a niche opportunity
such that one artist could develop an exploitative rela-
tionship supporting a sustained period of submissions
and acceptances that catapulted both artist and critic
to higher rankings. These runs produced the greatest
turmoil within the tier system we used for critics (see
Figure 5). Interestingly, for both these runs the critic
that came to dominate had only one target image i.e.,
its two targets were the same. Evidently, for artists,
the existence of a critic with an unambiguous prefer-
ence was useful.
11 CONCLUSIONS
We have described a flexible artist-critic agent based
simulation. It is based on a model whereby different
policies can be implemented in order to test the conse-
quences of what one might expect to occur. The poli-
cies we chose supported phenomena such as the de-
velopment of artistic styles; artist-critic cooperation;
IJCCI 2009 - International Joint Conference on Computational Intelligence
196

0
1
2
3
4
5
6
0 10 20 30 40 50
critic0
critic1
critic2
critic3
critic4
critic5
critic6
0
1
2
3
4
5
6
0 10 20 30
0
1
2
3
4
5
6
0 10 20 30
Figure 5: The results from two N = 30 round runs show-
ing dramatic changes in critic rankings during the course of
the run. For both runs critics were forced to choose their
two targets from a restricted database consisting of only 5
images all by the same “master”.
critic diversity (because critics have different prefer-
ences and these preferences may change over time);
and artistic freedom (because artists can exhibit “free-
dom of expression” by deciding not to blindly follow
the critics). Also noteworthy is that our model es-
tablishes a critic hierarchy such that over time some
critics become more equal than others. A distinguish-
ing feature of our model is that it values the discov-
ery of novel imagery by requiring that in addition to
being new, images must also be “fit”. More impor-
tantly, it appears our policies allow for artistic trends
to arise via a strategy whereby a lower ranked critic
locates a niche to exploit and teams with an artist to
furnish images so that the resulting flurry of accep-
tances cause images in this artist’s style to populate
the public gallery
REFERENCES
Aupetit, S., Bordeau, V., Monmanrch
´
e, N., Slimane, M.,
and Venturini, G. (2003). Interactive evolution of ant
paintings. In Congress on Evolutionary Computation,
volume 2, pages 1376–1383.
Baluja, S., Pomerleau, D., and Jochem, T. (1994). Towards
automated artificial evolution for computer-generated
images. Connection Science, 6:325–354.
Burns, K. (2006). Atoms of eve: a bayesian basis for aes-
thetics of style in sketching. Artificial Intelligence
for Engineering, Design, Analysis and Manufactur-
ing, 20:185–199.
Fisher, Y., editor (1995). Fractal Image Compression: The-
ory and Application. Springer, London.
Greenfield, G. (2002). Color dependent computational aes-
thetics for evolving expressions. In BRIDGES 2002
Conference Proceedings, pages 9–16.
Greenfield, G. (2005a). Designing metrics for the purpose
of aesthetically evaluating images. In Computational
Aesthetics 2005, pages 151–158. Eurographics Asso-
ciation.
Greenfield, G. (2005b). Evolutionary methods for ant
colony paintings. In EvoWorkshops 2005 Proceed-
ings, volume LNCS 3449, pages 478–487.
Greenfield, G. (2005c). On the origins of the term compu-
tational aesthetics. In Computational Aesthetics 2005,
pages 9–12. Eurographics Association.
Greenfield, G. (2006). On evolving multi-pheromone ant
paintings. In 2006 IEEE World Congress on Compu-
tational Intelligence Conference Proceedings, pages
7425–7431. IEEE Press.
Greenfield, G. (2007). Co-evolutionary methods in evolu-
tionary art. In The Art of Artificial Evolution: A Hand-
book on Evolutionary Art and Music, pages 357–380.
Springer.
Greenfield, G. (2009). On variation within swarm paintings.
In Hyperseeing — Proceedings of ISAMA 2009, pages
5–12.
Jacob, C., Huslak, G., Boyd, J., Sayles, M., Nuytten, P.,
and Pilat, M. (2007). Swarmart: interactive art from
swarm intelligence. Leonardo, 40:248–254.
Jacobsen, T. (2006). Bridging the arts and sciences:
a framework for the psychology of aesthetics.
Leonardo, 39:155–162.
Machado, P. and Cardoso, A. (1998). Computing aesthet-
ics. In Proceedings XIV-th Brazilian Symposium on
Artificial Intelligence, pages 219–229.
Machado, P. and Cardoso, A. (2002). All the truth about
NEvAr. Applied Intelligence, Special Issue on Cre-
ative Systems, 16(2):101–119.
Machado, P., Romero, J., and Manaris, B. (2007). Exper-
iments in computational aesthetics: an iterative ap-
proach to stylistic change in evolutionary art. In The
Art of Artificial Evolution: A Handbook on Evolution-
ary Art and Music, pages 381–415. Springer.
Moura, L. and Ramos, V. (2002). Swarm paintings - nonhu-
man art. In Architopia: Book, Art, Architecture, and
Science, pages 5–24. Institut d’Art Contemporain.
Ross, B., Ralph, W., and Zong, H. (2006). Evolutionary
image synthesis using a model of aesthetics. In 2006
IEEE Congress on Evolutionary Computation, pages
3832–3839. IEEE Press.
Saunders, R. and Gero, J. (2002). Artificial creativity: a
synthetic approach to the study of creative behavior. In
Creative Design V. Key Centre of Design Computing
and Cognition.
Schmidhuber, J. (2007). Simple algorithmic principles
of discovery, subjective beauty, selective attention,
curosity and creativity. In Proceedings 10-th Inter-
national Conference on Discovery Science, volume
LNAI 4755, pages 26–38.
Sims, K. (1991). Artificial evolution for computer graphics.
In Proc. SIGGRAPH ’91, volume 25, pages 319–328.
Urbano, P. (2005). Playing in the pheromone playground:
experiences in swarm painting. In EvoWorkshops
2005 Proceedings, volume LNCS 3449, pages 527–
532.
SIMULATING ARTIST AND CRITIC DYNAMICS - An Agent-based Application of an Evolutionary Art System
197
