
FINDING PROTEIN FAMILY SIMILARITIES IN REAL TIME
THROUGH MULTIPLE 3D AND 2D REPRESENTATIONS,
INDEXING AND EXHAUSTIVE SEARCHING
Eric Paquet
Institute for Information Technology, National Research Council of Canada, Ottawa, Ontario, Canada
Herna Lydia Viktor
School of IT and Engineering, University of Ottawa, Ontario, Canada
Keywords: Indexing, Proteins, Representation, Searching, 3D.
Abstract: Research suggests that the complex geometric shapes of amino-acid sequence folds often determine their
functions. In order to aid domain experts to classify new protein structures, and to be able to identify the
functions of such new discoveries, accurate shape-related algorithms for locating similar protein structures
are thus needed. To this end, we present our Content-based Analysis of Protein Structure for Retrieval and
Indexing system, which locates protein families, and identifies similarities between families, based on the
2D and 3D signatures of protein structures. Our approach is novel in that we utilize five different
representations, using a query by prototype approach. These diverse representations provide us with the
ability to view a particular protein structure, and the family it belongs to, focusing on (1) the C-α chain, (2)
the atomic position, (3) the secondary structure, based on (4) residue type or (5) residue name. Our
experimental results indicate that our method is able to accurately locate protein families, when evaluated
against the 53.000 entries located within the Protein Data Bank performing an exhaustive search in less than
a fraction of a second.
1 INTRODUCTION
Currently, there are more than 53.000 protein
structures contained in the Protein Data Bank, the
primary repository for experimentally determined
3D protein structures, with the number of structures
being added growing exponentially (Ber et al. 00,
08). This is due, mainly, to the advent of high
throughput systems. This current explosion of the
number of known 3D protein structures, created by
x-ray crystallography, theoretical prediction or NMR
techniques, brings an urgent need for fast, accurate
approaches to find protein structure families, to
identify similarities between families, to locate
outliers or structural surprises, and to determine
possible mutations.
In recent years, a number of researchers have
investigated finding similar 3D protein structures,
mainly using structure alignment (YCO05, AKW06,
CS04). Research includes the work of (PPP05,
ONI04, CSS04, Hua et al. 06), who use local
approaches to calculate the similarities of protein
structures, thus possibly accumulating error and
potentially overlooking semantic information about
the interrelationships of the structures. Other work
includes shape-based approaches such as (AKW06,
Dar et al. 06, YKY08, CZ08, Abe et al. 08, ZB08)
which typically employ a sphere, grid, pie or
spherical trace transform to compare structures.
This paper described a system for protein
structure description and retrieval. Our system, in
contrast to other approaches, utilizes a number of
different representations to create both 3D and 2D
signatures of the protein structures. Furthermore, our
method is scale, rotation and translation invariant
and eliminates the need for prior structure
alignment. It employs the global 3D shape as well as
the 2D colour, texture and composition of a protein
structure, thus avoiding accumulating possible error.
By using the different representations, our system is
able to provide the domain expert with diverse
127
Paquet E. and Lydia Viktor H. (2009).
FINDING PROTEIN FAMILY SIMILARITIES IN REAL TIME THROUGH MULTIPLE 3D AND 2D REPRESENTATIONS, INDEXING AND EXHAUSTIVE
SEARCHING.
In Proceedings of the International Conference on Knowledge Discovery and Information Retrieval, pages 127-133
DOI: 10.5220/0002286801270133
Copyright
c
SciTePress
representations of the same protein structure and its
family members. Also, our system is able to identify
related protein structures in between families. An
advantage of our algorithms, when compared to that
of others, is that they are very fast. Our system
searches for similar protein structures, against
53.000 proteins, in less than a second while
performing an exhaustive search.
This paper is organized as follows. Section 2
describes the different representations, the
algorithms for finding the 3D and 2D signatures and
well as our similarity search method. This is
followed, in Section 3, with our experimental
results, when applying the system to seven diverse
families within the Protein Data Bank.
2 METHODS
This section discusses the approach we employ to
locate protein families within the Protein Data Bank.
Firstly, a number of depictions are used in order to
create diverse representations of each protein
structure. Secondly, for each of the representations,
3D and 2D signatures are calculated offline (i.e.
during preprocessing), and placed in a database.
Lastly, a Euclidian distance-based similarity search
algorithm is used to locate the family to which a
query protein structure belongs.
2.1 Representing the Protein
Structures
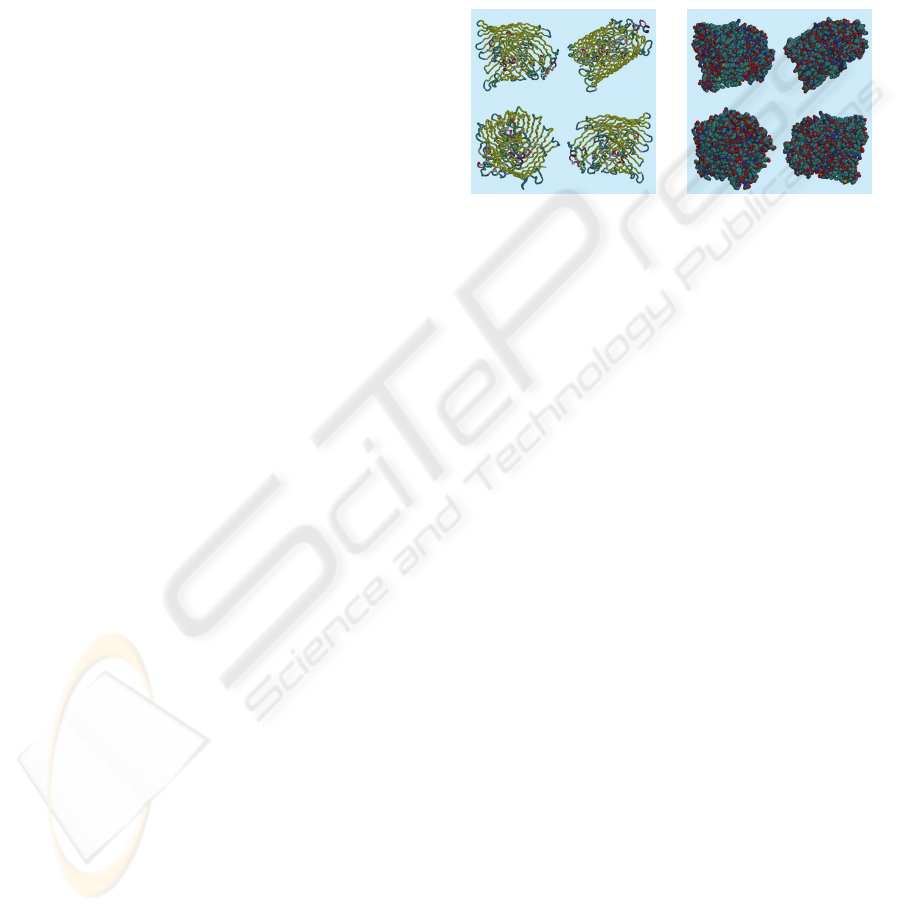
We first focus our attention on the 3D
representations employed. Figure 1 illustrates the
1by5 protein structure from the ligand-gated protein
channel family, when employing the various
representations. The first representation, as shown
in Figure 1 (left), is the so-called tube
representation, where the protein is represented
using a smooth cylindrical tube through the C-α
atoms. This representation is useful for the following
reason. The C-α chain is the backbone of the protein.
There might be more then one, if the protein is made
up of many chains. As such, it is a fundamental
representation which is also visually very intuitive.
Its fundamental character comes from the fact that
the folding of the chain is determine by the sequence
of amino-acids (and of course the milieu in which
the protein is located) which are attached to the
chain; the so-called residues. Secondly, the van der
Waal representation is depicted in Figure 1 (right),
which associates a van der Waal spheres to each
atom, without displaying the chemical bounds. This
“low level” representation allows us to show the
atoms and the range of their van der Waal
interaction; without assuming any relationship
between them. The position of the constituent atoms
corresponds to the centre of the van der Waal sphere
and the range of the van der Waal interaction
corresponds to its radius. Such a representation is
not as visually intuitive as the tube, but it does not
require as much “understanding” of the data,
because no structure labelling is involved.
Figure 1: The 3D tube and Van der Waal Representations.
We depict the 2D representations in Figure 2,
again showing the 1by5 protein structure. Let us
first consider the 2D representations associated with
the tube representation. In the first representation, as
shown in Figure 2 (top-left), the different secondary
structures are depicted by one of seven colours. For
example, the α-helix is purple, the 3-10 helix is
mauve and the extended β is yellow. This
representation was chosen, due to the fundamental
importance of the secondary structures in structural
proteomics in order to establish their classification.
The second representation, in Figure 2 (top-
right), encodes the amino acid (residue) name, using
20 different colours to distinguish between then.
Here, for example, the ALA is encoded in blue, the
LEU in pink and the HSD in cyan. Not only are the
main chains displayed, but also the topological
relation in between the amino-acids. Proteins which
have similar amino-acid sequences have, in general,
a similar shape. Proteins with relatively different
amino-acid sequences might also have similar shape.
This is usually the case when a protein has a specific
functionality. For example, consider the
Haemoglobin protein structures for different species.
Here, the shape is determined by the fact that
Haemoglobin must carry oxygen. In this case, one
may want to explore shapes having very similar
amino-acid content, as indicated by this
representation.
The representation shown in Figure 2 (bottom-
left) denotes the residue type, which determines the
interactions with its surrounding. For example, a
solvent is coded in yellow, an acid in red, a polar in
KDIR 2009 - International Conference on Knowledge Discovery and Information Retrieval
128

green and an ion in tan. This representation is
especially useful for drug design. For instance,
consider the situation where two distinct amino acid
sequences might have the same type of interaction,
where one combination is toxic while the other is
not. The residue type representation is more adapted
to this particular problem, since the coding is related
to the function of the residues, not their nature “per
se”.
Figure 2: The four 2D Representations.
We also show, in Figure 2 (bottom-right), the 2D
representation when considering the van der Waal
representation, where the colour corresponds to the
atom names. In this case, a colour is associated with
each atom. That allows labelling the atomic content
of the protein. Note that the discrimination of this
representation is poor, since a small set of atoms
tend to appear repeatedly in the structure, which then
tends to form a repetitive pattern.
2.2 Creating the 3D Protein Structure
Index
This section describes the algorithm to create the 3D
signatures of protein structures. Our algorithm
creates a protein structure signature that is
translation, scale and rotation invariant, in order to
facilitate for the protein’s arbitrary location and pose
in space. It is important to understand that, in our
algorithm, the proteins are not aligned relative to one
another. Instead, the most natural orientation, in
terms of its spatial distribution, is found through the
tensor of inertial. This reduces processing time
significantly, and increases discrimination. The
algorithm describes a protein either as a whole, the
so-called global approach, or focuses on a subpart of
its structure, the so-called local approach. Only the
first approach is considered in the present paper. In
order to apply the local approach, it suffices to
divide the protein into smaller substructures as
required by a given application.
Our algorithm proceeds as follows
[PV07, PV08].
Firstly, the protein is triangulated into a mesh, the
centre of mass of the object is computed and the
coordinates of the vertices are normalized. The
tension of inertia is subsequently calculated and, in
order to achieve rotation invariance, the Eigen
vectors are determined, resulting in a 3x3 matrix.
The normalized signature is based on the concept of
a cord, which refers to a vector that originates from
the barycentre of the protein and terminates on a
given barycentre of a triangle (assuming a triangular
mesh representation of the protein surface). The
statistical distribution of this cord is represented in
terms of three histograms, to depict the radial and
angular distributions thereof. These three histograms
thus present the shape signature of the corresponding
protein structure, which is placed in a database for
future querying [PV07, PV08].
2.3 Creating the 2D Protein Structure
Signature
This section describes the algorithm which produces
the 2D protein structure signatures. Our motivation
for employing 2D as well as 3D signatures is as
follows. While the 3D signatures are based on shape,
it does not take the chemical substructures of the
protein into account. Analysing chemical
substructures are of especial importance when, for
example, analyzing the docking of two proteins in
which the interaction of the related amino-acids
plays a key role. In our system, this is achieved by
viewing the structures as 2D images and then by
attributing a colour code to each chemical structure.
Here, a feature-based image signature, based on only
four (4) views of the protein structure (as opposed to
typically hundred in most current approaches)
[YCO05], is created using the colour, texture and
interrelationship between components (the so-called
composition). The patterns created by the
substructures are associated with the texture, while
the local spatial organization is associated with the
composition. The advantages of describing the 3D
shape by only four views, as opposed to many, are
twofold. Firstly, the calculation of the descriptor is
much faster since it involves less views and the
corresponding index is more compact since less
views are described, which allows faster searching
and retrieval. Secondly, because the description
FINDING PROTEIN FAMILY SIMILARITIES IN REAL TIME THROUGH MULTIPLE 3D AND 2D
REPRESENTATIONS, INDEXING AND EXHAUSTIVE SEARCHING
129

associated with each view represents the information
thereof more efficiently (this is why less views are
needed), it is possible to describe and retrieve,
efficiently, sub-regions and to search for local
features.
Our 2D protein structure signature creation
algorithm employs a triangular mesh representation
and principal component analysis (PCA) is used to
obtain a reference frame that is translation and
orientation invariant, from which four 2D views are
obtained. Next, the Sobol sequence is used to sample
image points with a window in a quasi-random
manner. For each point, two bi-dimensional
histograms are computed based on hue, saturation
and the relative proportion thereof. These
histograms are accumulated for each point of the
sequence. The displacement of the window over the
image ensures that not only global information about
the later is accumulated, but structural information is
extracted as well. Finally, the two histograms are
converted into a signature (or index), which provides
us with an abstract description of the composition of
the 2D protein structure image [PV07, PV08].
2.4 Measuring Signature Similarity
The resultant 3D and 2D signatures for the six
representations as described Section 2.1, which have
been calculated offline, is subsequently placed in a
database. This database thus contains 14 different
sets of signatures (or tables), for the 53.000 member
Protein Data Bank.
The next step involves finding the family to
which a query protein structures belongs. To this
end, a similarity search algorithm is used, in order to
find the structures which are the most similar, for
each representation. For example, let us assume that
we want to calculate the similarity of all proteins in
PB
r,
i.e. all proteins presented using representation
“r” against a query protein Pq
1
. We calculate the
similarity measure between Pq
1
and each other
protein structure in PB
r
. This distance is calculated
using the Euclidian metric. With our present
system, an exhaustive search, for a given
representation, is performed and all 53.000 protein
structures are ranked in a fraction of a second.
3 RESULTS
This section describes our experimental results when
evaluating our system against the 53.000 proteins
structures, as contained in the Protein Data Bank
(PDB) [Ber et al. 00]. We verified our finding
against the SCOP (Structural Classification of
Proteins) system, which describes the structural
relationships of proteins of known structure (And et
al. 08). In the SCOP classification system, proteins
are grouped into families, based on experts’
experience (Dar et al. 06). More specifically,
proteins are classified into (from large to small)
folds, super-families and families. Our aim is to find
the family that a structure belongs too, and those
family members that it is closest too. Furthermore,
we wish to explore the “usefulness” of the various
representations, and to distinguish between the
applicability of the 3D versus 2D representations.
Our experiments were conducted using workstations
with two Xeon™ 3.4 GHz CPUs and 2.8 GB of
RAM and our system was implemented using
Java/Java3D.
Table 1: Protein Families used in Experiments.
Family Members Species Query Class
L-
aspartase/fumara
se
10
A
nas
platyrhynchos
(Domestic
duck)
1k7w α
P
yridoxine 5'-
P
hosphate
synthase
7
Escherichia
coli
1ho1 α + β
P
yridoxal
d
ependent
d
ecarboxylse
2
Sus scrofa
(Pig)
1js3 α + β
B
acterial AB5
t
oxins, B-subunits
3
B
ordetella
pertussis
1prt β
F
luorescent
proteins
2
C
oral
(Discosoma
sp.)
1ggx α + β
β-catenin-
i
teracting ICAT
3
H
omo sapiens 1t08 α
L
igan
d
-gated
protein channel
11
E
scherichia coli 1by5
M
embrane
a
nd cell
s
urface
All the queries were executed in less than a second,
using an exhaustive search against all 53.000 of the
structures as contained in the Protein Data Bank.
Table 1 shows the seven protein families we used in
our experiments, together with the query (or seed)
structure. These families were chosen so as to
illustrate our system against a variety of families in
terms of size, species, SCOP classification and
structure.
In order to analyze our results, we evaluate the
efficiency of the different (3D and 2D)
representations, by determining whether the query
protein and the closest matches belong to the same
family. For illustration purposes, the result of the
search for the ligand-gated protein channel family,
using the 1by5 structure as seed query and
employing the tube representation, is shown in
Figure 3. To evaluate our results, we retrieved the
most similar protein structures and then calculate the
precision and recall of our system. Here, precision is
defined as the proportion of the retrieved protein
KDIR 2009 - International Conference on Knowledge Discovery and Information Retrieval
130

structures that was been classified (by SCOP) as to
belong to the same family as the query and the recall
is the proportion of family members in the entire
53.000 member database that are retrieved as a result
of the query.
Figure 3: Results when retrieving the ligand-gated protein
channel family, using the 1by5 structure as query and the
3D tube representation.
Formally, Precision and Recall are defined as
family
f
amily false
N
P
NN
=
+
(1)
and
family
f
amily miss
N
R
NN
=
+
(2)
where N
family
refers to the number of relevant family
members retrieved, N
false
denotes the number of
structures retrieved that did not belong to the family;
and N
miss
refers to the family members that were not
retrieved. Figure 4 shows the Precision-Recall curve
for all seven protein structure families used in this
experiment, when employing the various
representations described in Section 2.1. The figure
shows that our system is able to locate family
members accurately and precisely.
We first discuss the results obtained by the 3D
protein structure signature component of our system.
For the 3D tube representation, the results indicate
that our algorithm was able successfully locate the
family members in all cases, when searching a
database of 53.000 structures. In the case of the red
fluorescent and β-catenin interacting ICAT protein
structures, our system also found additional family
members which have not yet been classified in the
SCOP system. For the l-aspartase/fumarase, our
system was able to locate the eight similarly shaped
structures, while two other structures (1hy0 and
1u16) were not retrieved due to their distinct shape.
Interestingly, the protein structure of the Western
graylag goose (1xwo) is found in position 4, which
has a shape very similar to that of the domestic duck.
Also, the results show that, with the van der Waal
representation, our system provides good results.
Next, we consider the results when using the 2D
protein structure signature, considering the four
different representations as introduces in Section 2,
again against the above-mentioned seven protein
families. The results, as shown in Figure 4, indicate
that the 2D algorithm is also able to find family
members accurately, for the first three
representations employed, but with a slightly lower
precision and recall than the 3D component. The
reason for this lies in the fact that, the 2D
representation is more ambiguous than the 3D
representation, in the sense that the later is based on
the geometrical 3D shape, while the former is based
on four 2D projections of the associated 3D shape.
Why, then, include the 2D representations? The
strength of the 2D representation lies in the fact that
it may be employed when the chemical structure is
of particular interest or relevance. The colours of
protein structures provide us with a semantic key to
the functionality thereof: therefore, the 2D image
retrieval provides us with a complementary view, in
contrast to when we apply a shape-based
description. In this way, the results of 2D indexing
and similarity search may be utilised in order to
refine the results of a 3D query. The 2D approach
may be used in a generic way (four standard views)
or for analysing the docking view from a chemical
perspective.
Our experimental evaluation of the 2D
representation of the van der Waal representation
yielded inferior results. Our analysis indicates the
following reason for this. When using the 2D
representation, the inside of the protein is occluded
by the outer van der Waal spheres. That is, one is
only able to access the outer spheres, which creates
very similar patterns in terms of texture. In contrast,
for the 3D van der Waal representation, the entire
volume of the protein (inner as well as outer regions)
is analysed. Therefore, in the case of the 3D van der
Waal representation enough discrimination is
obtained.
FINDING PROTEIN FAMILY SIMILARITIES IN REAL TIME THROUGH MULTIPLE 3D AND 2D
REPRESENTATIONS, INDEXING AND EXHAUSTIVE SEARCHING
131
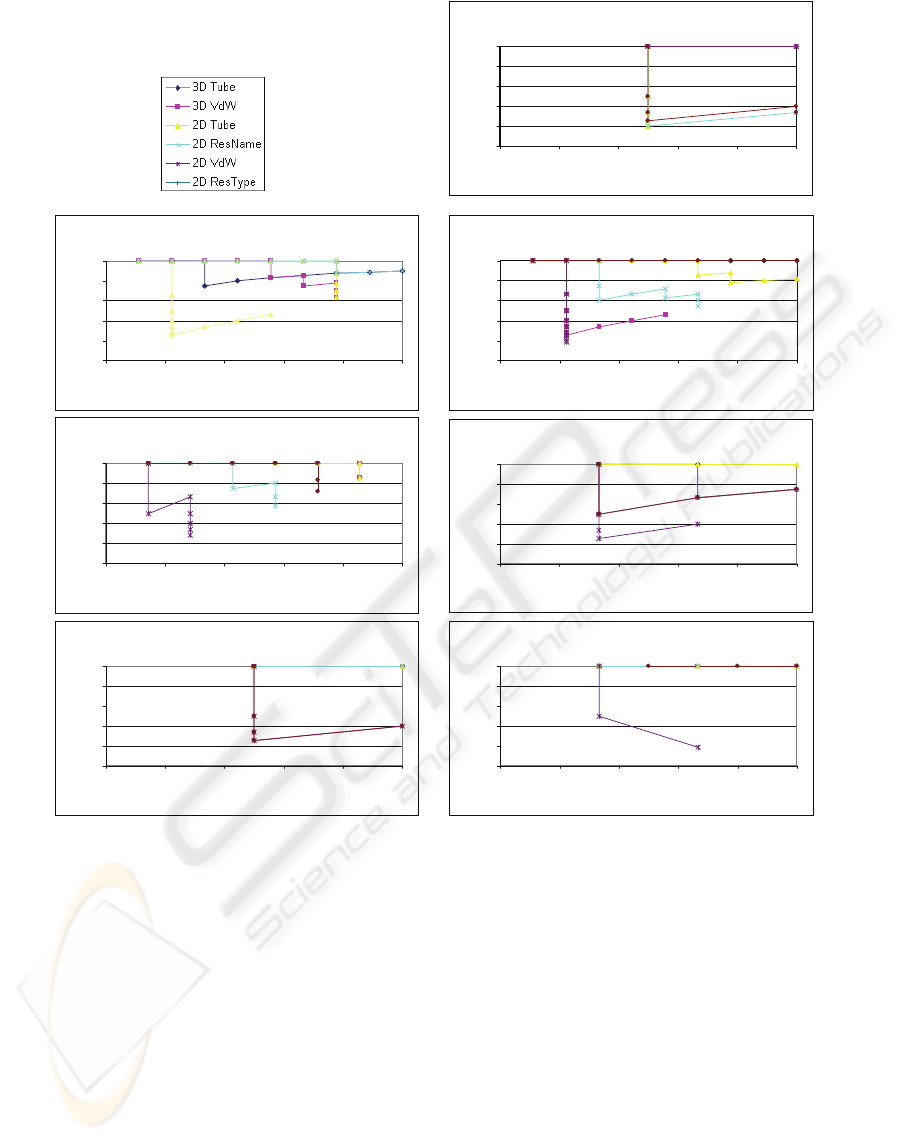
Figure 4: Precision-recall curves for the Seven (7) families with Six (6) Representations.
4 CONCLUSIONS
The number of known protein structures is
increasing rapidly. A total of 5.000 of the 53.000
proteins currently in the Protein Data Bank have
been added in the last year. With the foreseen
introduction of fast throughput systems, an
explosion in terms of the number of structures is
expected. There is an urgent need for systems to aid
the domain expert to classify such new structures,
and, prior to performing actual synthesis and
biological studies, computationally screen candidate
structures. The accurate recognition of relevant
protein structures is pertinent to unlock this
potentially rich source of information, for
applications such as drug design, studying protein-
protein interaction, the prediction of protein
function, and so on.
This paper presents our system, which employs
various 3D and 2D representations, to locate
families of protein structures, out of the 53.000
members of the Protein Data Bank. Not only were
we able to find most members of the family, but we
also found members of other families that are very
similar. This implies that, in addition to locating
families, we were able to recognize inter-family
similarities. The later results may prove itself useful
in order to replace a toxic or expensive protein by
Bacterial AB5 toxins
0
20
40
60
80
100
0 20406080100
Recall
Precision
Beta-cateniniteracting ICAT
0
20
40
60
80
100
0 20406080100
Reca ll
Precision
Ligand-gated channel
0
20
40
60
80
100
0 20406080100
Reca ll
Precision
Flourescent proteins
0
20
40
60
80
100
0 20406080100
Reca ll
Precision
Pyridoxal-dependent decarboxylse
0
20
40
60
80
100
0 20406080100
Reca ll
Precision
L-arpastase/fumarase
0
20
40
60
80
100
0 20406080100
Reca ll
Precision
Pyridoxine 5'
0
20
40
60
80
100
0 20406080100
Reca ll
Precision
KDIR 2009 - International Conference on Knowledge Discovery and Information Retrieval
132

another one presenting a similar functionality.
Furthermore, it was possible to divide some families
into two subgroups. This indicates that, despite the
fact that some structures belong to the same family,
their appearance are dissimilar enough to be grouped
in two distinct sub-families. In addition, an
exhaustive search and the ranking of proteins against
the entire Protein Data Bank may be performed in
under a second, as opposed to the approaches of
others, as introduced in Section 1. In these
algorithms, the search is either performed using a
very small subset, typically a few hundred.
Alternatively, these methods employ a non-
exhaustive search and rely on heuristic assumptions.
In comparison, our method performs a search on the
entire Protein Data Bank database without any such
a priori assumptions or query size constraints.
In future, we plan to conduct a robust empirical
comparative study contrasting our system with other
approaches in the field. We are also interested in
investigating whether using other similarity
measures will have an impact on our results [CS04]
and addressing the automatic classification of very
large databases of protein structures.
REFERENCES
Abeysinghe, S., Tao, J., Baker, M. L., Wah, C. (2008).
Shape Modeling and Matching in Identifying 3D
Protein Structures. Computer Aided Design, 40 (6),
708-720.
Akbar, S., Kung, J. and Wagner, R. (2006). Exploiting
Geometrical Proper-ties of Protein Similarity Search.
Proceeding of the 17th International Conference on
Database and Expert Systems Applications
(DEXA’06), Krakow, Poland, 228-234.
Andreeva A., Howorth D., Chandonia J.-M., Brenner S.E.,
Hubbard T.J.P., Chothia C., Murzin A.G. (2008). Data
growth and its impact on the SCOP database: new
developments. Nucl. Acid Res. 36, D419-D425.
Berman, H.M. et al. (2000). The Protein Data Bank.
Nucleic Acids Research, 28, 235-242.
Berman, H.M. et al. (2008). The Protein Data Bank.
http://www.wwpdb.org.
Chenyang, C., Zhen, L. (2008). Classification of 3D
Protein based on Structure Information Feature.
International Conference on Biomedical Engineering
and Informatics (BMEI 2008), Sanya, China, 98-101.
Chi, P.H., Scott, G., Shyu, C.-R. (2004). A Fast Protein
Structure Sys-tem Using Image-Based Distance
Matrices and Multidimensional Index. Proceeding of
the Fourth IEEE Symposium on Bioinformatics and
Bioengineering (BIBE’04), Taichung, Taiwan, 522-
532.
Cui, C., Shi, J. (2004). Automatic retrieval of 3D Protein
Structures based on Shape Similarity. SPIE: Storage
and Retrieval Methods and Application for
Multimedia, 5397, 543-549.
Daras, P. et. al. (2006). Three-dimensional shape-
structure comparison method for protein classification.
IEEE/ACM Transactions on Computational Biology
and Bioinformatics, 3(3), 193-207.
Huang, z. et. al. (2006). 3D Protein Structure Matching by
Patch Signatures. DEXA 2006, LNCS 4080,
Springer-Verlag, Berlin, 528-537.
Lancia, G., Istrail, S. (2003). Mathematical Methods for
Protein Structure Analysis and Design. C.I.M.E
Summer School Advanced Lectures, Protein Structure
Comparison: Algorithms and Applications, LNBI
2666, Springer-Verlag, Berlin, 1-33.
Paquet, E., Viktor, H.L. (2007). CAPRI- Content-based
Analysis of Protein Structure for Retrieval and
Indexing, VLDB 2007 Workshop on Bioinformatics,
Vienna: Austria, VLDB Press, 10 pp.
Paquet, E., Viktor, H.L. (2007). Discovering Protein
Families using Invariant 3D Shape-based Signatures.
29
th
Annual International Conference of the IEEE
Engineering in Medicine and Biology Society (ECBS
2006), Lyon, France, 1204-1208.
Paquet, E., Viktor, H. L. (2008). CAPRI/MR: Exploring
Protein Databases from a Structural and
Physicochemical Point of View. 34th International
Conference on Very Large Data Bases (VLDB 2008),
Auckland, New Zealand, 1504-1507.
Ohkawa, T., Nonomura, Y., Inoue, K. (2004). Logical
Cluster Construction in a Grid Environment for
Similar Protein Retrieval. Proceeding of the 2004
International Symposium on Applications and the
Internet Workshops (SAINTW’04), Tokyo, Japan, 5-
16.
Park, S.-H., Park, S.-J., Park, S.H. (2005). A Protein
Structure Retrieval System Using 3D Edge Histogram,
Key Engineering Materials. 277-279, 324-330.
Yeh, J.-S., Chen, D.-Y., Ouhyoung, M. (2005). A Web-
based Protein Retrieval System by Matching Visual
Similarity. Bioinformatics, 21 (13), 3056-3057.
Ying, Z.; Kaixing, Z., Yuankui, M. (2008). 3D Protein
Structure Similarity Comparison using a Shape
Distribution Method. 5th International Conference on
Information Technology and Applications in
Biomedicine in conjunction with 2nd International
Symposium & Summer School on Biomedical and
Health Engineering, Shenzhen, China, 233-236.
Zaki, M. J., Bystroff (2008). Protein Structure Prediction.
Totowa, NJ: Humana Press.
FINDING PROTEIN FAMILY SIMILARITIES IN REAL TIME THROUGH MULTIPLE 3D AND 2D
REPRESENTATIONS, INDEXING AND EXHAUSTIVE SEARCHING
133
