A SEMI-SUPERVISED ENSEMBLE ALGORITHM WITH
PROBABILISTIC WEIGHTS
Heidy-Marisol Marin-Castro, Miguel Morales-Sandoval
University Politecnic of Victoria, Information Technology Department
Calzada Gral. Luis Caballero 1200, Tamaulipas, Mexico
{hmarinc, mmorales}@upv.edu.mx
L. Enrique Sucar, Eduardo F. Morales
National Institute of Astrophysics, Optics and Electronics, Computer Science Department
Luis Enrique Erro 1, 72840, Puebla, Mexico
{esucar, emorales}@inaoep.mx
Keywords:
Classification, Ensemble, Adaboost, Semi-supervised learning.
Abstract:
This paper introduces a semi-supervised ensemble of classifiers, called WSA(Weighted Semi-supervised Ad-
aBoost). This ensemble can significantly improve the data classification data by exploiting the use of labeled
and unlabeled data. WSA is based on Adaboost, a supervised ensemble algorithm, however, it also considers
the unlabeled data during the training process. WSA works with a set of Naive Bayes base classifiers which
are combined in a cascade-based technique as in AdaBoost. At each stage of WSA, the current classifier of
the ensemble is trained using the classification results of labeled and unlabeled data obtained by the classifier
at the previous stage. Then, classification is performed and the results are used for training the next classi-
fier of the ensemble. Unlike other semi-supervised approaches, the unlabeled instances are weighted using a
probabilistic measurement of the predicted labels by the current classifier. This reduces the strong bias that
dubious classification of unlabeled data may produced on semi-supervised learning algorithms. Experimental
results on different benchmark data sets show that this technique significantly increases the performance of a
semi-supervised learning algorithm.
1 INTRODUCTION
Classification techniques have gained popularity in
recent years due their efficacy for solving a variety of
problems, such as in drug discovery, banking transac-
tions for predicting behavior of client accounts, med-
ical diagnose, weather prediction, frauds detection,
character recognition, detection of chromosome prob-
lems, image retrieval, among others.
Classification consists on assigning a label or cat-
egory previously established to an object (instance or
example) or physic phenomenon as accurate as possi-
ble (Mitchell, 1997). The instances are described by
a tuple v = {v
1
,v
2
,··· , v
n
} of values, known as char-
acteristic vector. A classifier learns a function from
training data that consist of characteristic vectors and
their corresponding desired labels. The task of the
classifier is to predict the value of the function for any
valid input characteristic vector after having seen a
number of training examples.
In the literature there have been proposed several
algorithms for solving the classification task (Domin-
gos et al., 1997; Freund and Schapire, 1996; Quinlan,
1996; Yarowsky, 1995). In a supervised algorithm
(Mitchell, 1997) the training set is a set of instances
already labeled.
Supervised algorithms need to be supplied with a
large mass of instances, each with the correct class at-
tached to it, to accurately label new instances in the
future. These samples have to be manually labeled by
a human annotator, which requires previous knowl-
edge of the application domain. The process itself is
expensive and can be very slow and error-prone.
In semi-supervised algorithms (Chapelle et al.,
2006), both labeled and unlabeled instances are used
in the training process. Semi-supervised techniques
exploit the hidden structural information in the unla-
beled instances and combine it with the explicit in-
formation of labeled instances to improve the classi-
fication performance. However, that semi-supervised

learning can damage the classification when the ini-
tial modeling assumptions are incorrect. In particu-
lar if the classifier is inadequate for the task or when
there is a different bias in the data distribution of la-
beled and unlabeled data. In order to tackle this prob-
lem, in this paper we propose the use of an ensemble
of classifiers that shows a robust performance across
domains and weights the unlabeled instances accord-
ing to the probability of predicted labels. WSA was
experimentally evaluated and compared against other
classifiers on several datasets with very promising re-
sults.
The rest of this paper is organized as follows: Sec-
tion 2 describes the related work and the Adaboost
algorithm. Section 3 discusses the proposed WSA al-
gorithm. Section 4 presents the experimental results
of WSA on different datasets and finally, Section 5
concludes this work and gives the directions for fu-
ture work.
2 RELATED WORK
There are several works in the literature based on
boosting techniques using semi-supervised learning
framework (Bennett et al., 2002; Buc et al., 2002).
Boosting is a popular learning method than can pro-
vides a framework for improving the performance of
any given leaner by building an ensemble of clas-
sifiers. In (Buc et al., 2002), the authors extended
MarginBoost into a semi-supervised framework, in
an algorithm called SSMBoost for binary class prob-
lems. They developed a margin definition for unla-
beled data and a gradient descent algorithm that corre-
sponds to the resulting margin cost function. They use
a mixture model trained with the Expectation Max-
imization algorithm as base classifier. Our work is
based on the use of probability of predicted labels
by the current classifier to weight the unlabeled data,
which can be labeled with multiple class.
Other approach is present in (Bennett et al., 2002).
The author proposed a new algorithm called ASSEM-
BLE, that assigns pseudo-classes and small weights
to all unlabeled examples and weights the labeled ex-
amples according to a starting classifier. From then
on, the unlabeled data are classified with the current
classifier and the weights are assigned to instances
as in AdaBoost (Freund and Schapire, 1996). In
(Chen and Wang, 2008) the authors propose a local
smoothness regularizer to semi-supervised boosting
algorithms based on the universaloptimization frame-
work of margin cost functionals.
The new semi-supervised ensemble of classifiers
proposed in this work, called WSA, differs from AS-
SEMBLE and SSMBoost in how labeled and unla-
beled instances are weighted. Unlabeled instances are
weighted according to a confidence measure based on
the probability of the predicted label, while the la-
beled instances are weighted according to the clas-
sifier error as in AdaBoost. The use of weights in
the learning process reduces the initial bias induced
by the first classifier on the unlabeled data. This bias
could reduce the performance of the ensemble, as it
occurs in many semi-supervised algorithms.
Our new semi-supervised ensemble WSA is based
on the supervised multi-class AdaBoost ensemble,
which is described in the next section.
2.1 AdaBoost
The main idea of AdaBoost is to combine a series
of base classifiers using a weighted linear combina-
tion. Each time a new classifier is generated, it tries
to minimize the expected error by assigning a higher
weight to the samples that were wrongly classified in
the previous stages. Formally, AdaBoost starts from
a set L of labeled instances, where each instance, x
i
,
is assigned a weight, W(x
i
). It considers N classes,
where the known class of instance x
i
is y
i
. The base
classifier is h, and h
t
is one of the T classifiers in the
ensemble. AdaBoost produces a linear combination
of the H base classifiers, F(x) =
∑
t
α
t
h
t
, where α
t
is the weight of each classifier. The weight is pro-
portional to the error of each classifier on the train-
ing data. Initially the weights are equal for all the
instances, and these are used to generate the first base
classifier, h
1
(using the training algorithm for the base
classifier, which should consider the weight of each
instance). Then the error, e
1
of h
1
is obtained by
adding the weights of the incorrectly classified in-
stances. The weight of each correctly classified in-
stance is decreased by the factor β
t
= e
t
/(1− e
t
), and
these weights are used to train the next base classifier.
The cycle is repeated until e
t
≥ 0.5 or when a prede-
fined maximum number of iterations is reached. Ad-
aBoost final classifier is a linear combination of the T
classifiers, whose weights are proportional to β
t
(see
Algorithm 1).
3 WSA (WEIGHTED
SEMI-SUPERVISED
ADABOOST)
WSA receives a sets of labeled data (L) and unlabeled
data (U). An initial weight =
1
|L|
is assigned to all
examples in L. The first classifier h
1
is built using
Algorithm 1. AdaBoost algorithm.
Require: L: Labeled instances
L = {(x
1
,y
1
),(x
2
,y
2
),...,(x
m
,y
m
)}, T: Iterations,
C: weak classifier, W: weighted vector
Ensure: Final Hypothesis:
H
f
= argmax
T
∑
t=1
log
1
B
t
h
t
1: Initialize W: W
1
(x
i
) =
1
|L|
2: for t from 1 to T do
3: Call C: h
t
= C(L,W
t
(x
i
)))
4: Compute the error:
e
t
=
N
∑
i=1
W
t
(x
i
) if h
t
(x
i
) 6= y
i
5: if e
t
≥ 0.5 then
6: exit
7: end if
8: B
t
=
e
t
(1− e
t
)
9: Re-compute W:
W
(t+1)
(x
i
) = W
t
(x
i
) ∗ B
t
if h
t
(x
i
) = y
i
10: end for
L.The labels in L are used to evaluate the error of
h
1
. As in AdaBoost, the error is used to weight the
examples, increasing the weight of the misclassified
examples and decreasing the weight of the correctly
classified examples. The initial classifier, h
1
is used
to predict a class for the unlabeled examples, U, as-
signing a probability to each class. The class with the
highest predicted probability of each instance in U is
selected, and the weight of each instance (initially
1
|U|
)
is reduced by multiplying it by this probability. Un-
labeled examples with high probability of their pre-
dicted class will have more influence in the construc-
tion of the next classifier than examples with lower
probabilities, thus reducing a possible bias introduced
by the untrusted labels in the learning process. All
the weights of {L∪U} are normalized, increasing the
weight of the wrongly classified examples in L and
reducing the influence of the examples in U with low
probability class values. The next classifier h
2
is built
using the weights and predicted class of {L∪U}. h
2
makes new predictions on U and the error of h
2
is ob-
tained considering all the examples with the predicted
class of the previous classifier for U.
Again, the error es used to obtain β
2
which is used
to multiply all the correctly classified examples in L
and all the examples in U, which are further multi-
plied by their predicted probability. This process con-
tinues, as in AdaBoost, for a predefined number of cy-
cles or when a classifier has a weighted error greater
or equal to 0.5. As in AdaBoost, new instances are
Algorithm 2. Weighted Semi-supervised AdaBoost
(WSA) algorithm.
Require: L: labeled instances, U: unlabeled in-
stances, T: Iterations, C:weak classifier
Ensure: Final Hypotesis and probabilities:
H
f
=argmax
T
∑
t=1
log
1
B
t
h
t
1: W
0
(x
i
) =
1
|L|
,∀x
i
∈ L
//Initial weights for
L
2: h
1
= C(L,W
0
(x
i
))
//Initial classifier
3: e
1
=
N
∑
i=1
W
0
(x
i
) if h
1
(x
i
) 6= y
i
,∀x
i
∈ L
4: B
1
=
e
1
(1− e
1
)
5: W
1
(x
i
) = P(x
i
,h
1
)∗B
1
∀x
i
∈ U
//where
P(x
i
,h
1
)
the class value with the highest
probability for instance
i
6: for t from 2 to T do
7: W
t
(x
i
) =
W
t−1
(x
i
)
N
∑
i=1
W
t−1
(x
i
)
,∀x
i
∈ {L∪U}
//Normalized weights
8: h
t
= C({L∪U},W
t
(x
i
))
9: e
t
=
N
∑
i=1
W
t
(x
i
) if h
t
(x
i
) 6= y
i
, ∀x
i
∈ {L∪U}
10: if e
t
≥ 0.5 then
11: exit
12: end if
13: B
t
=
e
t
(1− e
t
)
∀x
i
∈ L
14: W
(t+1)
(x
i
) = P(x
i
,h
t
) ∗ B
t
∀x
i
∈ U
15: end for
classified using a weighted sum of the predicted class
of all the constructed base classifiers. WSA is de-
scribed in algorithm 2.
The weights of the misclassified labeled data are
increased and the weights of the correctly classified
data are decreased, as in AdaBoost. The unlabeled
examples are considered as labeled data to evaluate
the error of the next classifier, however, their weights
are proportional to their probability class and to the
error of the previous classifier. This means that their
weights are smaller that the weights of the misclas-
sified labeled data which have more influence in the
construction of the next classifier. They can still,
however, affect the error of the current classifier and
”push” the weights of the incorrectly classified la-
beled examples, increasing the focus of the next clas-
sifier. Nevertheless, the weights of the unlabeled data
with low probability class will have a very low influ-
0 50 100
0.4
0.5
0.6
0.7
0.8
0.9
1
Percent Labeled Data
Accuracy(%)
a) DERMATOLOGY
WSA
SA
AdaBoost
NaiveBayes
0 50 100
0.4
0.5
0.6
0.7
0.8
Percent Labeled Data
Accuracy(%)
b)TAE
0 50 100
0.4
0.5
0.6
0.7
0.8
0.9
1
Percent Labeled Data
Accuracy(%)
c) WINE
0 50 100
0.4
0.5
0.6
0.7
0.8
0.9
1
Percent Labeled Data
Accuracy(%)
d) LYMPHOGRAPGY
0 50 100
0.5
0.6
0.7
0.8
0.9
Percent Labeled Data
Accuracy(%)
e)TIC−TAC−TOE
0 50 100
0.65
0.7
0.75
0.8
Percent Labeled Data
Accuracy(%)
f) PIME−INDIANS−DIABETES
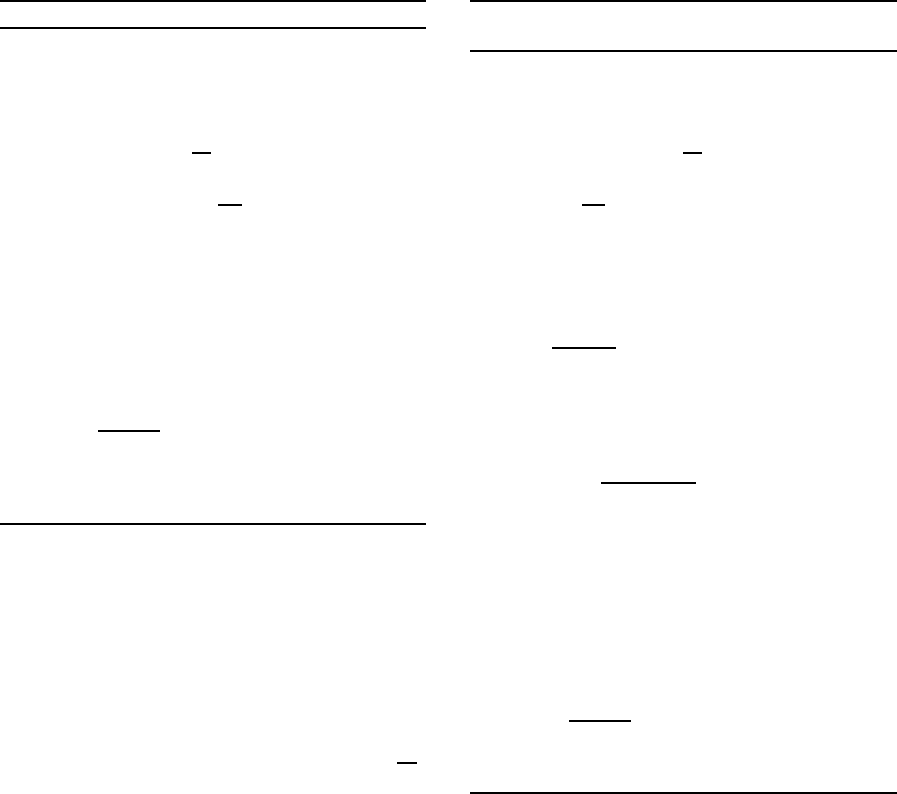
Figure 1: Performance of WSA (red/asterisk), SA (blue/cross), AdaBoost (green/circle) and NB(gray diamond) in:
(a)Dermatology, (b)Tae (c)Wine, (d)Lymphography, (e)Tic-tac-toe, and (f)Pima-indians-diabetes data sets from the UCI
Repository
ence in the next classifier. Since we are not sure of the
correct label for the unlabeled data, that can change
from one cycle of the next one as they are reclassified,
these examples do not keep a history of their previous
weights. The weights of the unlabeled data can be
seen as a catalyst for the construction of the next clas-
sifier that tries to reduce the margin of the labeled data
but whose influence is proportional to how much we
trust their labels.
The main differences of WSA respect to Ad-
aBoost are: (i) WSA uses labeled and unlabeled data,
(ii) the base classifiers create new class labels for the
unlabeled instances, and (iii) the weights assigned to
the original unlabeled data depends on its predicted
probability class. As in AdaBoost, new instances are
classified using a weighted sum of the predicted class
of all the constructed base classifiers.
4 EXPERIMENTS AND RESULTS
WSA was tested on data-sets from UCI Machine
Learning Repository (Newman et al., 1998), on the
Corel image collection, and on the datasets used by
ASSEMBLE. WSA was compared against AdaBoost
and SA, a version of WSA that does not uses weights
in the classification process. SA combine labeled data
anda unlabeled data assigning the same weights to
unlabeled instances. The instances or samples were
described by characteristic vectors with numeric at-
tributes. These attributes were discretized into ten
bins using WEKA (Witten and Frank, 2005). In all
the tests, the algorithms were evaluated by their pre-
dicted average accuracyusing 10-foldcross validation
(Witten and Frank, 2005) for different percentages of
unlabeled data on the training sets.The base classi-
fier used for WSA was Naive Bayes, although other
probability-based classifier could be used too.
To test and compare WSA, we initially used six
datasets from UCI repository: Dermatology , Tae,
Wine, Lymphography, Tic − tac − toe and Pime −
indians− diabetes, whose characteristics are given in
table 1. Figure 1 shows the performance of Naive
Bayes(NB), SA, AdaBoost and WSA.
WSA was also tested on a subset of the Corel im-
age collection, that are grouped according to differ-
ent topics, such as, sunsets, animals, buildings and
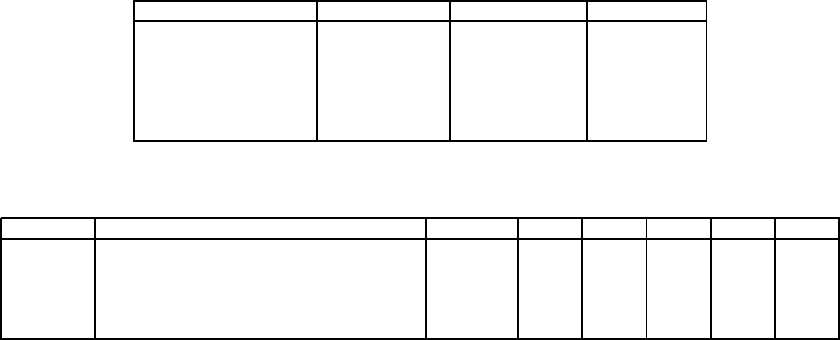
Table 1: Characteristics of the Dermatology, Tae, Wine, Lymphography, Tic-tac-toe and Pime-indians-diabetes
Data-sets Num-Instances Num-Attributes Num-Classes
Dermatology 366 34 6
Tae 151 6 3
Wine 178 14 3
Lymphography 148 18 4
Tic-tac-toe 958 9 2
Pime-indians-diabetes 768 8 2
Table 2: Characteristics of the Airplanes, Birds, Sunsets and Animals datasets.
Set Class Instances 10% 30% 50% 70% 90%
Airplanes sky, jet, cloud, plane, sunset and helicopter 127 40.83 55.00 76.66 90.08 99.16
Birds branch, bird, tree, grass, nest, rock 225 32.08 51.16 74.16 86.25 90.10
Sunsets sun, buildings, sky, trees, clouds, sea 178 35.00 40.62 43.75 64.37 80.75
Animals reptile, trees, clouds, bear, grass, water, 148 22.50 40.00 48.75 58.75 60.00
fox, sky, rock, snow
airplanes, among other. The size of these color im-
ages is 192x128 pixels. The images were segmented
with normalized cuts (five regions) and a set of visual
features was obtained per region as color, texture and
shape. We showthe performanceof WSA on four top-
ics: airplanes, birds, sunsets and animals. Each topic
has 100 images and a set of instances were randomly
selected from each topic as training sets. Different
classes were considered per topic. Table 2 shows the
characteristics of theses fours data-sets and the per-
formance obtained by the WSA algorithm using dif-
ferent percentage of labeled data. Since each image
is segmented into several regions, there can be more
instances that images for a particular class. The per-
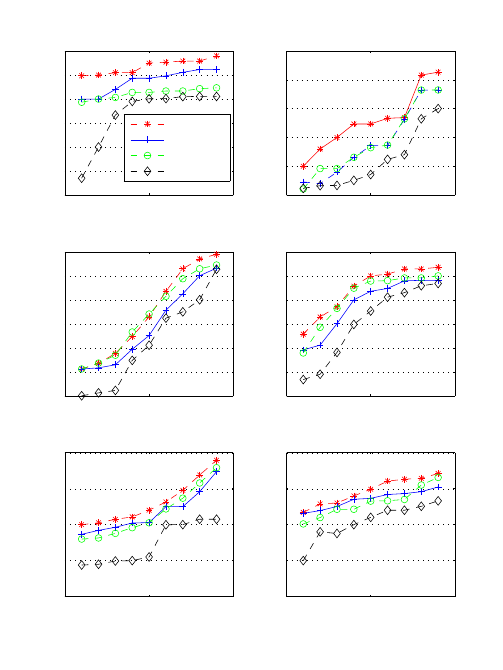
formance of WSA, SA, Naive Bayes and AdaBoost
on these datasets is show in figure 2.
WSA was also compared against ASSEMBLE
(see table 3) under the same conditions, that is, us-
ing the same datasets and the same percent of unla-
beled data. The results for ASSEMBLE were taken
from (Bennett et al., 2002). These results show the
accuracy obtained using ASSEMBLE, WSA and SA
algorithms.
From all results, it can be seen that WSA is con-
sistently better than SA and most of the times it is
better or roughly equal to AdaBoost. Results em-
pirically show that weighting the unlabeled instances
has a positive effect on the classification performance.
According to the presented results, the performance
of the classifier can be affected if weights are not used.
5 CONCLUSIONS
Normally a set of preciously annotated data is re-
quired to train a classifier, however, annotation of a
large quantity of data by hand is a tedious and time
consuming process. So, it is important to develop
methods that can make use of available unlabeled
data. This work introduced the semi-supervised en-
semble of classifiers WSA, well suited to be used
for automatic annotation. Semi-supervised learning
can damage the performance of a classifier when the
modeling assumptions are incorrect. Our ensemble of
classifiers uses a weighting mechanism for the unla-
beled data based on the probability of predicted labels
to mitigate this problem.
The experiments of WSA on data and images
show very promising results. Using unlabeled data
can improve the performance of AdaBoost, in partic-
ular, when there is a large number of unlabeled data.
Also WSA has in many cases a better performance
than SA, and NaiveBayes, which show that using the
probability class value on the unlabeled data can have
a positive effect as it reduces the unwanted bias that
the unlabeled data ca produce in the classifier. The
experiments showed that in many cases using unla-
beled data without the dynamic weightings is worst
that just using the labeled data. As future work we
plan to perform a more comprehensive experimenta-
tion with other data sets and tests other schemes to
consider the influence of unlabeled data into a semi-
supervised framework.
20 40 60 80 100
0.2
0.4
0.6
0.8
1
Percent Labeled Data
Accuracy (%)
a) Airplanes
WSA
SA
AdaBoost
NaiveBayes
20 40 60 80 100
0.2
0.4
0.6
0.8
1
Percent Labeled Data
Accuracy (%)
b) Birds
WSA
SA
AdaBoost
NaiveBayes
20 40 60 80 100
0.2
0.4
0.6
0.8
1
Percent Labeled Data
Accuracy (%)
c) Sunsets
20 40 60 80 100
0.2
0.4
0.6
0.8
1
Percent Labeled Data
Accuracy (%)
d) Animals
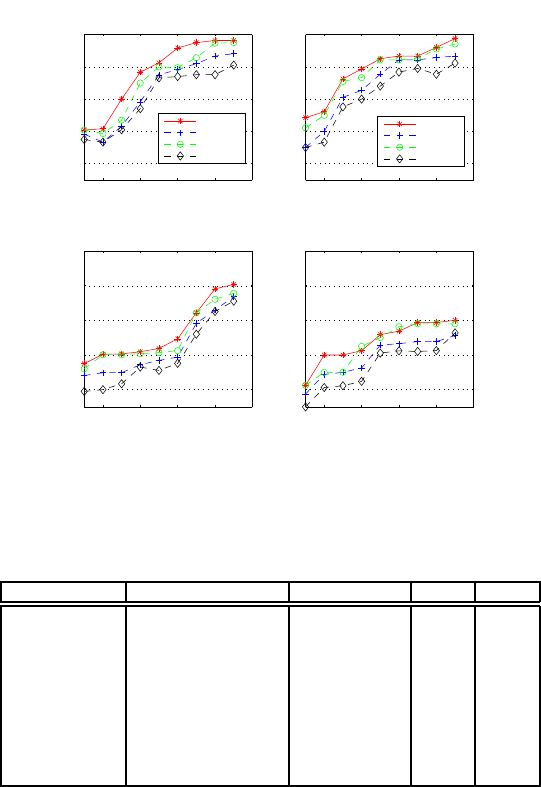
Figure 2: Performance of WSA (red/asterisk), SA (blue/cross), AdaBoost (green/circle) and NB(gray diamond) on images of:
(a)Airplanes, (b)Birds (c)Sunsets and (d)Animals, from the Corel database
Table 3: Comparison (accuracy) among ASSEMBLE, SA and WSA, using different datasets and percent of unlabeled data.
Dataset Unlabeled Data(%) ASSEMBLE SA WSA
Breast Cancer 60 67.93 67.05 68.08
Breast Cancer 40 68.64 69.20 72.19
Breast Cancer 20 69.74 71.07 73.08
Diabetes 60 72.48 66.65 66.91
Diabetes 40 72.79 67.37 68.15
Diabetes 20 73.08 68.23 70.10
Wisconsin 50 95.66 95.20 96.81
Wisconsin 25 95.85 96.36 97.24
Wisconsin 10 95.16 97.57 98.98
REFERENCES
Bennett, K., Demiriz, A., and Maclin, R. (2002). Exploit-
ing unlabeled data in ensemble methods. In Proceed-
ings of the Eighth ACM SIGKDD International Con-
ference on Knowledge Discovery and Data Mining,
pages 289–296, NY. ACM Press.
Buc, D. F., Grandvalet, Y., and Ambroise, C. (2002). Semi-
supervised marginboost. In Advances in Neural Infor-
mation Processing Systems (NIPS), pages 553–560.
Chapelle, O., Sch¨olkopf, B., and Zien, A. (2006). Semi-
Supervised Learning (Adaptive Computation and Ma-
chine Learning). The MIT Press.
Chen, K. and Wang, S. (2008). Regularized boost for semi-
supervised learning. In Advances in Neural Informa-
tion Processing Systems, pages 281–288.
Domingos, P., Pazzani, M., one Loss, U. Z., Domingos, P.,
and Pazzani, M. (1997). On the optimality of the sim-
ple bayesian classifier under zero-one loss.
Freund, Y. and Schapire, R. (1996). Experiments with a
new boosting algorithm. In International Conference
on Machine Learning, pages 148–156.
Mitchell, T. (1997). Machine Learning. McGraw Hill,
Carnegie Mellon University.
Newman, D., Hettich, S., Blake, C., and Merz,
C. (1998). UCI Repository of machine learn-
ing databases. University of California, Irvine.
http://www.ics.uci.edu/∼mlearn/MLRepository.html.
Quinlan, J. R. (1996). Bagging, boosting, and c4.5. In In
Proceedings of the Thirteenth National Conference on
Artificial Intelligence, pages 725–730. AAAI Press.
Witten, I. and Frank, E. (2005). Data Mining: Practical
machine learning tools and techniques. 2nd Edition,
Morgan Kaufmann, San Francisco.
Yarowsky, D. (1995). Unsupervised word sense disam-
biguation rivaling supervised methods. In Proceed-
ings of the 33rd Annual Meeting of the Association
for Computational Linguistics, pages 189–196.
