
TEXTURE
REPRESENTATION AND RETRIEVAL BASED ON
MULTIPLE STRATEGIES
Noureddine Abbadeni
King Saud University, College of Computer and Information Sciences, PO BOX 51178, Riyadh 11543, Saudi Arabia
Keywords:
Information retrieval, Texture, Multiple strategies, Multiple queries, Multiple representations.
Abstract:
We propose an approach based on the fusion of multiple search strategies to content-based texture retrieval.
Given the complexity of images and users’ needs, there is no model or system which is the best than all
the others in all cases and situations. Therefore, the basic idea of multiple search strategies is to use several
models, several representations, several search strategies, several queries, etc. and then fuse (merge) the results
returned by each model, representation, strategy or query in a unique list by using appropriate fusion models.
Doing so, search effectiveness (relevance) should be improved without necessarily altering, in an important
way, search efficiency. We consider the case of homogeneous textures. Texture is represented by three (3)
models/viewpoints. We consider also the special case of invariance and use both multiple representations and
multiple queries to address this difficult problem. Benchmarking carried out on two (2) image databases show
that retrieval relevance (effectiveness) is improved in a very appreciable way with the fused model.
1 INTRODUCTION
Content-based image retrieval (CBIR) from image
databases has became a very active research areas in
the last years and many approaches have been pro-
posed and various results and systems have been car-
ried out since then (Datta et al., 2008). In visual
CBIR, content representation and similarity matching
are fundamental issues. Content representation can be
seen as a model which captures as much as possible
the relevant visual information contained in images.
Similarity can be defined as a mapping function be-
tween the set or vector of parameters representing the
content of images and a positive real value chosen to
quantify the degree of visual resemblance between the
compared images. More recently, researchers have
paid more attention to other approaches including, in
particular, relevance feedback-based image retrieval
(Zhou and Huang, 2003) which allows integration of
user judgments of relevance in the retrieval loop, and
semantics-based image retrieval ((Lu et al., 2000),
(Sun and Ozawa, 2003)) which is a tentative to use
semantic features through learning and users’ anno-
tations on images. These approaches allow generally
a noticeable improvement in search relevance even if
they can be criticized at least on the fact that an im-
portant effort is asked to users to give relevance judg-
ments or to perform annotations on images.
One approach, which still a pure visual CBIR, has
not received enough attention. This approach is data
fusion (Belkin et al., 1993), (Lee, 1997), (Wu and
Crestani, 2002). Results fusion is a subpart of data fu-
sion. In CBIR, among the rare works dealing explic-
itly with data fusion, we cite (Berretti, 2004), (French
et al., 2003). In (Berretti, 2004), a data fusion model
working on distributed collections of images is pro-
posed based on a normalization procedure of similar-
ities among the various image collections. In (French
et al., 2003), a results fusion model working on a cen-
tralized image collection is proposed based on multi-
ple representations, called viewpoints or channels, of
both the query and the images in the database. They
used four channels: the original color images, their
corresponding grey-level images and their negatives.
Results merging coming from different channels is
shown to improve performance in a very important
way. Note that results fusion differs from a feature
integration/combination approach since in the former
approach we use multiple representations for the same
feature while in the latter approach we use multiple
features but with one representation for each feature.
The work presented in this paper explores the idea
of results fusion and applies it in the case of textures
retrieval. Texture content is represented by two differ-
ent models: the autoregressive model and a percep-
tual model based on a set of perceptual features such
53
Abbadeni N. (2009).
TEXTURE REPRESENTATION AND RETRIEVAL BASED ON MULTIPLE STRATEGIES.
In Proceedings of the International Conference on Knowledge Discovery and Information Retr ieval, pages 53-61
DOI: 10.5220/0002299900530061
Copyright
c
SciTePress

as coarseness and contrast. The perceptual model is
considered in two viewpoints: the original image’s
viewpoint and the autocovariance function viewpoint.
Computational measures are based on these two view-
points. So we have a total of three models/viewpoints
(called representations). We consider also the spe-
cial case of invariance, we introduce multiple queries,
along with multiple representations, to address this
problem. Benchmarking presented at the end of the
paper shows how a multiple representations, multiple
queries and results fusion can improve in very inter-
esting way the search effectiveness (relevance) with-
out, necessarily, altering, in an important way, search
efficiency.
The rest of this paper is organized as follows:
In section 2, we present the multiple representa-
tion models considered in this paper and we discuss
briefly their capacity to model textures; We also show
the benefits from using multiple representations and
present the results fusion models used to fuse results
returned by different representations; In section 3, we
consider the special problem of invariance and we in-
troduce multiple queries along with multiple repre-
sentations to address this difficult problem; In section
4, benchmarking over 2 image databases using the re-
call graph is presented and discussed; And finally, in
section 5, a conclusion is given and further investiga-
tions related to this work are briefly discussed.
2 MULTIPLE
REPRESENTATIONS AND
RESULTS FUSION
2.1 Multiple Representations
To represent content of textures, we use two differ-
ent models, the autoregressive model and a perceptual
model based on a set of perceptual features(Abbadeni
et al., 2000). The autoregressive used is a causal
simultaneous AR model with a non-symmetric half-
plan (NSHP) neighborhood with four neighbors. The
perceptual model is considered with two viewpoints:
the original image’s viewpoint and the autocovariance
function (associated with original images) viewpoint.
Each of the viewpoints of the perceptual model used
is based on four perceptual features, namely coarse-
ness, directionality, contrast and busyness. So we
have a total of three content representations, each hav-
ing a vector of parameters of size four for a total of
twelve parameters.
The set of features of the perceptual model have
a perceptual meaning by construction. The set of
features derived from the autoregressive model have
no perceptual meaning by construction. A percep-
tual interpretation of the set of features derived from
the autoregressive model was proposed by (Abbadeni,
2005a). This perceptual interpretation consists in con-
sidering those features as a measure of the random-
ness/regularity of the texture.
2.1.1 The Autoregressive Model
The autoregressive model is characterized, in particu-
lar, by a forecasting property that allows to predict the
grey-level value of a pixel of interest in an image by
using the grey-level values of pixels in its neighbor-
hood. The autoregressive model, when used to model
a textured image, allow to estimate a set of parameters
(their number corresponds to the number of neighbors
considered), each one corresponds to the contribution
of its corresponding pixel in the forecasting of the
pixel of interest (the total of contributions of all pixels
in an image is close to 100%).
The simultaneous (2D) autoregressive model
(SAR) model is defined as follows:
(X
s
− µ) = a
s
W
s
+
∑
r ∈ Ω
+
a
r
(X
s+r
− µ) (1)
where s corresponds to position (i, j) on rows and
columns, X
s
is the grey-level at position s, Ω
+
is the
neighborhood on rows and columns of X
s
(excluding
X
s
itself), Ω = Ω
+
∪ {s}, µ is the local grey-level av-
erage in the neighborhood Ω and [a
s
, a
r
, r ∈ Ω
+
] are
the parameters of the model to be estimated. W
s
is
a Gaussian white noise, a stationary signal made of
non-correlated random variables, defined as follows:
E[W
s
] = 0
E[W
s
W
s+r
] =
½
1 if r = (0, 0)
0 otherwise
E[W
s
X
s+r
] =
½
a
s
if r = (0, 0)
0 otherwise
(2)
Neighborhood Ω can be defined in different ways.
We use causal neighborhoods. The causality con-
straint implies that pixels are ordered in a sequential
way (from top to bottom and from left to right). There
are two causal neighborhoods: quarter-plan (QP)
neighborhood and non-symmetric half-plan (NSHP)
neighborhood.
One of the popular methods that can be used to
estimate the set of parameters [a
s
, a
r
, r ∈ Ω
+
] is the
well-known least squares error (LSE) method. Esti-
mation error E
s
(corresponding to W
s
in equation(1))
of X
s
is given by:
KDIR 2009 - International Conference on Knowledge Discovery and Information Retrieval
54

E
s
=
1
a
s
∑
r ∈ Ω
b
r
(X
s+r
− µ) (3)
where b
0
= 1 and b
r
= −a
r
∀r 6= 0.
The quadratic error in all the image is given by:
E =
∑
s ∈ I
(
1
a
s
∑
r ∈ Ω
b
r
(X
s+r
− µ))
2
(4)
where coefficients [a
s
, b
r
, r ∈ Ω
+
] are estimated so
that E is minimal, this implies:
∂E
∂b
r
= 0 (5)
∂E
∂a
s
= 0 (6)
By developing equations (5) and (6),), we ob-
tain the following equations (Frankot and Chellappa,
1997), (Kashyap and Chellappa, 1983):
(
∑
s
Z(s)Z
T
(s))A =
∑
s
Z(s)(X
s
− µ) (7)
a
2
s
=
1
N
2
∑
s
((X
s
− µ) − A
T
Z(s))
2
(8)
where Z(s) is equivalent to [X(s+r)−µ, r ∈ Ω
+
] and
A is the vector of parameters [b
r
, r ∈ Ω
+
] .
Note that in equation (7), Z(s)Z
T
(s) corresponds
to the covariances matrix computed in the considered
neighborhood. This means that parameters [a
r
, r ∈
Ω
+
] are estimated based on the covariances matrix.
The system of equations represented by (7) is a linear
one. Resolving this system allows to obtain parame-
ters [a
r
, r ∈ Ω
+
]. The LU decomposition method was
used to resolve this system. Resolving equation (8)
allows to obtain the noise parameter a
s
.
2.1.2 The Perceptual Model
The perceptual model, which is perceptual by con-
struction, is based on a set of three computational
measures that simulate three perceptual features:
coarseness, contrast, and directionality. Coarseness
was estimated as an average of the number of ex-
trema; Contrast was estimated as a combination of
the average amplitude of the gradient, the percentage
of pixels having the amplitude superior to a certain
threshold and coarseness itself; Directionality was es-
timated as the average number of pixels having the
dominant orientation(s).
Coarseness. Coarseness, denoted C
s
, is estimated
as the average number of maxima in the autocovari-
ance function. In fact, a coarse texture will have a
small number of maxima and a fine texture will have
a large number of maxima. The estimation equation
of coarseness is as follows:
C
s
=
1
1
2
× (
∑
n−1
i=0
∑
m−1
j=0
Max(i, j)
n
+
∑
m−1
j=0
∑
n−1
i=0
Max(i, j)
m
)
(9)
where Max(i, j) = 1 if pixel (i, j) is a maximum (a
maximum line or column) and Max(i, j) = 0 if pixel
(i, j) is not a maximum.
Contrast. Contrast, denoted C
t
, was estimated using
the following equation :
C
t
=
M
a
× N
t
×C
1
α
s
n × m
(10)
where M
a
represents the average amplitude,
N
t
n×m
represents percentage of pixels having an amplitude
superior than threshold t, and C
s
is the computational
measure of coarseness (
1
α
is a parameter used to make
C
s
significant against the quantity
M
a
×N
t
n×m
). Note also
the presence of coarsness in the estimation of contrast
since coarseness plays an important role to determine
if an image is well contrasted or not. In fact, an image
with a high degree of coarseness tends to be perceived
as being more contrasted than an image with a fine
coarseness.
Directionality. The degree of directionality is related
to the visibility of the dominant orientation(s) in an
image. Directionality was estimated as the number
of pixels N
Θ
d
having dominant orientation(s) Θ
d
. Let
Θ
d
(i, j) = 1 if pixel (i, j) has a dominant orientation
Θ
d
and Θ
d
(i, j) = 0 if pixel (i, j) does not have a dom-
inant orientation Θ
d
. The degree of directionality N
Θ
d
of an image can be expressed by the following equa-
tion:
N
Θ
d
=
∑
n−1
i=0
∑
m−1
j=0
Θ
d
(i, j)
(n × m) − N
Θ
nd
(11)
where N
Θ
nd
denotes the number of non-oriented pix-
els. The more N
Θ
d
is large, the more the image is di-
rectional. The more N
Θ
d
is small, the more the image
is non-directional.
The computational measures proposed for each
perceptual textural feature were evaluated by con-
ducting a set of experimentations taking into ac-
count human judgments and using a psychometric
method. The Spearman coefficient of rank-correlation
was used to evaluate the correlation between hu-
man judgements and computational rankings. Ex-
perimental results show very strong correspondence
between the proposed computational measures and
human rankings. Values of Spearman coefficient of
rank-correlation r
s
found are as follows: for coarse-
ness, r
s
= 0.913; for directionality, r
s
= 0.841; and
TEXTURE REPRESENTATION AND RETRIEVAL BASED ON MULTIPLE STRATEGIES
55

for contrast, r
s
= 0.755. Compared to related works
((Amadasun and King, 1989) and (Tamura et al.,
1978)), these perceptual features have more stronger
correlation with human judgements.
2.2 Similarity Matching
The similarity measure used is based on the Gower
coefficient of similarity denoted GS (Gower, 1971),
(Abbadeni, 2005b), (Abbadeni, 2003). The non-
weighted similarity measure can be defined as fol-
lows:
GS
i j
=
∑
n
k=1
S
(k)
i j
∑
n
k=1
δ
(k)
i j
(12)
Where S
(k)
i j
is the partial similarity between
images i and j according to feature k, δ
(k)
i j
represents
the ability to compare two images i and j on feature
k (δ
(k)
i j
= 1 if images i and j can be compared on
feature k and δ
(k)
i j
= 0 if not.
∑
n
k=1
δ
(k)
i j
= n if images i
and j can be compared on all features k, k = 1..n.).
Quantity S
(k)
i j
is defined as follows:
S
(k)
i j
= 1 −
|x
ik
− x
jk
|
R
k
(13)
Where R
k
represents a normalization factor. R
k
is
computed on the database considered for experimen-
tations and is defined as follows:
R
k
= Max(x
ik
) − Min(x
ik
) (14)
The weighed version of the similarity measure can
be defined as follows:
GS
i j
=
∑
n
k=1
w
k
S
(k)
i j
∑
n
k=1
w
k
δ
(k)
i j
(15)
Where w
k
corresponds to the weight associated
with feature k. As mentioned, w
k
can be either the
inverse of variance of feature k or the Spearman coef-
ficient of rank-correlation.
For more details and motivations behind the use of
Gower coefficient of similarity as a similarirty match-
ing measure, we refer the reader to (Abbadeni, 2003).
2.3 Fusion of Results Returned by
Multiple Representations
It has been reported in the literature on the subject
of data fusion, in the IR field, that different repre-
sentations of the same query or the images in the
database, or different search strategies for the same
query, etc. return different search results. Results fu-
sion is then the merging of the different results lists
returned by the different models, representations or
queries to form a unique fused (merged) list which is,
hopefully, more effective (relevant) than the separated
lists (Belkin et al., 1993), (Lee, 1997). Given several
list results returned by different representations, there
are three important phenomena that can be observed
(Vogt and Cottrell, 1999), (Lee, 1997). Generally, re-
sults fusion models found in literature exploit one or
several effects from these three important effects:
• Skimming effect: Each model retrieve a subset of
the relevant images and intersection between them
is rather low. A relevant image is retrieved, often,
by only one model. In this case, results fusion
must consider images that are ranked in top posi-
tions in different lists.
• Chorus effect: Different models retrieve approx-
imately the same results but with different ranks
and similarity values. In this case, a relevant im-
age is ranked by several models in top positions
(not necessarily the same position). The fact that
several models retrieve an image is a more con-
vincing evidence or proof that this image is rele-
vant to the query compared to the case where this
image is retrieved by only one representation. Re-
sults fusion, in this case, must take in considera-
tion all the representations used.
• Dark horse effect: Exceptionally, even a good
model can return some irrelevant images for a
given query. Generally, different models did not
return the same irrelevant images. Results fusion,
in this case, must consider all the representations
and use appropriate techniques to eliminate irrel-
evant images.
We have used and experimented three basic results
fusion models that are denoted FusMAX (or MAX),
FusCL (or CL) and FusComb (or Comb) defined re-
spectively as follows:
FusMAX
i j
= MAX(GS
M
k
i j
) (16)
FusCL
i j
=
∑
K
k=1
GS
M
k
i j
K
(17)
FusComb
i j
= Π
K
k=1
GS
M
k
i j
(18)
where GS represents the Gower-based similar-
ity score returned for each image, M
k
represents
model/viewpoint k, K represents the number of mod-
els/viewpoints used, i represents a given query, j
represents images that are found similar to query i
KDIR 2009 - International Conference on Knowledge Discovery and Information Retrieval
56

according to model M
k
and GS
M
k
i j
is the similar-
ity value between query i and image j when using
model/viewpoint M
k
. These fusion models use only
the values of the similarity function returned by the
considered model/viewpoint. Ranks can be also used.
We have used them as weights. In fact, more an im-
age is ranked at top positions, more is its weight in the
fusion models. Thus, we can define a weighted ver-
sion for each of the FusCL, FusMAX and FusComb
models. In such weighted models, each image j is
weighted with its rank in the list of results returned
for query i using model M
k
.
Fusion models FusCL and FusComb, both non-
weighted and weighted, exploit the chorus effect since
these models give more importance to images that
are retrieved and ranked in top positions by different
models/viewpoints. They also exploit the dark horse
effect since an irrelevant image that is ranked in top
positions by one model/viewpoint is not ranked at top
positions in the fused list given that this irrelevant im-
age is not ranked at top positions by the other mod-
els/viewpoints.
The FusMAX model exploits the skimming ef-
fect, to some extent, since this model takes images
that are classified in top positions in different results
lists but it re-ranks them according to similarity val-
ues.
Generally, when the chorus effect exists in an im-
portant way between different lists, the gain that we
can obtain by exploiting the skimming effect becomes
low and vice-versa (Vogt and Cottrell, 1999).
3 MULTIPLE QUERIES FOR THE
CASE OF INVARIANCE
3.1 Multiple Queries
Invariant image retrieval is the ability to retrieve all
relevant images to a query even if some of them
have been transformed according to different geomet-
ric and photometric transformations such as rotation,
scaling, illumination, viewpoint change and contrast
change as well as non-rigid transformations (Zhang
and Tan, 2002), (Lazebnik et al., 2004), (Abbadeni
and Alhichri, 2008).
We propose to use both multiple representations
and multiple queries to address this difficult problem.
We use multiple models/viewpoints to represent the
textural content of images. We used the same models
as the general case (autoregressive model, perceptual
model with two viewpoints). These models are not
necessarily invariant with respect to geometric and
photometric transformations. At the query level, we
use multiple queries to represent a user’s need. We
use appropriate results fusion models to merge results
returned by each model/viewpoint and then by each
query. Therefore, results fusion, in the case of invari-
ance, is performed in two successive levels: The first
level consists in merging results returned by differ-
ent representations for the same query (similar to the
general retrieval case); 2. The second level consists in
merging results returned by multiple queries.
Results fusion returned for different queries al-
lows to consider the fact that relevant images to a
given query image can be located in disjoint regions
in the space of features (French et al., 2003). The
use of only one query image, especially in the case
of invariance, will not retrieve, certainly, all the rel-
evant images depending on the degree of variance in
the considered database. With this approach, there
is computation overhead since we use several queries
for the same user’s need. However, the size of the
vector of parameters does not change for images in
the database. Only a user’s need is represented with
several queries, and thus with several vector of param-
eters. Thus, efficiency is not altered in an important
way.
3.1.1 Multiple Queries Fusion
We can use the same fusion models as in the case of
multiple representations fusion. However, those mod-
els did not give good results in experimental results
since the chorus and dark horse effects are not very
significant in the case of invariance. In fact, when us-
ing multiple queries, each with a different orientation,
scale, or contrast for example, the results returned for
each query contain, actually, a small number of com-
mon images since the content representation models
are not invariant. Models that can be used, in this
case, are those who are able to take, from each re-
sults list (for each query), the best results. This effect
is known as the skimming effect in the information
retrieval community (Vogt and Cottrell, 1999). The
MAX model defined previously exploits to some ex-
tent the skimming effect as we explained previously;
therefore it can be used in the case of invariance.
Another fusion model, exploiting also the skim-
ming effect, is a model known as the round
robin (RR) model in the literature (Belkin et al.,
1993), (Berretti, 2004). The RR technique makes
use of the rank of an image in the returned results
list rather than the value of the similarity function.
The RR technique consists simply in taking images
that are ranked in the first position in each list (cor-
responding to each query) and give them all the same
first position in the fused list, then taking images that
TEXTURE REPRESENTATION AND RETRIEVAL BASED ON MULTIPLE STRATEGIES
57
are ranked in the second position in each list (corre-
sponding to each query) and give them all the same
second position in the fused list and so on. We can
stop this process after a threshold of the similarity
value and/or the rank or after having retrieved a cer-
tain number of images. Obviously, if we find the same
image in different lists, which may occur occasion-
ally, only one image is considered. Note that the RR
technique exploits the skimming effect in a more ef-
fective way than the MAX model does.
4 EXPERIMENTAL RESULTS
AND BENCHMARKING
4.1 The General Case
4.1.1 Experimental Results
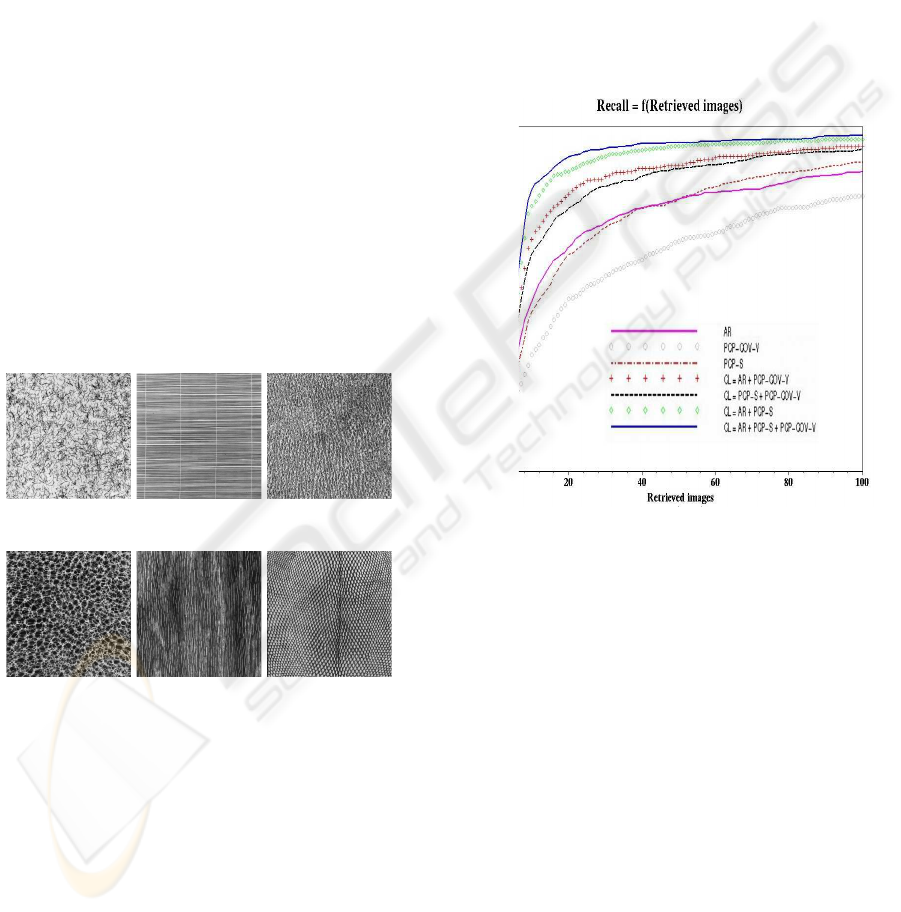
We have conducted a large experimentation on Bro-
datz database (Brodatz, 1966). Figure 1 gives a sam-
ple of images from Brodatz database. This database
contains 1008 128x128 images (112 classes; 9 images
per class).
D110 D49 D24
D111 D68 D36
Figure 1: Sample of images from Brodatz database.
Experimental results show that: 1. The autore-
gressive model in its non-weighted NSHP version
perform better that the other versions of the autore-
gressive model, 2. The weighted version, using
Spearman coefficients of rank-correlation, of the per-
ceptual model based on original images performs bet-
ter than the other versions of this model; 3. And, fi-
nally, the weighted version, using the inverse of vari-
ances, of the perceptual model based on the autoco-
variance function performs better than the other ver-
sions of this model. For results merging, the FusCL
model gives the best results compared to the Fus-
MAX model and gives similar results compared to
FusComb model. So, in the following, we will show
results for only these best models.
4.1.2 Evaluation
Recall is a common standard to benchmark search
relevance in information retrieval systems in general.
Recall, which can be defined as the number of rele-
vant and retrieved images divided by the number of
relevant images,
measures the ability of a model to retrieve all rel-
evant images.
Figure 2: Recall graph: Recall = f(Retrieved images).
Figure 2 shows the recall graph. From this fig-
ure, we can point out that the overall performance of
the different models is as follows (in a decreasing or-
der): CL, AR + PCP-S, AR + PC-COV-V, PCP-S
+ PCP-COV-V, AR, PCP-S and PCP-COV-V. The
fused model CL (using all of the three basic repre-
sentations) gives the best results. The fusion two by
two also gives better results than the separated mod-
els. The perceptual model using the original image’s
viewpoint (PCP-S) performs better than the percep-
tual model using the autocovariance function view-
point (PCP-COV-V), but when these two viewpoints
are fused, the resulting model (PCP-S + PCP-COV-
V performs better than each of them taken separately.
The autoregressive model (AR) performs better than
the perceptual model (PCP-COV-V) based on the au-
tocovariance function viewpoint and have a quite sim-
ilar performance compared to the perceptual model
based on the original image’s viewpoints (PCP-S).
KDIR 2009 - International Conference on Knowledge Discovery and Information Retrieval
58

T05-01 T05-11 T05-21 T05-31
T06-01 T06-11 T06-21 T06-31
Figure 3: Sample of images from the Ponce’s group texture database.
When comparing retrieval performance in terms
of recall rate with other works, we can point out the
following remarks (see table 1):
- If we consider only 83 classes, our fused model
performs better than most of the known works in-
cluding pure CBIR approaches such as Gabor filters
(Manjunath and Ma, 1996), MRSAR (Manjunath and
Ma, 1996), (Liu and Picard, 1996) and Wold model
(Liu and Picard, 1996), and relevance feedback-based
approaches such as MARS (Rui et al., 1997) and
RBF-based retrieval (Muneesawang and Guan, 2004).
Note that for table 1, we give the retrieval rate at the
position that corresponds to the number of relevant
images for each class. Note that in our approach no
relevance feedback from users is used.
- If we consider all of the 112 classes, includ-
ing highly non-homogeneous images, our model per-
forms better than some and less than some other mod-
els. We must mention again that considering the 29
highly non-homogeneous classes may lead to incor-
rect conclusions since these classes contain images
that are not visually similar.
Table 1: Average recall rate for different models. We
showed the recall rates given by authors of the correspond-
ing model.
Model Recall rate
FusCL (112 classes) .687
FusCL (83 classes) .819
MRSAR .74
Gabor .74
WOLD .75
RBF .737
MARS .671
4.2 The Case of Invariance
4.2.1 Experimental Results
For experimental results and benchmarking, we have
used an image database coming from Ponce’s group at
UIUC
1
. A sample from this database is given in fig-
ure 3. We considered 22 classes; each class contains
640x480 40 images per class for a total of 880 im-
ages. Within each class there is a high degree of vari-
ance between images in orientation, scale, contrast as
well as non-rigid deformations. In experimental re-
sults, the AR, with an NSHP neighborhood, weighted
with the inverse of each feature’s variance gave the
best results among the different versions of the AR
models. Both the PCP and the PCP-COV models
in their weighted version using the Spearman coeffi-
cient of rank-correlation gave the best results among
the different versions of the perceptual model.
4.2.2 Evaluation
Benchmarking we have done, based on the recall
measure, concerns both the use of one query as well
as the use of multiple queries:
• When considering one query, we have con-
sidered the best version of each separated
model/viewpoint. Then we have fused these mul-
tiple models/viewpoints, using the CL results fu-
sion model, for the same query.
• When considering multiple queries, based on the
fused models/viewpoints for each query, we have
fused the results of 4 queries using the MAX
model and the RR model as described earlier in
this paper. Query images were selected randomly
and correspond to images 1, 11, 21 and 31 from
each class.
1
http://www-cvr.ai.uiuc.edu/ponce grp/data/texture da-
tabase
TEXTURE REPRESENTATION AND RETRIEVAL BASED ON MULTIPLE STRATEGIES
59
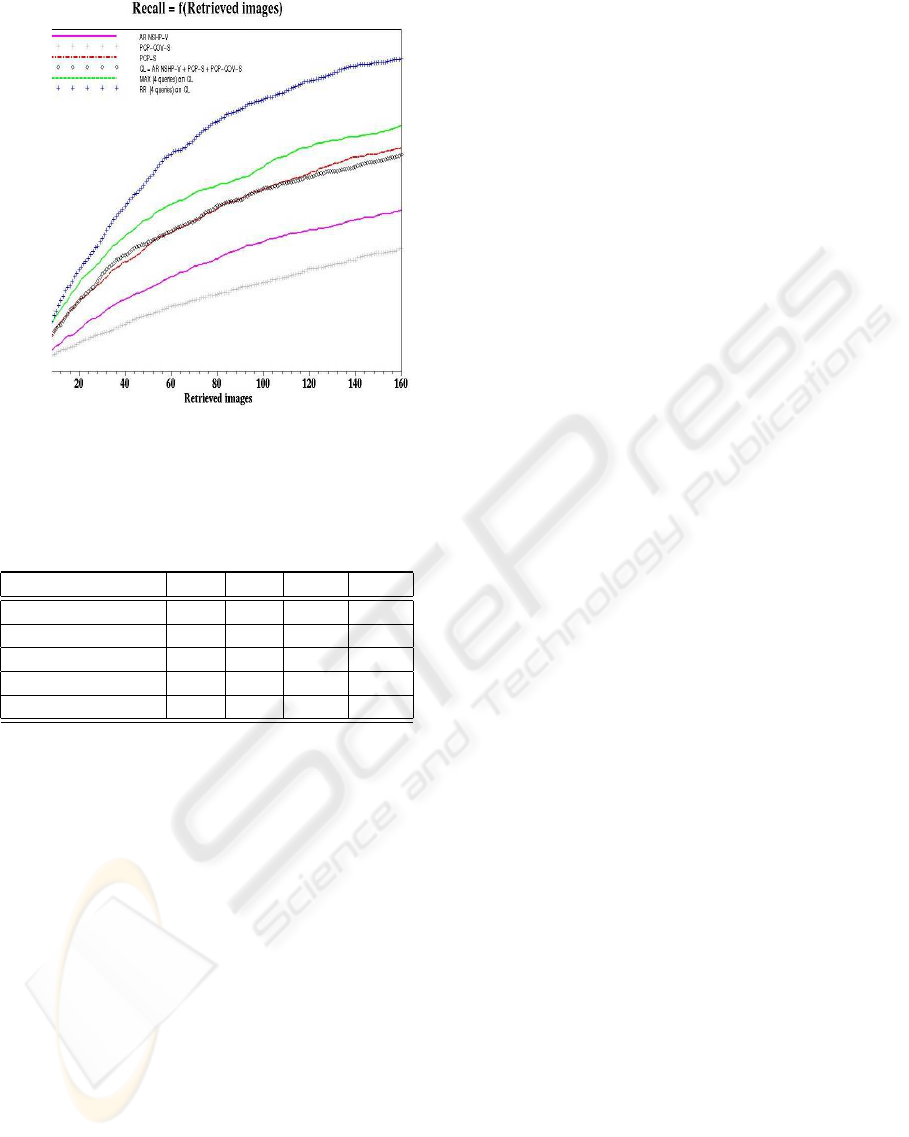
Figure 4: Average recall graph for different separated mod-
els (1 query) and fused model (4 queries).
Table 2: Average recall rate at positions 40, 80, 120, and
160 according to different separated and fused models.
Model P40 P80 P120 P160
AR NSHP-V .219 .34 .426 .485
PCP-S .331 .489 .593 .67
pcp-COV-S .145 .234 .31 .37
MAX (4 Queries) .408 .557 .674 .735
RR (4 Queries) .495 .747 .867 .932
Fig. 4 shows the average recall graph for different
models, both separated and fused, by considering one
query and multiple queries. This figure shows that
the PCP model weighted with Spearman coefficients
performs better than the other separated models. Fus-
ing different models/viewpoints for the same query
does not achieve an important improvement in perfor-
mance since two of the three models/viewpoints con-
sider, namely the AR NSHP-V and the PCP-COV
model, have rather poor performance in the case of
invariance as explained earlier in this paper.
Fusing multiple queries using both the MAX
and RR models allow improvement in performance.
While the MAX model allows an average improve-
ment in performance, the RR model allows a signifi-
cant improvement in performance measured in terms
of recall. Remember that both the MAX and the
RR models exploit the skimming effect while the CL
model exploits both the chorus and dark horse effects.
Thus, in the case of invariance, the skimming effect,
is more important than both the chorus and dark horse
effects.
These conclusions can be also drawn by examin-
ing table 2, which gives the average retrieval rate at
positions 40, 80, 120 and 160 across all the database
according to a selection of separated and fused mod-
els.
5 CONCLUSIONS
We presented in this paper a data fusion approach
to content-based image retrieval in which results re-
turned by multiple models/viewpoints and multiple
queries are fused. This approach was employed in
both the general image retrieval case and in the special
case of invariant image retrieval. We have considered
the case of textures. Texture content are represented
by two different content representation models: the
autoregressive model and a perceptual model based
on a set of perceptual features such as coarseness, di-
rectionality, etc. Two viewpoints of this perceptual
model were considered: the original images and the
autocovariance function.
In the case of invariance, since these mod-
els/viewpoints used were not invariant with respect to
geometric and photometric transformations, we used
also multiple queries. Thus we used multiple repre-
sentations and multiple queries in the case of invari-
ance.
Experimental results and benchmarking showed
the following results: 1. In the general case of im-
age retrieval, the fusion of multiple representations
allowed a very significant improvement in retrieval
relevance compared to single representations. Fusion
models able to exploit the chorus effect and the dark
horse effect are more appropriate in the general case
of image retrieval. 2. In the case of invariance, fus-
ing multiple representations achieved a low improve-
ment in search relevance while multiple queries fu-
sion achieved a significant improvement in search rel-
evance. Fusion models able to exploit the skimming
effect are more appropriate in the case of invariance.
Further research related to the work presented in
this paper concerns mainly the investigation of the
possibility to define more representations. In the case
of invariance, the choice of appropriate queries is an
open question. In this paper, we have chosen multi-
ple queries in a random way. we believe that, if this
choice can be done using some procedure taking into
account user’s needs, search relevance can be further
improved.
KDIR 2009 - International Conference on Knowledge Discovery and Information Retrieval
60

REFERENCES
Abbadeni N. Information Retrieval From Visual Databases
Using Multiple Representations and Multiple Queries.
ACM SAC’09, March 2009.
Datta R., Joshi D., Li J., and Wang J.Z. Image Retrieval:
Ideas, Influences, and Trends of the New Age. ACM
Transactions on Computing Surveys, 40(2), 60 pages,
2008.
Abbadeni, N. and Alhichri, H. Low-level invariant image
retrieval based on results fusion. Proceedings of the
IEEE ICME, Hannover-Germany, June 2008.
Muneesawang P, Guan L. An interactive approach for CBIR
using a network of radial basis functions. IEEE Trans-
actions on Multimedia, 6(5):703-716, October 2004.
Abbadeni N. Perceptual meaning of the estimated parame-
ters of the autoregressive Model. IEEE ICIP, Genova,
Italy, 2005.
Abbadeni N. Multiple representations, similarity matching,
and results fusion for CBIR. ACM/Springer Multime-
dia Systems Journal, 10:(5): 444-456, 2005.
Abbadeni N. A new similarity matching measure: applica-
tion to texture-based image retrieval. Proceedings of
the 3
rd
International Workshop on Texture Analysis
and Synthesis (held in conjunction with IEEE ICCV),
Nice, France, October 2003.
Abbadeni N, Ziou D, Wang S. Computational measures
corresponding to perceptual textural features. Pro-
ceedings of the 7
th
IEEE International Conference on
Image Processing, Vancouver, BC, September 10-13
2000.
Amadasun M, King R. Textural features correspond-
ing to textural properties. IEEE Transactions on
Systems, Man and Cybernetics, 19(5):1264-1274,
September/October 1989.
Belkin NJ, Cool C, Croft WB, Callan JP. The effect of mul-
tiple query representation on information retrieval per-
formance. Proceedings of the 16th International ACM
SIGIR Conference, pp. 339-346, 1993.
Berretti S, Del Bimbo A, Pala P. Merging results for
distributed content-based image retrieval, Multimedia
Tools and Applications, 24:215-232, 2004.
Brodatz P. Textures: A Photographic Album for Artists and
Designers. Dover, New York, 1966.
Frankot R. T. and Chellappa R. Lognormal random-field
models and their applications to radar image synthe-
sis. IEEE Transactions on Geoscience and Remote
Sensing, 25(2), March 1987.
French JC, Chapin AC, Martin WN. An application of mul-
tiple viewpoints to content-based image retrieval, Pro-
ceeding of the ACM/IEEE Joint Conference on Digi-
tal Libraries, pp. 128-130, May 2003.
Gower JC. A general coefficient of similarity and some
of its properties. Biometrics Journal, 27:857-874, De-
cember 1971.
Kashyap R. L. and Chellappa R. Estimation and choice
of neighbors in spatial interaction models of images.
IEEE Transactions on Information Theory, 29(1):60-
72, 1983.
Lazebnik S., Schmid C. and Ponce J. A Sparse Texture
Representation Using Local Affine Regions. Beck-
man CVR Technical Report, No. 2004-01, University
of Illinois at Urbana Champaign (UIUC) (also submit-
ted to IEEE PAMI), 2004.
Lee JH. Analysis of multiple evidence combination. Pro-
ceedings of the ACM SIGIR Conference, pp. 267-276,
Philadelphia, PA, USA, 1997.
Liu F, Picard RW. Periodicity, directionality and random-
ness: Wold features for image modeling and retrieval.
IEEE Transactions on Pattern Analysis and Machine
Intelligence, 18(7):722-733, July 1996.
Lu Y, Hu C, Zhu X, Zhang H, Yang Q. A unified framework
for semantics and feature based relevance feedback in
image retrieval systems. Proceedings of the 8
th
ACM
International Conference on Multimedia, pp. 31-37,
Marina Del Rey, CA, 2000.
Manjunath BS, Ma WY. Texture features for browsing and
retrieval of image data. IEEE Transactions on Pattern
Analysis and Machine Intelligence, special issue on
Digital Libraries, 18(8):837-842, August 1996.
Rui Y, Huang TS, Mehrota S. A Relevance feedback archi-
tecture for multimedia information retrieval systems.
IEEE Workshop on Content-based Access of Image
and Video Libraries, pp. 82-89, 1997.
Sun Y, Ozawa S. Semantic-meaningful content-based im-
age retrieval in wavelet domain. Proceedings of the
5
th
ACM International Workshop on Multimedia In-
formation Retrieval (held in conjunction with ACM
Multimedia), pp. 122-129, Berkeley, CA, November
2003.
Tamura H, Mori S, Yamawaki T. Textural features corre-
sponding to visual perception. IEEE Transactions on
Systems, Man and Cybernetics, 8(6):460-472, June
1978.
Vogt CC, Cottrell GW. Fusion via a linear combination
of scores. Information Retrieval Journal, 1:151-173,
1999.
Wu S. and Crestani F. Data Fusion with Estimated Weights.
Proceedings of the International ACM Conference on
Knowledge and Information Management (CKIM),
pp. 648-651, McLean, Virginie, USA, november 4-9,
2002.
Zhang J. and Tan T. Brief Review of Invariant Texture Anal-
ysis Methods. Pattern Recognition, 35:735-747, 2002.
Zhou XS, Huang TS. Relevance feedback for image re-
trieval: a comprehensive review. ACM Multimedia
Systems Journal, 8(6):536-544, 2003.
TEXTURE REPRESENTATION AND RETRIEVAL BASED ON MULTIPLE STRATEGIES
61
