
IMPROVED 2D MAXIMUM ENTROPY THRESHOLD
SEGMENTATION METHOD BASED ON PSO
Liping Zheng
School of Computer Science, Liaocheng University, Liaocheng, Shandong, China
Guangyao Li
CAD Research Center, Tongji University, Shanghai, China
Jing Liang
School of Electrical Engineering, Zhengzhou University, Zhengzhou, Henan, China
Quanke Pan
School of Computer Science, Liaocheng University, Liaocheng, Shandong, China
Keywords: Image segmentation, Entropy, PSO algorithm, Gray probability.
Abstract: Image segmentation plays an important role in the field of image processing. Threshold segmentation is a
simple and important method in image segmentation. Maximum Entropy is a common threshold
segmentation method. In order to adequately utilize gray information and spatial information of image, an
improved 2D entropy computation method is proposed. Otherwise, Particle Swarm Optimization(PSO)
algorithm is used to solve maximum of improved entropy. Maximum takes as the optimal image
segmentation threshold. In this paper, two CT images were segmented in experiment. Experimental results
show that this method can quickly and accurately obtain segmentation threshold. Otherwise, this method has
strong anti-noise capability and save computation time.
1 INTRODUCTION
Image segmentation is to separate pixel of the image
into some non-intersecting regions(Pal, 1993).
Image segmentation is the base of image processing.
Because of the complexity and diversity of image,
there isn’t a common segmentation algorithm. In
application, different algorithms are used according
to features of image and application purposes.
Threshold segmentation method is a widely used
and effective method for segmentation gray level
image. Segmentation results rely on the
segmentation threshold value. Therefore it is very
important to choose an optimal threshold value.
1.1 Threshold Segmentation Method
Threshold segmentation method is one of the most
essential methods in image segmentation. This
method utilizes features of pixels. That is said,
object pixels and background pixels of image can be
distinguished by their gray level values. In process
of segmentation, the histogram of the image is
usually used, other image information such as the
spatial information is not utilized(Glasbey, 1993).By
choosing an adequate threshold value and
segmentation image, object can be extracted from
their background. Selection criterion of
segmentation threshold value plays an important role
in threshold segmentation method.
In past years, many schemes have appeared in
literature. Many different selection criterions were
proposed, such as Otsu method(Otsu, 1979),
minimum error threshold value method(Kittler,
1986). In 1980, entropy-based selecting approach
was proposed(PUN, 1980). Kapur proposed the
one-dimension entropy threshold value
method(Kapur, 1985). When segment an image,
one-dimension threshold value method solely
depended on the gray-level distribution. While the
Signal-to-Noise of image is low and the background
of image is complex, segmentation results with
287
Zheng L., Li G., Liang J. and Pan Q. (2009).
IMPROVED 2D MAXIMUM ENTROPY THRESHOLD SEGMENTATION METHOD BASED ON PSO .
In Proceedings of the International Joint Conference on Computational Intelligence, pages 287-291
DOI: 10.5220/0002314302870291
Copyright
c
SciTePress
one-dimensional entropy segmentation method are
poor. Therefore, Abutaleb proposed two-dimension
entropy method in 1989(Abutaleb, 1989).
The two-dimension entropy is obtained from the
two-dimension histogram which is constructed with
using the gray value of image and the average gray
value of image. Two-dimension entropy method is a
region-dependent method. When computing optimal
threshold value, two-dimension entropy method
needs cost more time than one-dimension entropy
method.
In order to reduce the computation time and
improve accuracy of segmentation threshold value,
an improved 2D maximum entropy threshold
segmentation method is proposed. This method
narrows down the search space. And PSO algorithm
is used to solve the optimal segmentation threshold
value. PSO algorithm has advantages of quick
convergence. Therefore it can reduce computation
time. Improved 2D entropy is called spatial
difference attribute information value entropy
(SDAIVE). This improved threshold segmentation
method based on PSO is called PSO-SDAIVE
algorithm.
2 IMPROVEMENT OF 2D GRAY
HISTOGRAM
While segment image with 2D threshold value
method, associated entropy need to be computed and
obtain the optimal segmentation threshold
value(Sahoo, 1988). In order to reduce the solving
time and improve the searching efficiency, the 2D
gray histogram is improved in this paper.
2.1 2D Gray Histogram
In 2D gray histogram, the horizontal axis is the
gray-level value of pixel. It’s range is [0, L-1]; the
vertical axis is the average gray-level value of pixel.
It’s range is [0,L-1]. Let f(m,n) denotes the
gray-level value of pixel which located at point(m,n).
In image,
{ ( , ) | {1, 2,.... }, {1, 2,.... }}
f
mn m M n N∈∈.
Let g(m,n) is the average gray-level value of the
neighborhood of pixel(m,n). The whole number of
probability value of
((,),(,))
f
mn gmn is
L
L
×
.
In the plan of 2D gray histogram, object pixels
and background pixels locate the diagonal
neighborhood. Noise points and edge pixels are far
from diagonal.
2.2 2D D-value Attribute Gray
Histogram
In traditional 2D gray histogram, the search space is
big and the solving time of the optimal threshold
value is long. In order to narrow down the search
space, 2D gray histogram is improved. According to
pixel attributes, the searching region is reduced.
This improved 2D gray histogram is called 2D
D-value attribute gray histogram. The horizontal
axis of 2D D-value attribute gray histogram is gray
value. The vertical axis is the D-value between gray
value and average gray value. It denotes absolute
value of the difference between
(,)
f
mn
and
(,)
g
mn .
The histogram with a given attribute is called
attribute histogram. In this paper, the associated
attribute condition is set. Suppose
12
(,)
L
fmn L<<
and
(,) (,)fmn gmn
μ
−
< .The attribute condition
restricts the range of search space. That is the gray
value of pixel is between L
1
and L
2
. The average
gray value is also in given range. Only pixels which
satisfy attribute condition can be searched.
Figure1 shows the plan of 2D D-value attribute
gray histogram. According to attribute condition,
pixels in region G are searched. A pair of value (s,w)
represents segmentation threshold value. Impact of
noise points are reduced by using this improved gray
histogram.
Comparing with the traditional 2D gray
histogram, pixels in region G should satisfy the
following conditions:
1
(,)Lfmns
≤
≤ and
1
max{0, } ( , ) min{ , 1}Lw gmn swL
−
≤≤+−. Pixels
in region H should satisfy
2
1(,)
s
fmn L+≤ ≤ and
2
max{0, 1 } ( , ) min{ , 1}swgmn LwL
+
−≤ ≤ + −.
Figure 1: The plan of 2D D-value attribute gray histogram
3 THE IMPROVED 2D ENTROPY
The essence of image segmentation with entropy is
that utilize the gray probability of image. The gray
information of image includes the gray probability
IJCCI 2009 - International Joint Conference on Computational Intelligence
288

and associated gray value. Spatial information value
includes gray value, average gray value and other
information. In order to better utilize the gray and
spatial information of image, the improved
computation method of 2D entropy is proposed in
this paper.
3.1 Spatial Information Function
According to gray value i and average gray value j,
spatial information function is defined. When
computing image 2D entropy, pixel spatial
information value substitutes for gray probability.
Formula (1) shows computation of spatial
information function. In formula, IV denotes other
spatial gray value.
{
}
22
12 3
123 1 2 3
(, ) ( 1) ( 1)
1, 0 1, 0 1, 0 1
ij ij
Iij I c i c j cIV p
ccc c c c
== ++ ++
++=≤≤≤≤≤≤
(1)
In this paper, only consider gray value and
average gray. Suppose weights of gray and average
gray are same. Therefore, spatial information
function formula is reduced as formula (2).
22
( , ) 0.5( 1) 0.5( 1)
ij ij
Iij I i j p== + + +
(2)
Suppose m
ij
is the total number of occurrence
(i,j). The joint probability function p
ij
is defined as
formula(3).
11
00
, 0,1,..... 1
LL
ij
ij ij
ij
m
Mmp
M
ij L
−−
==
==
=−
∑∑
(3)
Refer the 2D D-value attribute gray histogram
and compute the information value entropy. This
entropy is called spatial difference attribute
information value entropy (SDAIVE).
3.2 Computation of SDAIVE
Suppose threshold value pair (s,w), that is said, the
gray value is s, and the gray D-value is w.
According to figure 2, the gray value range and the
gray D-value range are confirmed.
Formula (4) defines the SDAIVE of object pixels
and background pixels. H’(O) is the SDAIVE of
object pixels. H’(B) is the SDAIVE of background
pixels.
'( ) ln
'( ) ln
O
O
O
B
B
B
H
HO P
P
H
HB P
P
=+
=+
(4)
Formula (5) defines computation of P
O
. Formula
(6) defines P
B.
P
O
denotes the gray information
quantity while gray value range is [L
1
,s]. P
B
denotes
the gray information quantity while gray value range
is [s+1,L
2
]. Formula (7) defines H
O
and H
B
.
11
11
22
(1) ( 1)
2
sws
OO ij
iLjL w
sws
ij
iLjL w
PI I
ij
p
+
==−
+
==−
==
+++
=
∑∑
∑∑
(5)
22
22
11
22
11
(1) ( 1)
2
LwL
BB ij
is js w
LwL
ij
is js w
PI I
ij
p
+
=+ =+−
+
=+ =+−
==
+++
=
∑∑
∑∑
(6)
11
2
2
11
ln
ln
sws
Oijij
iLjL w
wL
L
B
ij ij
is js w
H
II
H
II
+
==−
+
=+ =+−
=−
=−
∑∑
∑∑
(7)
Formula (8) defines discriminant function of
SDAIVE. In this paper, the maximum of SDAIVE is
taken as the selection criterion of threshold value.
Formula (9) defines the maximum function.
Solve the maximum of SDAIVE with some
optimize algorithm and obtain the optimal
segmentation threshold. Then segment image with
the optimal threshold value (s,w)
*
.
11
11
11
22
22
22
11
11
11
11
1
(, ) '( ) '( )
(ln)
ln
(ln)
ln
ln(
sws
ij ij
sws
iLjL w
ij
sws
iLjL w
ij
iLjL w
LwL
ij ij
LwL
is js w
ij
LwL
is js w
ij
is js w
sws
ij ij
iLjL w js
sw H O H B
II
I
I
I
I
I
I
II
ψ
+
+
==−
+
==−
==−
+
+
=+ =+−
+
=+ =+−
=+ =+−
+
==− =+
=+
−
=
++
−
+
=×
∑∑
∑∑
∑∑
∑∑
∑∑
∑∑
∑∑
22
22
11
22
11
1
11
11
)
(ln)
(ln)
ln( )
LwL
is w
LwL
sws
ij ij
ij ij
iLjL w
is js w
sws L wL
ij
ij
iLjL w
is js w
OB
OB
OB
II
I
I
I
I
HH
PP
PP
+
=+ −
+
+
==−
=+ =+−
++
==−
=+ =+−
−
−
=×++
∑∑
∑∑
∑∑
∑∑
∑∑
(8)
12
*
,0
(, ) ( (, ))
LsL wu
s
wArgMax sw
ψ
<< < <
=
(9)
4 SEARCHING SEGMENTATION
THRESHOLD WITH PSO
In this paper, PSO algorithm is used to solve the
IMPROVED 2D MAXIMUM ENTROPY THRESHOLD SEGMENTATION METHOD BASED ON PSO
289

SDAIVE maximum. PSO algorithm was jointly
proposed by the American sociologist and
psychologist of James Kennedy and electrical
engineer Russell Eberhart in 1995. The basic idea of
PSO algorithm was inspired by researching results
of behavior about bird groups and makes use of a
biological communities model which was proposed
by biologist Frank Heppner.
4.1 Basic Concepts of PSO Algorithm
PSO algorithm is a Swarm Intelligence Algorithm. It
takes particle as individual and flight with a certain
speed in the search space. These particles haven’t
quality and volume. Every particle has the simple
rules of conduct. According to the flying experience
of individuals and groups, particles can dynamically
adjust the flying speed.
Since 1995, researchers proposed different
algorithm models in different fields. Kenney
constructed simple PSO model. Eberhart
constructed PSO model with inertia weight factor.
YuhuiShi and Clerc constructed PSO model with the
shrinkage factor. Through a large number of
experimentations, the significance and role of
different control parameters in models were detailed
analysis. Corresponding reference values were
identified(Carlisle, 2001).
In PSO algorithm model, choices of parameters
are the focus of researching. There are six important
control parameters in PSO algorithm. They are
population size、cognitive learning rate c
1
、social
learning rate c
2
、the maximum of particle flying
speed
max
V
, the inertia weight factor
ω
、constriction
factor K. The population size of particles refers the
number of particles in iterative process.
In these algorithm models, the basic and earliest
PSO model was defined by Eberhart and
Kennedy(Kennedy, 1995). It was called simple PSO
model. The specific model as formula (10):
11
22
( 1) () ( () ())
(() ())
(1) () (1)
id id id id
gd id
id id id
vt vt crPt xt
cr P t x t
xt xt vt
+= + −
+−
+= + +
(10)
4.2 Computation of Optimal Threshold
with simple PSO
In this paper, the simple PSO algorithm was used.
Because the sum of c
2
and c
1
should be 4, the
parameters c
2
=c
1
=2,r
1
=r
2
=0.5. In experiment,
the iterative formula of speed is simplified as
formula (11):
(1) () () ()2()
id id id gd id
vt vt Pt Pt xt
+
=++ −
(11)
Because gray value of pixel is integer, the
solving of SDAIVE maximum can take as integer
planning problem. Pixel particles move along the
gray value(V-direction) and the gray D-value(μ
-direction) at the same time. Speed and location of
particles need iterate in two directions at the same
time.
In this paper, t denotes the particle generation. i
denotes serial number of particle.
iv
v
denotes the
speed change in gray value direction.
i
v
μ
denotes
the speed change in gray D-value direction.
iv
x
denotes the location change in gray value
direction
.
i
x
μ
denotes the location change in gray
D-value direction.
()
iv
Pt
and
()
i
Pt
μ
are the
corresponding particle locations of the SDAIVE
maximum in t generation.
Iterative formulas of speed and location as
following:
(1)()() 2()
iv iv iv gv iv
vt vt Pt P xt
+
=++−
(12)
(1) () (1)
iv iv iv
xt xt vt
+
=++
(13)
(1)()() 2()
iiigi
vt vt Pt P xt
μμμμμ
+
=++−
(14)
(1) () (1)
iii
xt xt vt
μμμ
+
=++
(15)
By iteration, the location of SDAIVE maximum
is confirmed. That is said, the location of optimal
threshold is confirmed.
5 EXPERIMENT AND RESULTS
In order to validate the capability of algorithm which
is proposed in this paper, gray image needs be
segmented in experiment. CT image is a kind of gray
image. Therefore, two CT images were segmented in
experiment. Experiment results were analyzed.
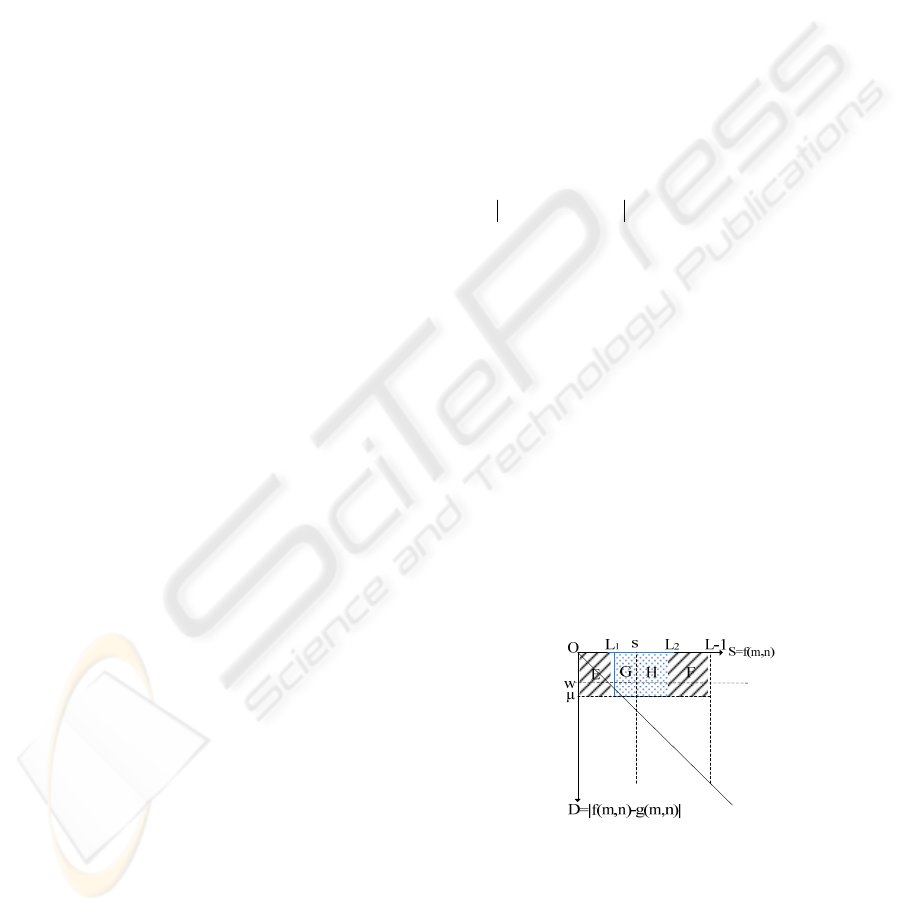
Input two head CT image IM10 and IM10’. The
type of image is uint16. The gray range is [0, 65535].
Image IM10 hasn’t noise. IM10’ has ‘salt & pepper’
noise. Figure2 shows two head CT images.
In this experiment, bones need to be separated
from CT images. Therefore, bones were taken as
object and other tissues were taken as background.
Figure3 shows the 2D D-value attribute gray
histogram of IM10 and IM10’. According to
improved gray histogram, computed their H’(O) and
H’(B) of two images. The SDAIVE maximum of
image was solved with PSO. At last, optimal
IJCCI 2009 - International Joint Conference on Computational Intelligence
290
segmentation threshold values were obtained.
Figure 2: Input IM10 and IM10’.
Figure 3: The 2D D-value attribute gray histogram.
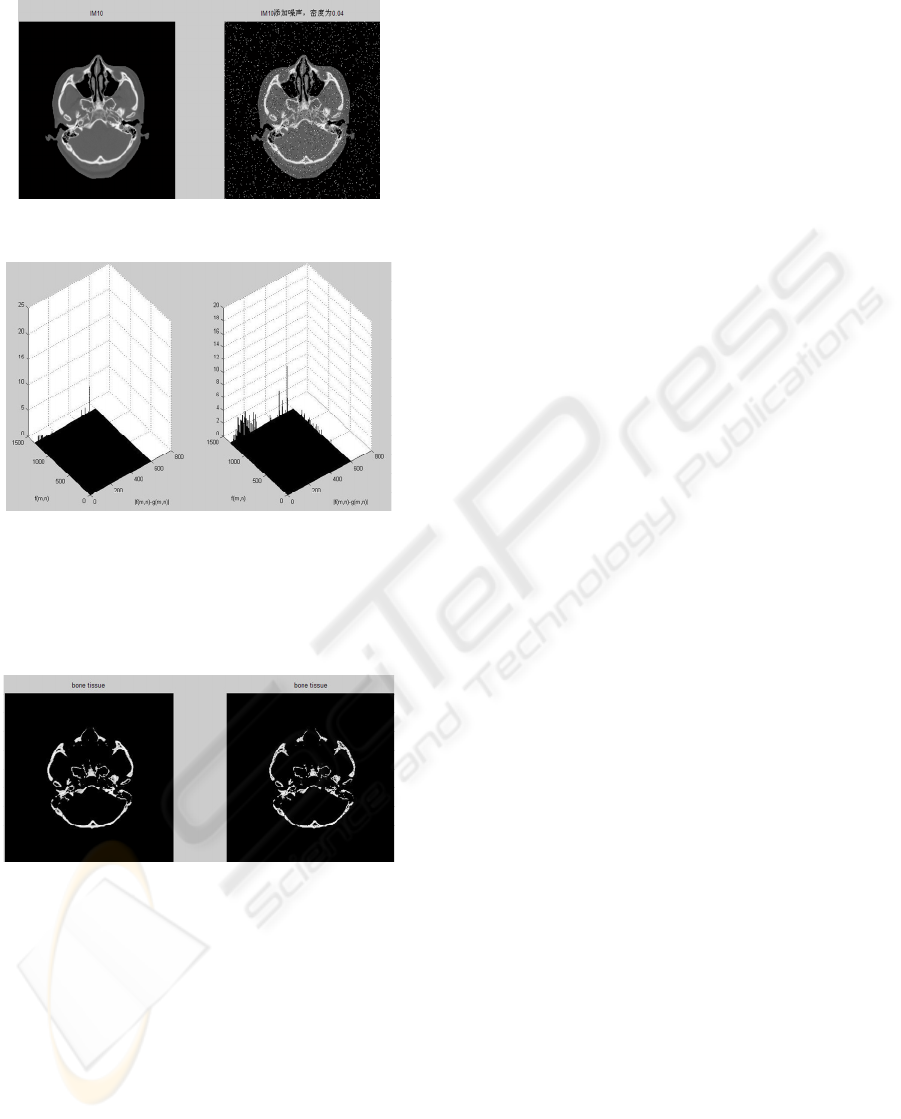
The optimal threshold value of IM10 is (2253,
500). The optimal threshold value of IM10’ is (2275,
525). Figure 4 shows the segmentation results of two
images.
Figure 4: The segmentation results of IM10 and IM10’.
Experiment results show that this improved
segmentation method has good anti-noise capability.
Otherwise, the search space is small. The time of
solving optimal threshold value is decreased. If
using genetic algorithm, the computation quantity is
also reduced, but the genetic algorithm is complex.
6 CONCLUSIONS
The one-dimension entropy method only considers
gray information. Otherwise, it has poor anti-noise
capability. Two-dimension entropy method considers
the spatial information, but the computing quantity
is large.
Improved 2D maximum entropy threshold
segmentation method based on PSO is called
PSO-SDAIVE algorithm. This algorithm not only
considers the spatial information, but also considers
the gray information and decreases the computing
quantity. Otherwise, the neighboring pixel control
parameter is set. The overly-smoothness of images
can be avoided.
In this paper, simple PSO model is used. In
future, we will research the solving method of
SDAIVE with different PSO models and search an
optimal PSO model with shortest time.
ACKNOWLEDGEMENTS
Subject is supported by National Natural Science
Foundation of China. The serial number is 60771065
and 60874075.
REFERENCE
Pal N R., Pal S K., 1993. A review on image segmentation
techniques. Pattern Recognition.
Glasbey, CA., 1993. An analysis of histogram-based
thresholding algorithms, CVGIP: Graphical Models
and Image Process.
Otsu N., 1979. A threshold value selection method from
grey-level histograms, IEEE Trans. System.
Kittler J. Illingworth M., 1986. Minimum error
thresholding. Pattern Recognition.
Pun T.,1980. A new method for grey-level picture
thresholding using the entropy of the histogram.
Signal Process.
Kapur J. N., Sahoo P.K., Wong A., 1985. A new method
for gray-level picture thresholding using the entropy of
the histogram. Computer Vision Graphics and Image
Processing.
Abutaleb A S.,1989. Automatic thresholding of gray-level
picture using two-dimensional entropies. Pattern
Recognition.
Sahoo P K, Soltani S., 1988. A svrvey of thresholding
techniques. Comput. Vision Graphics and Image
Process.
Kennedy J, Eberhart R. C., 1995. Particle Swarm
Optimization. In: Proc. IEEE Int’l. Conf. on Neural
Networks, IV. Piscataway, NJ: IEEE Service Center
Carlisle A, Dozier G., 2001. An Off-the-shelf PSO. In
Proceedings of the Workshop on Particle Swarm
Optimization. Indianapolis, IN: Purdue School of
Engineering and Technology, IUPUI(in press).
IMPROVED 2D MAXIMUM ENTROPY THRESHOLD SEGMENTATION METHOD BASED ON PSO
291
