
PREDICTION OF GROUND-LEVEL OZONE
CONCENTRATIONS THROUGH STATISTICAL MODELS
J. C. M. Pires, F. G. Martins, M. C. Pereira and M. C. M. Alvim-Ferraz
LEPAE, Departamento de Engenharia Química, Faculdade de Engenharia
Universidade do Porto, Rua Dr. Roberto Frias, 4200-465 Porto, Portugal
Keywords: Air pollution modelling, Ground-level ozone, Multiple linear regression, Artificial neural networks, Multi-
gene genetic programming.
Abstract: This study aims to evaluate the performance of three statistical models: (i) multiple linear regression
(MLR), (ii) artificial neural network (ANN) and (iii) multi-gene genetic programming (MGP) for predicting
the next day hourly average ozone (O
3
) concentrations. O
3
is an important air pollutant that has several
negative impacts. Thus, it is important to develop predictive models to prevent the occurrence of air
pollution episodes with a time interval enough to take the necessary precautions. The data were collected in
an urban site with traffic influences in Oporto Metropolitan Area, Northern Portugal. The air pollutants data
(hourly average concentrations of CO, NO, NO
2
, NO
x
and O
3
), the meteorological data (hourly averages of
temperature, relative humidity and wind speed) and the day of week were used as inputs for the models.
ANN models presented better results in the training step. However, with regards to the aim of this study,
MGP presented the best predictions of O
3
concentrations (test step). The good performances of the models
showed that MGP is a useful tool to public health protection as it can provide more trustful early warnings
to the population about O
3
concentrations episodes.
1 INTRODUCTION
Ground-level ozone (O
3
) is one of the air pollutants
of most concern in Europe. It is an irritating and
reactive component in atmosphere that has negative
impacts on human health, climate, vegetation and
materials (Pires et al., 2008a). O
3
is the result of
three basic processes: (i) photochemical production
by the interaction of hydrocarbons and nitrogen
oxides under the action of suitable ambient
meteorological conditions (Guerra et al., 2004;
Zolghadri et al., 2004); (ii) vertical transport of
stratospheric air, rich in ozone, into the troposphere
(Dueñas et al., 2002); and (iii) horizontal transport
due to the wind that brings O
3
produced in other
regions. Air pollution modelling and prediction take
a great importance in preventing the occurrence of
air pollution episodes with a time interval enough to
take the necessary precautions. With regards to the
prediction of O
3
concentrations, several studies have
been published (Al-Alawi et al., 2008; Ozdemir et
al., 2008; Sousa et al., 2007). Artificial Neural
Networks (ANN) are often used and presented good
performances due to the nonlinearity that is
associated to the O
3
formation. As far it is known,
no study was performed to evaluate the performance
of MGP for predicting O
3
concentrations. In this
study, the aim is to compare the performances of
three models for predicting the next day hourly
average O
3
concentrations during seven days. The
models developed were: (i) multiple linear
regression (MLR); (ii) feedforward ANN; (iii) multi-
gene genetic programming (MGP).
2 MODELS
MLR is an extension of the simple linear regression
model for data with multiple predictor variables and
one outcome. Thus, this statistical model assumes
that the best approach to estimate the dependent
variable from the explanatory variables is to find the
linear combination of these variables that minimizes
the sum of squared errors (Pires et al., 2008b).
ANN models are characterized by a set of
processing neurons with an activation function that
are distributed in layers (input, hidden and output
layers). The neurons in the different layers are linked
551
Pires J., Martins F., Pereira M. and Alvim-Ferraz M. (2009).
PREDICTION OF GROUND-LEVEL OZONE CONCENTRATIONS THROUGH STATISTICAL MODELS.
In Proceedings of the International Joint Conference on Computational Intelligence, pages 551-554
DOI: 10.5220/0002316505510554
Copyright
c
SciTePress

by synapses, each one storing a weight value. These
weight values are modified during the training step
of ANN model, minimizing the value of a selected
objective function. One of the problems of the
training step is the overfitting. A high number of
iterations lead to decrease the error in the training
set, but the achieved model presents a large error
when applied to a new set. The method often applied
to solve this problem is the early stopping (Nguyen
et al., 2005; Özesmi et al., 2006). Using this method,
the data should be divided into three sets (Chiang et
al., 2004): (i) training set, used to determine the
model parameters; (ii) the validation set, used to
evaluate the performance of ANN model during the
training step and to stop it when the validation error
starts to increase; and (iii) the test set, used to
evaluate the ANN performance when applied to a
new set.
MGP is based on the principles of the simple
genetic programming (GP) algorithm (Koza, 1992).
The models are also encoded in tree structures (tree
expressions). The initial models (first generation) are
created randomly and are modified following an
iterative process, using genetic operations (selection,
crossover and mutation). The tree structures are
continuously evaluated and the fittest ones are
selected to the next iteration (elitism). This
procedure leads to optimize the model structure and
parameters, simultaneously. The iterative process
stops when a termination criterion (the achievement
of the maximum number of generations or a desired
training error) is satisfied. Figure 1 summarises the
GP procedure. The main differences between GP
and MGP are: (i) a model is composed by several
tree structures, called genes, and not a single one
(see Figure 2); and (ii) the output value is calculated
Randomize the initial
population
Evaluation
Apply the genetic
operations
End
Termination
criterion satisfied?
Y
N
Figure 1: GP procedure.
5
0
1
ii
i
y
bbG
=
=+
∑
Figure 2: MGP model codification.
through the linear combination of the outputs of the
different genes belonging to the same model (in this
study, 5 genes were applied).
3 DATA
The models considered 10 input variables: the
hourly average concentrations (in μg m
-3
) of carbon
monoxide (CO), nitrogen oxides (NO, NO
2
and
NO
x
) and O
3
; hourly averages of air temperature (T),
solar radiation (SR), relative humidity (RH) and
wind speed (WS); the day of week (DW; the O
3
behaviour is different on weekdays and on
weekend). All environmental and meteorological
inputs corresponded to the same hour of the previous
day. The air pollution data were collected in an
urban site (Antas) with traffic influences situated in
Oporto, Northern Portugal. This site belongs to air
quality monitoring network of Oporto Metropolitan
Area that is managed by the Regional Commission
of Coordination and Development of Northern
Portugal, under the responsibility of the Ministry of
the Environment. The meteorological data were
recorded on the left edge of the Douro River, at an
altitude of 90 m approximately. These values are
representative of all Oporto Metropolitan Area. The
study period was two weeks of May 2004, where
high O
3
concentrations were measured and there was
no missing data. The last seven days were used for
the test period and the corresponded O
3
data of each
one (24 data points) were predicted using the data of
the seven days before (168 data points). For ANN
model, the validation set was 20% of the training
data. The input variables were Z standardized to
have zero mean and unit standard deviation.
4 RESULTS AND DISCUSSION
The determination of MLR models only considered
the regression parameters considered statistically
significant. The statistical significance was
evaluated through a t-test with a significance level of
0.05. The MLR models were determined using a
IJCCI 2009 - International Joint Conference on Computational Intelligence
552

0.0
4.0
8.0
12.0
16.0
20.0
D1 D2 D3 D4 D5 D6 D7
Day
RMSE
MLR
ANN
MGP
0.0
4.0
8.0
12.0
16.0
20.0
24.0
28.0
32.0
36.0
D1 D2 D3 D4 D5 D6 D7
Day
RMSE
MLR
ANN
MGP
(a) (b)
Figure 3: Performance indexes for training (a) and test (b) periods.
VBA subroutine in Microsoft Excel. In the seven
MLR models, the CO, NO, SR, WS and DW were
considered the input variables less important in the
prediction of O
3
concentrations. Positive correlation
coefficients were found between the predicted
variable and T, RH and O
3
concentrations of the
previous day, while NO
2
showed a negative
correlation. NO
x
presented positive or negative
correlation, when NO
2
or NO was considered
statistically significant, respectively.
Feedforward ANNs with three layers (10 input
neurons, n hidden neurons and 1 output neuron)
were also determined. Hyperbolic tangent and linear
functions were used as activation functions in hidden
and output neurons, respectively. The objective
function was the minimization of the mean squared
error of the training data. The training algorithm was
the Levenberg-Marquardt optimization. Different
ANN structures were tested, varying the number of
neurons in the hidden layer (1 to 10). For each
structure, 100 runs were performed. The best ANN
model corresponded to the minimum error in the
training and validation data. The ANN models were
determined using Matlab 7.0. In the seven ANN
models, the optimal number of hidden neurons was 5
(1 model), 7 (4 models) and 8 (2 models).
For MGP, several parameters should be defined. The
values proposed in this study are usually applied by
other authors in GP (Koza, 1992). The population
size is the number of individuals in the population;
large number of individuals increases the population
diversity, but it also increases the computation time
effort. The population size was fixed in 200 and the
maximum number of generations was 100. The
crossover and mutation rates define the probability
that an individual is selected for the crossover or
mutation operation, respectively; their values were
0.8 and 0.1. The best 10% of the best individuals (20
individuals) were selected for the next generation
(elitism). The fittest individuals were the ones
presenting the lowest root mean squared error
(RMSE; Pires et al., 2008b) in the training period.
To avoid early convergence, a new dataset for the
evaluation of individuals was created, by random
sampling the original data, with replacement when
the 20 best individuals of the actual generation were
the same of the previous one. However, in the last
10 generations the individuals were evaluated using
the original data.
The performances of all models were evaluated
using the RMSE. Figure 3 shows RMSE values for
all models in the training and test set. ANN
presented almost always the lowest training error.
However, when applied to a new set (test set), its
performance was worse than the others. Table 1
presents the models obtained to predict O
3
concentrations in the first day of the test set. Figure
4 shows the model predictions for the same period.
Considering whole test period, MGP presented
better predictions of O
3
concentrations.
Considering the flexibility for creating the
predictive models, MGP is a promising methodology
to estimate environmental complex air pollution
problems.
Table 1: Models achieved for the prediction of O
3
concentrations in the first day of the test period (D1).
Model
MLR
3| 24 2| |
3|
41.8 20.3 10.5
34.5 8.2 6.0
th t xt
ttt
ONONO
TRHO
+
=−× +×
+×+×+×
ANN Structure: (10; 5; 1)
MGP
3| 24
2|
24.1 7.6 tanh(cos(exp(cosh( ))))
3.5 log( ) 24.4 12.8
9.5 cosh( sin( ))
th t
tt t
tt
OT
TTNO
TCO
+
=+×
−× + ×− ×
+× −
PREDICTION OF GROUND-LEVEL OZONE CONCENTRATIONS THROUGH STATISTICAL MODELS
553
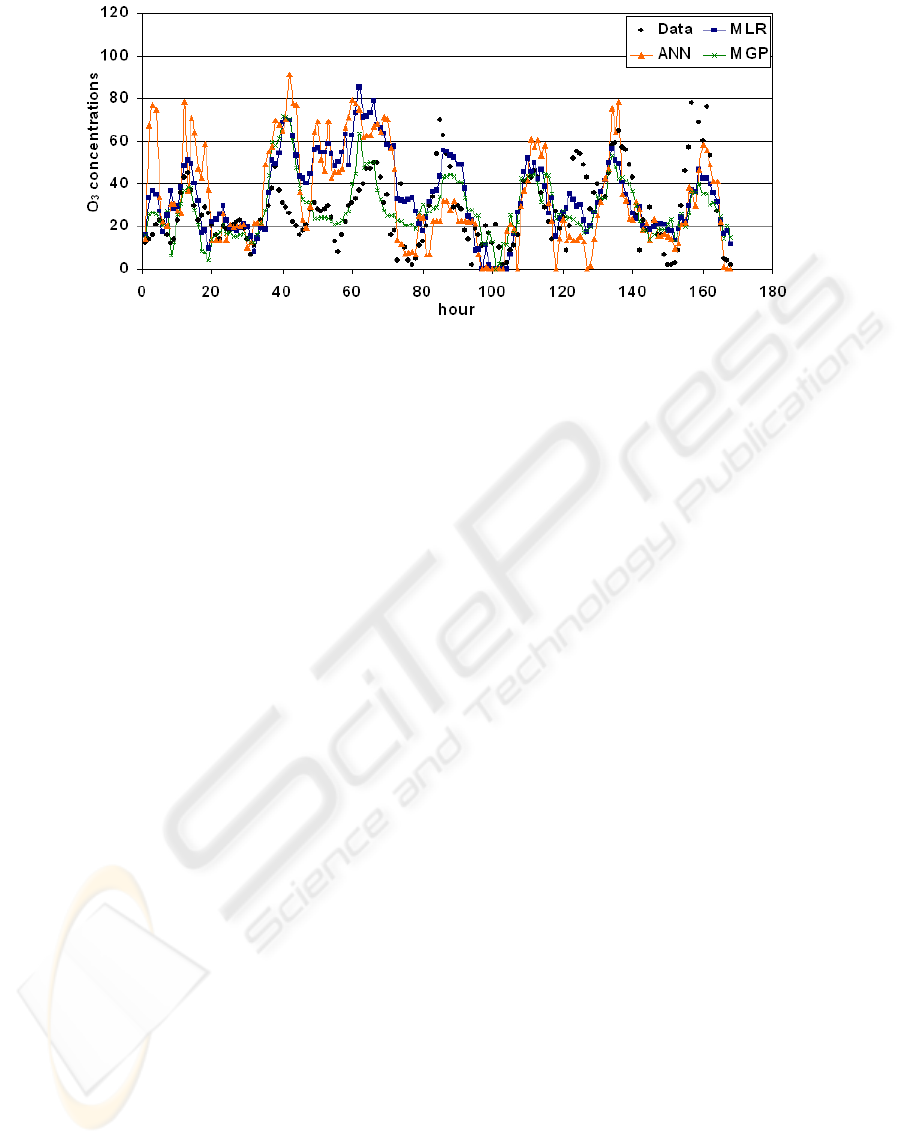
Figure 4: Prediction of O
3
concentrations for the test period.
5 CONCLUSIONS
Aiming the prediction of the next day hourly
average O
3
concentrations, the performances of
MLR, ANN and MGP were compared. The
prediction of seven consecutive days tested the
consistence of the models. ANN models presented
better results in the training step. However, with
regards to the aim of this study, MGP presented the
best predictions of O
3
concentrations (test set). The
good performances of the models showed that MGP
is a useful tool to public health protection as it can
provide early warnings to the population about O
3
concentrations episodes.
ACKNOWLEDGEMENTS
J.C.M. Pires also thanks the FCT for the fellowship
SFRH/BD/23302/2005.
REFERENCES
Al-Alawi, S.M., Abdul-Wahab, S. A., Bakheit, C. S.,
2008. Combining principal component regression and
artificial neural networks for more accurate
predictions of ground-level ozone. Environmental
Modelling & Software 23(4), 396-403.
Chiang, Y. M., Chang, L. C., Chang, F. J., 2004.
Comparison of static-feedforward and dynamic-
feedback neural networks for rainfall–runoff
modelling. Journal of Hydrology 290 (3-4), 297-311.
Dueñas, C., Fernández, M.C., Cañete, S., Carretero, J., and
Liger, E., 2002. Assessment of ozone variations and
meteorological effects in an urban area in the
Mediterranean Coast. Science of the Total
Environment 299 (1-3), 97-113.
Guerra, J.-C., Rodríguez, S., Arencibia, M.-T., García M.-
D., 2004. Study on the formation and transport of
ozone in relation to the air quality management and
vegetation protection in Tenerife (Canary Islands).
Chemosphere 56, 1157-1167.
Koza, J. R., 1992. Genetic Programming I – On the
Programming of Computers be Means of Natural
Selection, Cambridge, MA, MIT Press.
Nguyen, M. H., Abbass, H. A., McKay, R. I., 2005.
Stopping Criteria for Ensemble of Evolutionary Artifi-
cial Neural Networks. Applied Soft Computing 6 (1),
100-107.
Ozdemir, H., Demir, G., Altay, G., Albayrak, S., Bayat,
C., 2008. Prediction of Tropospheric Ozone Concen-
tration by Employing Artificial Neural Networks.
Environmental Engineering Science 25(9), 1249-1254.
Özesmi, S. L., Tan, C. O., Özesmi, U., 2006.
Methodological issues in building, training, and
testing artificial neural networks in ecological
applications. Ecological Modelling 195 (1-2), 83-93.
Pires, J.C.M., Martins, F.G., Sousa, S.I.V., Alvim-Ferraz,
M.C.M., Pereira, M.C., 2008b. Selection and
Validation of Parameters in Multiple Linear and
Principal Component Regressions. Environmental
Modelling & Software 23 (1), 50-55.
Pires, J.C.M., Sousa, S.I.V., Pereira, M.C., Alvim-Ferraz,
M.C.M., Martins, F.G. 2008a. Management of air
quality monitoring using principal component and
cluster analysis – Part II: CO, NO
2
and O
3
.
Atmospheric Environment 42(6), 1261-1274.
Sousa, S.I.V., Martins, F.G., Alvim-Ferraz, M.C.M.,
Pereira, M.C., 2007. Multiple linear regression and
artificial neural networks based on principal
components to predict ozone concentrations.
Environmental Modelling & Software 22(1), 97-103.
Zolghadri, A., Monsion, M., Henry, D., Marchionini, C.,
Petrique, O., 2004. Development of an operational
model-based warning system for tropospheric ozone
concentrations in Bordeaux, France. Environmental
Modelling & Software 19(4), 369-382.
IJCCI 2009 - International Joint Conference on Computational Intelligence
554
