
A NEURAL NETWORK MODEL OF THE OLFACTORY SYSTEM
FOR GLOMERULAR ACTIVITY PREDICTION
Zu Soh, Ryuji Inazawa, Toshio Tsuji
Graduate School of Engineering, Hiroshima University, Hiroshima, Japan
Noboru Takiguchi
Graduate School of Natural Science and Technology, Kanazawa University, Ishikawa, Japan
Hisao Ohtake
Graduate School of Engineering, Osaka University, Osaka, Japan
Keywords:
Glomerular activity prediction, Odor qualities, Olfactory system, Neural network model.
Abstract:
Recently, the importance of odors has begun to be emphasized as well as methods for their evaluation, espe-
cially in the fragrance and food industries. Although odors can be characterized by their odorant components,
their chemical information cannot be directly related to the flavors we perceive. Recent research has revealed
that neuronal activity related to glomeruli (which form part of the olfactory system) is closely connected to
odor qualities. In this paper, we propose a neural network model of the olfactory system in mice to predict
glomerular activity from odorant molecules. To adjust the parameters included in the model, a learning al-
gorithm is also proposed. The results of simulation proved that the relationship between glomerular activity
and odorant molecules could be approximated using the proposed model. In addition, the model could predict
glomerular activity to a certain extent. These results suggest that the proposed model could be utilized to
predict odor qualities for future application.
1 INTRODUCTION
As considerable evidence has been presented to show
that odours have an effect on memory and emotions,
the importance of smells has begun to be recognized
beyond their role as components of flavor (Herz and
Engen, 1996). Gas chromatography is a useful tech-
nique used to detect the odorant molecules (or simply
odorants) contained in an odour (van Ruth, 2001), and
the analyzed data are used to characterize the odour
(Aznar et al., 2001; Semmelroch and Grosch, 1995).
However, it is impossible to relate information about
odorant molecules to odour qualities without the pro-
cess of evaluation by human senses. One solution to
this problem is to build a regression model to con-
vert the data obtained from gas chromatographyto the
indices of sensory evaluation (Limpawattana et al.,
2001). In this case, the regression model is special-
ized to the objective odorants, making it necessary to
build different models for different kinds of odour.
Another solution is to build a model of the ol-
factory system based on biological insight. The re-
lationship between odorants and odour qualities is
mostly investigated from the field of biological re-
search. The most widely supported stereochemical
theory (Amoore, 1963) suggests that odour qualities
largely depend on the shape of the odorant molecules
involved. This theory is consistent with recent find-
ings regarding the olfactory receptor gene family
(Buck and Axel, 1991). The most important informa-
tion directly related to odour qualities is considered
to be that regarding activity on the glomeruli, which
are distributed over the surface of the olfactory bulb
(Mori and Yoshihara, 1995). Moreover, glomerular
activity evoked by input from olfactory receptors is
odour-specific, and odour qualities can be predicted
from the activated region of the glomeruli (Youngen-
tob et al., 2006).
Outside the field of biological research, there are
few approaches that reveal the relationship between
379
Soh Z., Inazawa R., Tsuji T., Takiguchi N. and Ohtake H. (2009).
A NEURAL NETWORK MODEL OF THE OLFACTORY SYSTEM FOR GLOMERULAR ACTIVITY PREDICTION.
In Proceedings of the International Joint Conference on Computational Intelligence, pages 379-385
DOI: 10.5220/0002320203790385
Copyright
c
SciTePress
OO
Octanal
Glomerular activity
(Leon et al.)
Odorant
molecule
-2 5
Activity strength
(z-score)
Receptor
cells
Piriform
cortex
Olfactory
bulb
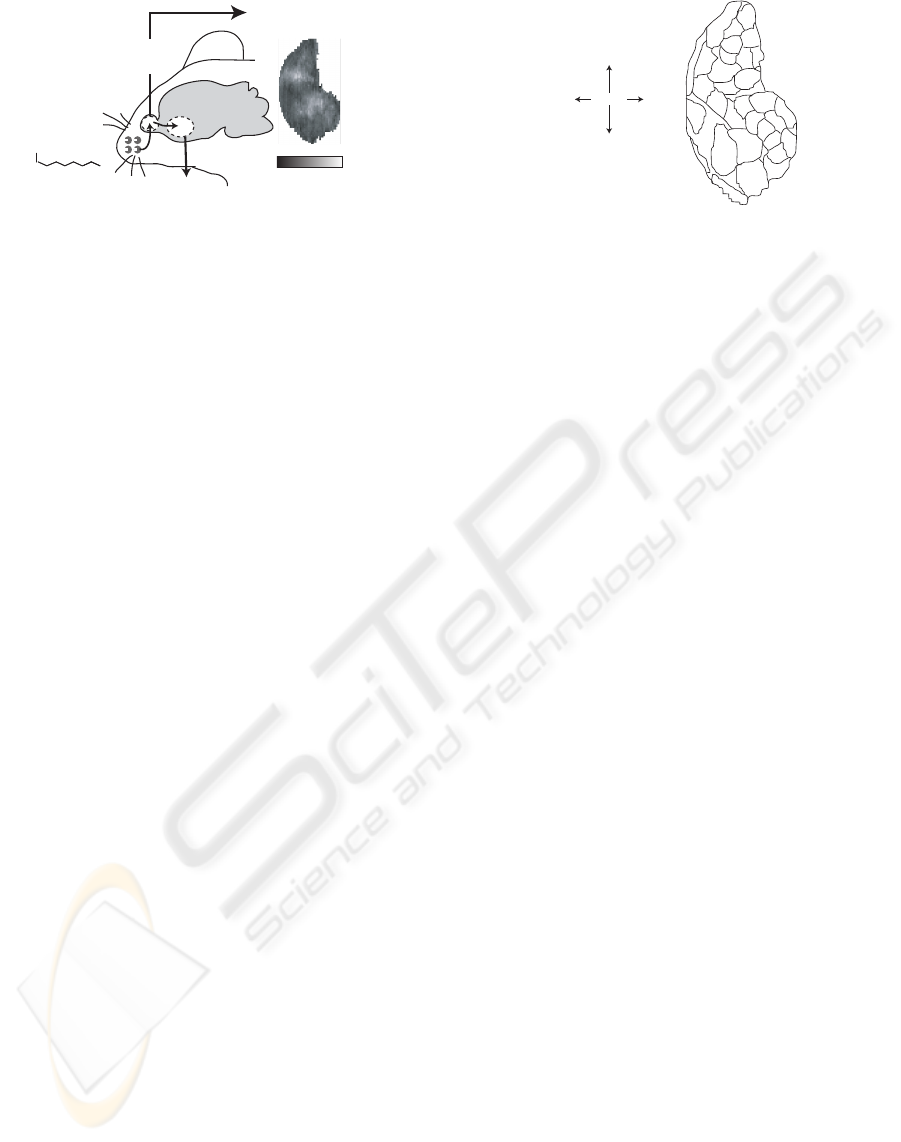
Figure 1: Structure of the olfactory system of rats.
Glomerular activity downloaded from the Glomerular Re-
sponse Archive (Leon and Johnson, 2009).
odour qualities and odorants from the field of engi-
neering. Most related engineering researches have
focused on developing biomimetic algorithms to dis-
criminate similar odours (Gutierrez-Osuna,2002), but
not to predict qualities for unknown odorants. This
may be because a considerable data set is needed to
approximate odorants to odour qualities, especially
for the human senses. In regard to the olfactory sys-
tem of rats, however, more than 300 types of glomeru-
lar activity evoked by different odorants are provided
online (Leon and Johnson, 2009).
Against this background, we report on a neural
network model of the olfactory system of rats to en-
able prediction of glomerular activity from odorant
molecules, since the basic structure of the olfactory
system in rats has a lot in common with that of hu-
man. We also propose a learning algorithm to adjust
the parameters included in the model. This consists
of a training algorithm for radial basis function (Chen
et al., 1991) and the Nelder-Mead (simplex) method
(Nelder and Mead, 1965).
This paper is organized as follows: In Section 2,
biological knowledge regarding the olfactory system
of rats is briefly explained. Section 3 proposes an ol-
factory model and a parameter-setting algorithm for
parameter adjustment. Section 4 details simulations
of parameter settings and prediction of glomerular ac-
tivity in rats. Finally, Section 5 concludes the paper
and outlines work planned for the future.
2 THE OLFACTORY SYSTEM OF
RATS
Figure 1 shows the basic structure of the olfactory
system in rats, which consists of three parts: recep-
tor neurons, the olfactory bulb and the piriform cor-
tex. Receptor neuronsare distributed on the surface of
the nasal chamber, expressing single receptor protein
from among thousands of different varieties (Buck
and Axel, 1991); these neurons are activated and send
a
b
c
f
m
h
e
d
g
j
k
n
o
P
L
D
E
F
M
A
B
C
c
H
G
I
J
K
i
l
p
Caudal
Rostral
Ve ntral
Dorsal
Dorsal
Orientation of
unrolled map of glomeruli
Figure 2: Glomerular module arrangement adapted from the
Glomerular Response Archive (Leon and Johnson, 2009).
signals to the olfactory bulb. The axons from the re-
ceptors that express the same receptor terminate at the
same point on the surface of the olfactory bulb (Mori
and Yoshihara, 1995). The terminals of these axons
form a small, round cluster called a glomerulus. A 2D
map of glomerular distribution can be associated with
receptor genes as well as with odorants, and is called
an odour map (Mori and Yoshihara, 1995). The ac-
tivity of the glomeruli is thus odour-specific. This ac-
tivity is then communicated to the deeper layer of the
olfactory bulb, which mainly consists of mitral and
granule cells. The piriform cortex performs odour
recognition based on the output of the mitral cells,
whose information is modified according to glomeru-
lar activity. It has been reported that this activity rep-
resents important information that is closely related
to the sense of smell in animals (Youngentob et al.,
2006).
Glomerular activity for more than 300 kinds of
odorant has been measured by Leon et al (Leon and
Johnson, 2009), and is shown very clearly using color
contour charts. From the results of this measurement,
Johnson et al. (Johnson et al., 2005) defined assem-
blies of glomeruli as a glomerular modules, which
respond to a specific molecular features such as the
functional group. Figure 2 shows an unrolled map
of glomeruli; the boundaries and unique letters de-
note the areas and symbols of the glomerular mod-
ules. More minor features, such as the length of the
carbon chain, are coded within a module (Johnson and
Leon, 2007). Accordingly, if these rules can be sys-
tematically approximated, glomerular activity evoked
by untested odorants could be predicted.
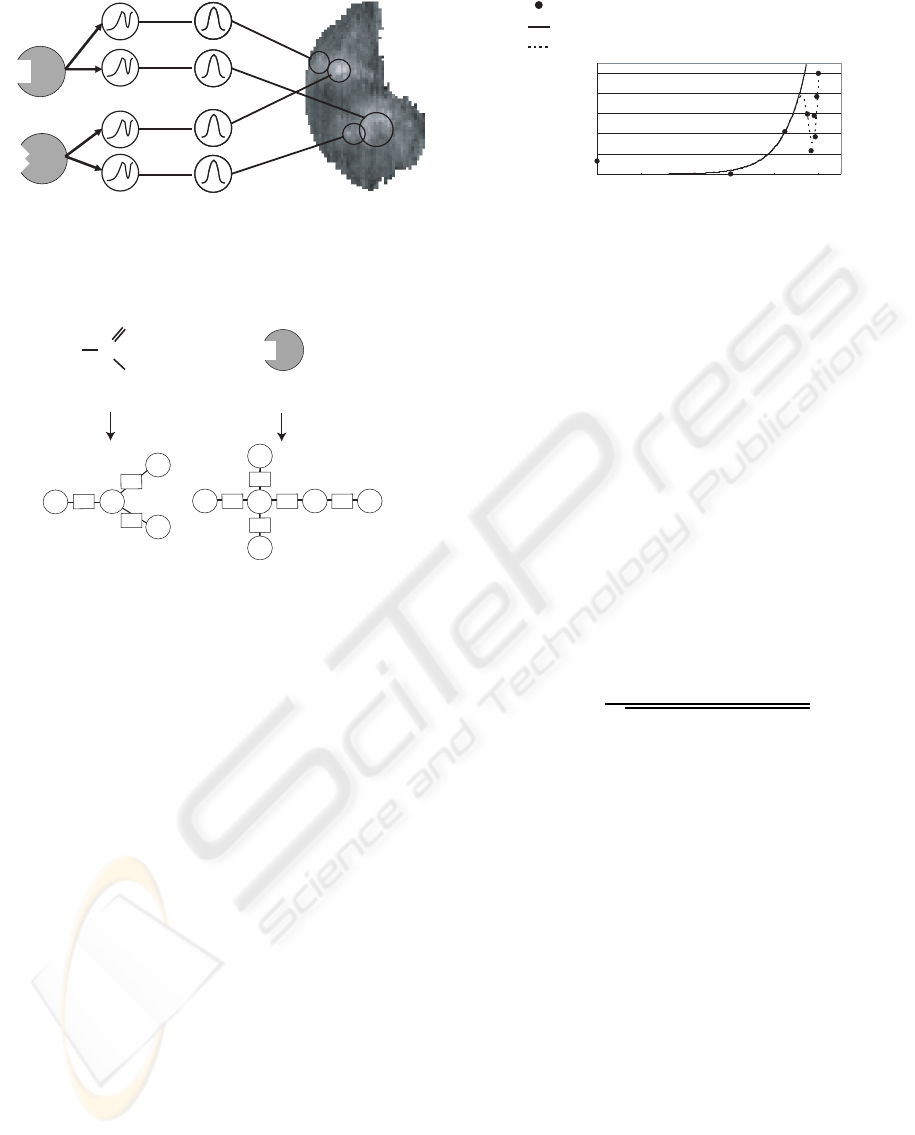
3 MODEL
We assumed that glomerular activity can be expressed
by a summation of Gaussian functions whose param-
eters are modulated by the activity of the receptors.
Under this assumption, the radial basis function-like
model shown in Figure 3 is proposed. The model con-
IJCCI 2009 - International Joint Conference on Computational Intelligence
380
Exponetial-Gaussian
layer
Gaussian
layer
Receptor
layer
U
U
C
C
C
C
( x , y )
K(Gl,G1)
䊶䊶
䊶䊶䊶
䊶䊶䊶
1,1 1,1
c
c
( x , y )
M,N
M,2
M,1
M,1
1,1
1,1
1,2
U
1
1
2
U
1,1
3
U
1,N
2
U
1,N
3
U
M,N
2
2
U
M,1
3
U
M
1
M,N
c
c
K(Gl,GM)
Glomeruli
layer
Figure 3: The proposed model for the olfactory system of
rats.
O
C
H
H
Odorant molecule
Receptor
(=A representative odorant)
G
l Gm
N2
E1
E1
E1
E1
E1
N3
N1
N3
N3
N3
N2
E1
N3
N1
N3
E2
E1
Figure 4: Labeled graphic expression of odorants for the
graph kernel function.
sists of four layers: receptor, exponential-Gaussian,
Gaussian, and glomeruli. This section describes the
processes in each layer and the learning algorithm
used.
3.1 Model Structure
The receptor layer consists of M units corresponding
to the number of arbitrarily defined odorants (repre-
sentative odorants), and each receptor unit is most
strongly activated by a representative odorant. Since
actual receptors are also activated by odorants with a
structure similar to that of the representative odorant,
the output of the receptor unit is defined as the simi-
larity between the representative and input odorants.
In this model, the graph kernel function K(G
l
, G
m
)
proposed by Kashima et al (Kashima et al., 2004) is
introduced to calculate structural similarity between
the molecules. In this function, the input odorant and
representative odorant are expressed by the graphs G
l
and G
m
in Figure 4, where the atoms correspond to
nodes and the bonds to edges. In addition, unique la-
bels are allocated to the types of atoms and bonds.
For example, hydrogen atoms (H) are labeled as N3
in Figure 4. The kernel function is then defined as:
0
0
0.5
0.5 1
1
Receptor unit Output ( U
m(Gl))
1
Measured glomerular
activity
(Normalized)
Fitting by exponential function
Fitting by exponential-Gaussian function
Measured activity
Figure 5: Example of exponential-Gaussian function fitting.
K(G
l
, G
m
)
=
∑
h
l
∑
h
m
p(h
l
|G
l
)p(h
m
|G
m
)K
L
b(h
l
), b(h
m
)
,
(1)
where h
l
and h
m
are arbitrary paths in the graphs of G
l
and G
m
respectively, and p(h
l
|G
l
) and p(h
m
|G
m
) are
the probabilities of the paths to be selected by the ran-
dom walk algorithm. K
L
(b(h
l
), b(h
m
)) is a function to
compare the path selection as shown below:
K
L
(b(h
l
), b(h
m
)) =
1, b(h
l
) = b(h
m
)
0, b(h
l
) 6= b(h
m
)
(2)
where b(h
l
) and b(h
m
) are the labels of path h
l
and
h
m
, respectively. The output of the receptor layer
1
U
m
(G
l
) is defined as the generalized value calculated
by Equation (3):
1
U
m
(G
l
) =
K(G
m
, G
l
)
p
(K(G
m
, G
m
)K(G
l
, G
l
))
, (3)
where
1
U
m
(G
l
) becomes 1 when the representative
odorant is input (G
l
= G
m
).
The output of each Receptor unit is input into
N exponential-Gaussian units so that the unit num-
ber in the exponential-Gaussian layer becomes MN.
Exponential-Gaussian units play a role in control-
ling activity strength at the connected region on the
Glomeruli layer. Figure 5 shows an example of the
relationship between the output of a Receptor unit
and the measured activity strength at the region of
the glomeruli to which the Receptor unit is con-
nected through the subsequent exponential-Gaussian
and Gaussian units. As shown in Figure 5, the activity
strength grows exponentially at first, then drops when
the value of U
r
approaches to 1. This trend may be
caused by the structure of the glomeruli. Glomeruli
that are topologically close to each other respond to
similar odorants (Johnson and Leon, 2007), but also
send inhibitory signals to each other (Aungst et al.,
2003). As a result, when an odorant similar to the rep-
resentative one is input, inhibitory signals from sur-
roundingglomeruli suppress the excitatory input from
A NEURAL NETWORK MODEL OF THE OLFACTORY SYSTEM FOR GLOMERULAR ACTIVITY PREDICTION
381

the receptors. Hence, the exponential-Gaussian unit
is defined by the following equation to convert the re-
ceptor unit output into the activity of the glomeruli:
2
U
m,n
= a
1
exp
a
2
1
U
m
(G
l
)
− a
3
exp{−(10
a
4
)
1
U
m
(G
l
) − a
5
2
},
(4)
where the first term on the right is an exponential
function, the second term is the Gaussian function,
and a
1
...a
5
are the parameters defined by the learning
algorithm described in Section 3.2.
The output of the exponential-Gaussian layer is
input to the Gaussian layer through the connective
weight C
m,n
as follows:
3
u
m,n
= C
m,n
2
U
m,n
, (5)
The Gaussian layer diffuses the activity to the
neighboring region on the Glomeruli layer. The out-
put of the Gaussian function is given by the following
equation:
4
U
m,n
(x, y)
=
3
U
m,n
exp
(
(
c
x
m,n
−x
)
2
α
2
m,n
+
(
c
y
m,n
−y
)
2
β
2
m,n
)
,
(6)
where the parameters α
m,n
and β
m,n
control the width
of the Gaussian curve.
The connections from the Gaussian layer to the
glomeruli layer allocate the output of the Gaussian
units to proper center coordinates (
c
x
m,n
,
c
y
m,n
) on the
glomeruli layer. The inputs to each of the coordinates
are added by
V(x, y) =
M
∑
m=1
N
∑
n=1
4
U
m,n
(x, y), (7)
from which the estimated glomerular activity is ob-
tained.
3.2 Learning Algorithm
To find proper parameters for the model, this section
proposes a learning algorithm consisting of two steps.
The adjustable parametersare the representativeodor-
ants G
m
of the Receptor units, the parameters in the
exponential-Gaussian units a
i
(i = 1, 2, ..., 5), the con-
nective weights C
l,m
from the exponential-Gaussian
layer to the Gaussian layer, and the center coordi-
nates (
c
x
m,n
,
c
y
m,n
) to which the Gaussian units are
connected. The first step determines the parameters
Gm, C
l,m
and (
c
x
m,n
,
c
y
m,n
), and the second step ad-
justs a
i
(i = 1, 2, ..., 5). Note that, for simplification,
the width of the Gaussian curves α
m,n
and β
m,n
is
fixed in this paper. To implement the algorithm, M
representative odorants (G
T,1
...G
T,M
) and the corre-
sponding glomeruli activities (V
T,1
(x, y)... V
T,M
(x, y))
measured by Leon and Johnson (2009) are chosen in
advance as a learning data set. Since the original ac-
tivity patterns consist of graphical data in png format,
they were converted to numerical data according to
the color scale shown on the website (Leon and John-
son, 2009). The converted data were then normalized
to a value range of [0,1].
First Step. First, the receptor units responding to
each representative odorant are defined, thus G
m
=
G
T,m
.
Then, each instance of glomerular activity evoked
by a representative odorant is approximated by the
Gaussian functions using the learning algorithm for
the radial basis function (RBF) (Chen et al., 1991).
This approximation gives the center coordinates
(
c
x
m,n
,
c
y
m,n
) and the peak value of the Gaussian unit.
The peak obtained value is assigned toC
m,n
. Note that
the number of Gaussian function N is also an impor-
tant parameter, and is analyzed in the next simulation
section.
Second Step. The parameters included in each
exponential-Gaussian unit are determined using the
Nelder-Mead (simplex) method (Nelder and Mead,
1965); this algorithm minimizes the objective func-
tion defined below:
E
m,n
=
M
∑
l=1
V
T,m
(x
m,n
, y
m,n
) −
1
U
m
(G
l
)
2
. (8)
4 SIMULATION
This section reports on verification of the learning al-
gorithm and the prediction ability of the model by
comparingthe output of the glomeruli layer with mea-
sured glomerular activity.
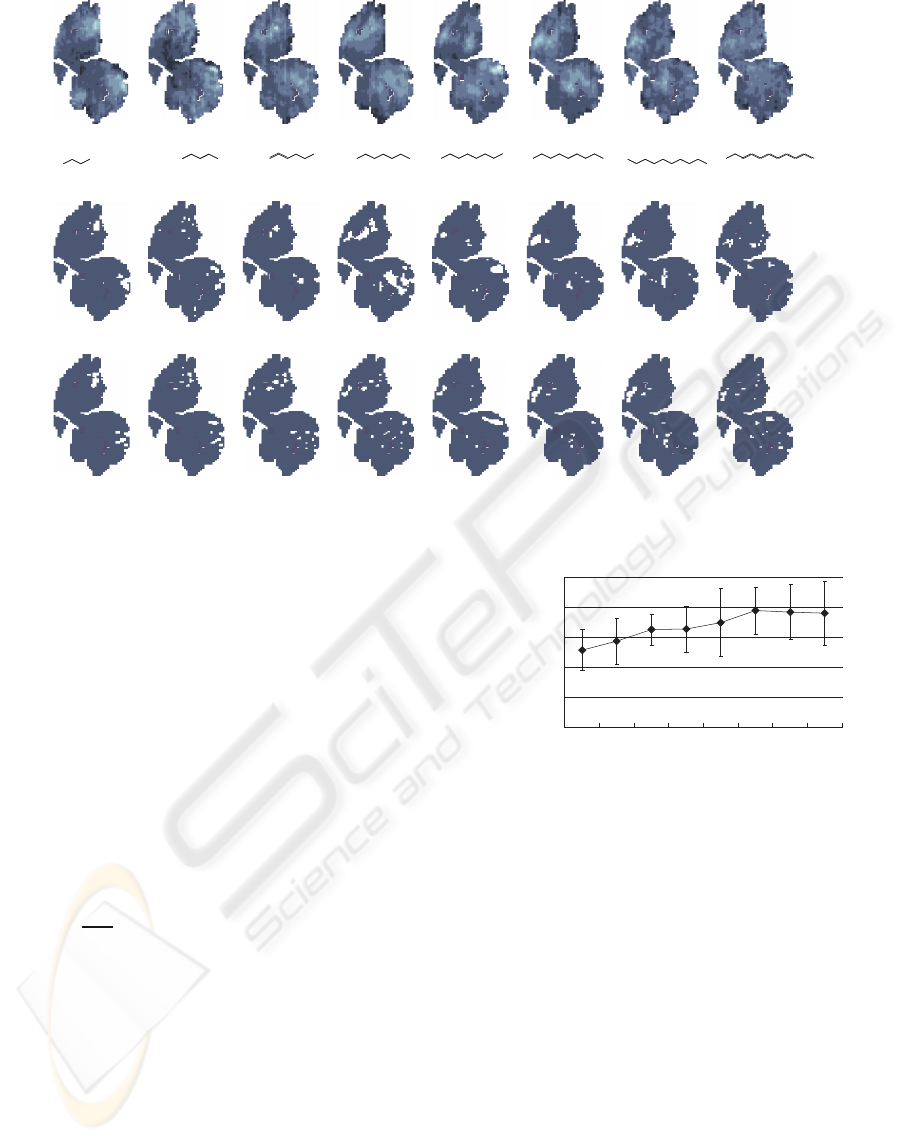
4.1 Learning
First, learning data as shown in Figure 6(a) were pre-
pared to implement the learning algorithm. This data
set consists of M = 8 kinds of representative odorants
(G
m
, m ∈ 1, 2, ..., 8) that share the functional group
of alcohol with different carbon numbers and the cor-
responding measured glomerular activity (V
T,o
(x, y),
o = m). This set was chosen because large shifts of
the activation area in the glomeruli can be observed
with increases in the carbon number. From Figure
6(a), it can be confirmed that the activation area shifts
from the caudal to the rostral side (left to right) as the
carbon number increases.
IJCCI 2009 - International Joint Conference on Computational Intelligence
382
1-propanol
OH
1-butanol
OH
1-pentanol
OH
1-hexanol
OH
1-heptanol
OHOH
1-octanol
OHOH
1-nonanol
OHOH
1-decanol
OHOH
(a) Learning data set adapted from Glomerular Response Archive (Leon and Johnson, 2009)
(b) Binarized measured activity
(C) Result of approximation by the model (N=50)
Figure 6: Learning results.
To find the best Gaussian function number N,
learning simulation was performed with N = 1, 10,
20, ..., 70. The other parameters were determined us-
ing the learning algorithm described in the previous
section. To facilitate visual comparison of the outputs
of the glomeruli layer V
o
(x, y) with the measured ac-
tivities V
T,o
(x, y), both values are binarized; the top
5% of the values are converted to 1, and the others to
0. In addition, for quantitative comparison, the corre-
lation of the glomeruli module activation rate is cal-
culated between the binarized output of the glomeruli
layer and the binarized measured activity. The activa-
tion rateV
′
o,µ
in the module µ is defined by the follow-
ing equation:
V
′
o,µ
=
S
A
o,µ
S
o,µ
(µ ∈ a, ..., p, A, ..., M, P) (9)
where S
A
o,µ
denotes the activated area, and S
o,µ
is the
whole area of the module µ.
After implementation of the learning algorithm,
each representative odorant in the learning data set
was input to the model, and the correlation outlined
above was calculated. This procedure was repeated
with different values of Gaussian function number N.
Figure 7 shows the relationship between N and the av-
erage correlation over the learning data set. It can be
seen that this correlation rises along with increases in
N until N = 50, then gradually drops. From this re-
sult, N = 50 is determined as the best Gaussian func-
tion number for this learning data set. One of the rea-
1 10 20 30 40 50 60 70
0
0.2
0.4
0.6
0.8
1
Gaussian unit number N
Glomerular module-
based correlation
Figure 7: Relationship between glomerular module-based
correlation and the Gaussian unit number.
sons for the decrease in correlation after N = 50 could
be that the activity at the center of the extra Gaussian
units does not obey the assumed relationship shown
in Equation (4) and Figure 5.
Figure 6(b) and (c) show the measured activity and
output of the glomeruli layer when N = 50, respec-
tively. Comparing the figures shows that the model
successfully reproduce the features seen in the mea-
sured activity. Specifically, the glomeruli layer output
shows the same trend in the shift of activated area.
These results suggest that the proposed learning algo-
rithm can approximate the learning data set.
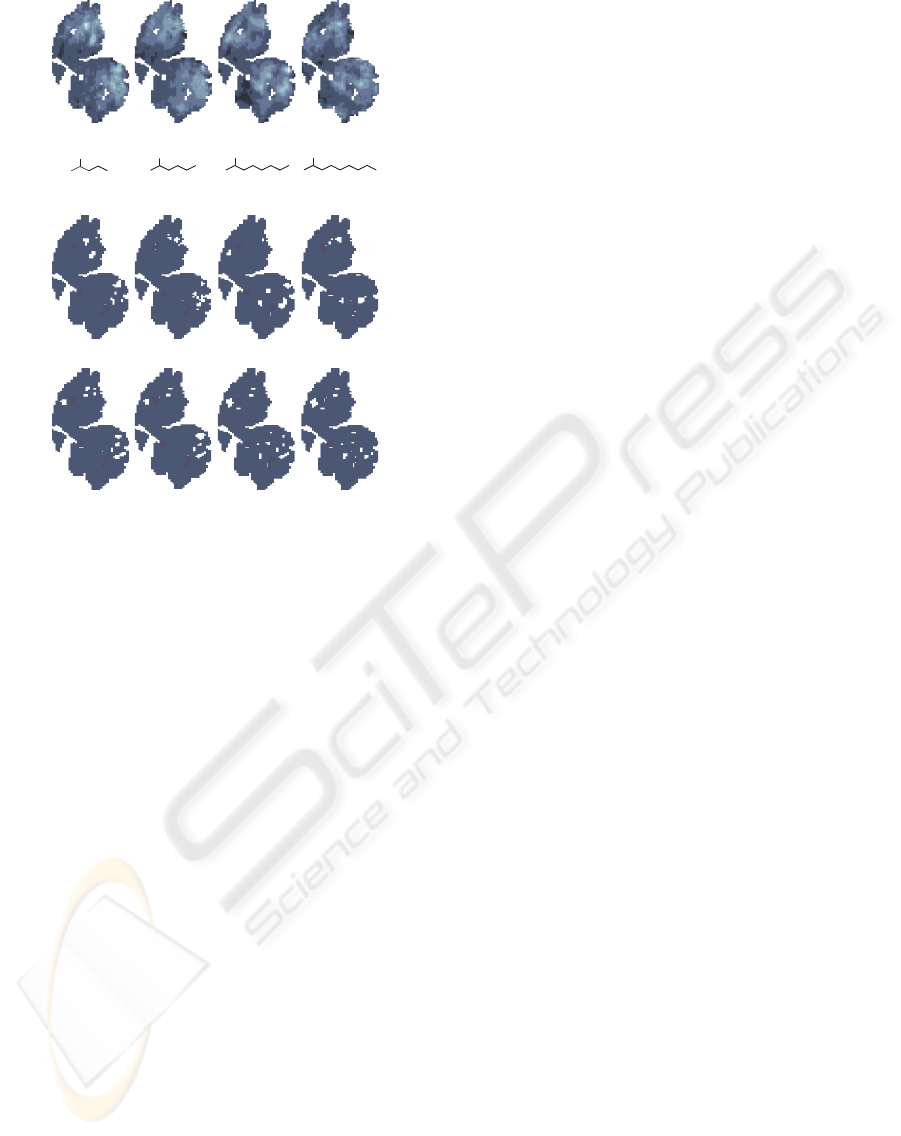
4.2 Prediction
Using the parameters determined in the learning sim-
ulation, odorants not included in the learning data set
A NEURAL NETWORK MODEL OF THE OLFACTORY SYSTEM FOR GLOMERULAR ACTIVITY PREDICTION
383
2-hexanol
2-octanol
2-nonanol
2-pentanol
OH
OH
OH
OH
(c) Results of prediction by the model (N=50)
(b) Binarized measured activity
(a) Prediction data set adapted from Glomerular
Response Archive (Leon and Johnson, 2009)
Corre-
lation
0.42 0.470.620.51
Figure 8: Prediction results.
were input to the model. The odorants for predic-
tion are shown in Figure 8 (a). These data were cho-
sen because they are structurally close to those of the
learning data set. The binarized measured activitiy
is shown in Figure 8 (b) and the binarized Glomeruli
layer output is shown in Figure 8 (c). Although the
predicted results are not as precise as the output for
the odorants in the learning data set, this activity, es-
pecially on the lower side, captured the features of
the measured activity. In addition, the shift of the ac-
tivated area from the caudal to the rostral side (left
to right) along with increases in the carbon number
seems to be preserved. These results imply the feasi-
bility of predicting glomerular activity using the pro-
posed model.
5 CONCLUSIONS
In this paper, we proposed an olfactory model aimed
at developing a novel algorithm to relate odorant
molecules to odour qualities. The proposed model
takes odorants as the input, from which glomerular
activity is produced. In the model, odorants are ex-
pressed in graph form, and a graph kernel function is
employed to estimate the response of of receptors to
the odorants. A learning algorithm was also proposed
to set the parameters included in the model. Using
the model and this learning algorithm, we performed
simulation to learn a set of glomerular activities. The
results indicated that the model could approximate
the features of the learning data set. Further, we
performed a prediction simulation using the param-
eters determined by the learning algorithm. Although
the correlation between the output of the model and
the measured activity was not as high as that of the
learned data, it was observed that the features in the
measured activity were captured. This indicates the
feasibility of predicting glomerular activity.
In future work, we aim to improve the prediction
ability of the model to enable the flavor of an odor-
ant to be predicted. To achieve this, we plan to intro-
duce other learning algorithms for feed-forward neu-
ral networks. In addition, the simulation needs to be
performed using a larger data set.
ACKNOWLEDGEMENTS
This work was partially supported by a Grant-in-Aid
for Scientific Research (21-9124) from the Research
Fellow-ships of the Japan Society for the Promotion
of Science (JSPS) for Young Scientists, and Grant-
in-Aid for Scientific Research on Innovative Areas
(20115010).
REFERENCES
Amoore, J. (1963). Stereochemical theory of olfaction. Na-
ture, 198:271–272.
Aungst, J. L., Heyward, P. M., Puche, A. C., Karnup,
S. V., Hayar, A., Szabo, G., and Shipley, M. T.
(2003). Centre-surround inhibition among olfactory
bulb glomeruli. Nature, 426:623–329.
Aznar, M., Lopez, R., Cacho, J., and Ferreira, V. (2001).
Identification and quantification of impact odorants
of aged red wines from rioja. gc-olfactometry, quan-
titative gc-ms, and odor evaluation of hplc frac-
tions. Journal of Agricultural and Food Chemistry,
49(6):2924–2929.
Buck, L. and Axel, R. (1991). A novel multigene family
may encode odorant receptors: a molecular basis for
odor recognition. Cell, 65:175–187.
Chen, S., Cowan, C., and Grant, P. (1991). Orthogonal least
squares learning algorithm for radial basis function
networks. IEEE Transactions on Neural Networks,
2(2):302–309.
Gutierrez-Osuna, R. (2002). Pattern analysis for machine
olfaction: A review. IEEE Sensors Journal, 2(3):189–
202.
Herz, R. and Engen, T. (1996). Odor memory review and
analysis. Psychonomic Bulletin and Review, 3(3):300
– 313.
IJCCI 2009 - International Joint Conference on Computational Intelligence
384

Johnson, B. A., Farahbod, H., and Leon, M. (2005). Interac-
tions between odorant functional group and hydrocar-
bon structure influence activity in glomerular response
modules in the rat olfactory bulb. The Journal of Com-
parative Neurology, 483(2):205–216.
Johnson, B. A. and Leon, M. (2007). Chemotopic odor-
ant coding in a mammalian olfactory. The Journal of
Comparative Neurology, 503(1):1–34.
Kashima, H., Tsuda, K., and Inokuschi, A. (2004). Kernels
for graphs. MIT Press.
Leon, M. and Johnson, B. A. (2009). Glomerular response
archive: http://leonserver.bio.uci.edu/.
Limpawattana, M., Yang, S., Yang, D., Kays, S., and
Shewfelt, R. (2001). Relating sensory descriptors to
volatile components in flavor of specialty rice types.
Journal of Food Science, 73(9):S456–S460.
Mori, K. and Yoshihara, Y. (1995). Molecular recognition
and olfactory processing in the mammalian olfactory
system. Progress in Neurobiology, 45:585–619.
Nelder, J. and Mead, R. (1965). A simplex method for func-
tion minimization. The Computer Journal, 7(4):308–
313.
Semmelroch, P. and Grosch, W. (1995). Analysis of roasted
coffee powders and brews by gas chromatography-
olfactometry of headspace samples. Food Science and
Technology, 28(3):310 – 313.
van Ruth, S. (2001). Methods for gas chromatography-
olfactometry: a review. Biomolecular Engineering,
17(4-5):121 – 128.
Youngentob, Johnson, B., Leon, M., Sheehe, P., and
Kent, P. (2006). Predicting odorant quality per-
ceptions from multidimensional scaling of olfactory
bulb glomerular activity patterns. Behavioral Neuro-
science, 120(6):1337–1345.
A NEURAL NETWORK MODEL OF THE OLFACTORY SYSTEM FOR GLOMERULAR ACTIVITY PREDICTION
385
