
USING ATTAINMENT SURFACE
FOR COMPARING NSGA-II AND SPEA-II
A Case Study
Alvaro Gomes, C. Henggeler Antunes, A. Gomes Martins
Institute for Systems Engineering and Computersat Coimbra, DEEC – FCT University of Coimbra, Portugal
João Melo
DEEC – FCT University of Coimbra, Coimbra, Portugal
Keywords: Evolutionary multi-objective optimization, genetic algorithms, algorithms assessment, surface attainment.
Abstract: This paper presents a comparative analysis of the results obtained with two different genetic algorithms,
NSGA-II and SPEA-II, in the framework of load management activities in electric power systems. The
multiobjective problem deals with the identification and the selection of suitable control strategies to be
applied to groups of electric loads aimed at reducing maximum power demand at the sub-station level,
maximizing profits with selling of electricity and minimizing the discomfort caused to the end-users. The
comparative analysis of the algorithms’ performance is done based on the attainment surface approach.
Besides, it is shown that this approach can be used as a vehicle to introduce the decision maker’s
preferences in the evaluation process.
1 INTRODUCTION
In single objective optimization problems, in which
the merit of solutions is evaluated in just one axis, it
is easy to find a metric that allows different solutions
to be compared and ranked even if the optimum is
not known. However, in a multiobjective (MO)
environment a solution is evaluated according to its
performance on each of the multiple, conflicting and
incommensurate objectives under optimization.
Typically, an “optimal” point, in the sense of
optimizing simultaneously all objective functions, is
an infeasible solution in the objective function space
and it does not even exist in the decision variable
space. Therefore, the decision maker (DM) must
choose a final solution from the set of non-
dominated solutions - the Pareto front (PF) -
according to his/her preferences. However, in
MOOP, although the non-dominance concept is the
key one, it is also a “poor” one in the sense that it
does not enable discrimination between
nondominated solutions. In order to distinguish
between two non-dominated solutions the DM’s
preference structure must be taken into
consideration. The need for taking into account the
DM’s preferences also arises when comparing sets
of potential solutions.
In this context, an important issue is what
approach to use for assessing and comparing sets of
potential solutions. Several approaches have been
reported in the literature regarding the evaluation of
solutions and algorithms (Ang and Li, 2001)
(Brockhoff et al., 2008) (Fonseca and Fleming,
1996) (Hansen and Jaskiewicz, 1998) (Knowles and
Corne, 2000, 2001) (Knowles et al., 2006) (Zitzler et
al., 2000, 2003, 2008). Genetic Algorithms (GA)
while tools to compute potential solutions to a given
problem should be able to identify diverse and well-
spread solutions over the Pareto frontier and, at the
same time, solutions should be as close as possible
to the true Pareto optimal frontier (POF) (Zitzler et
al., 2000).
The identification and choice of a metric is not
easy, at least in situations where neither an optimal
point nor the true Pareto front are known - that is,
whenever no references exist that can be used for
assessing the quality of the results obtained.
In this work the attainment surface metric (AS)
is used to compare the performance of two genetic
237
Gomes A., Henggeler Antunes C., Gomes Martins A. and Melo J. (2009).
USING ATTAINMENT SURFACE FOR COMPARING NSGA-II AND SPEA-II - A Case Study.
In Proceedings of the International Joint Conference on Computational Intelligence, pages 237-242
DOI: 10.5220/0002323602370242
Copyright
c
SciTePress

algorithms to deal with the design and identification
of load management actions in electrical power
systems. It is shown that it is possible to use the AS
metric also as a tool to incorporate the DM’s
preferences when comparing sets of solutions. In
section 2 an overview about algorithm evaluation is
presented. In section 3 the problem under analysis is
briefly described, while the case study is introduced
in section 4. The analysis of the results is done in
section 5 and conclusions are drawn in section 6.
2 PERFORMANCE ASSESSMENT
When the true POF is not known, which is a
common situation in real-world MOOP, reference
alternatives have been used in order to overcome the
problems resulting from not knowing exactly the
Pareto front (Ang and Li, 2001)(Gomes et al., 2008).
Evaluating the results of a multiobjective problem is
itself a multiobjective problem, and intensive
research work is being carried out in order to deal
with the assessment of solutions in MOOP (Branke
et al., 2001) (Knowles and Corne, 2000,
2006)(Zitzler et al., 2000, 2008). Recently some
researchers focussed their work on comparing sets of
solutions or populations (Zitzler et al., 2003, 2008).
In the problem under study in this work, as in
many real-world problems, the POF is unknown and
the diversity and the spreading of solutions are not to
be taken for granted. Therefore, the assessment of
the algorithms performance is carried out by using
the AS concept described in Fonseca and Fleming
(1996) and extended by Knowles and Corne (2000).
If the non-dominated solutions resulting from a
multiobjective optimizer are the points P
1
, P
2
, …, P
n
(Figure 1) then the attainment surface is the surface
limited by the lines joining the points. This surface
divides the search space into two regions: DR is the
region of the search space dominated by solutions
computed by the algorithm, while NDR is the region
of the search space non-dominated by the solutions
computed by the algorithm. As proposed by Fonseca
and Fleming (1996), if a set of lines (Figure 1.b)
equally spread are drawn starting from the origin
towards the AS then we can compare the distance of
each AS to the origin and identify the AS that is first
intersected by each line. The number of times each
AS is first intersected by different lines enables to
compare the sets resulting from each algorithm.
Knowles and Corne (2000) extended this
analysis in the following manner. Having m runs
from each algorithm each line has 2m intersections
and a statistical univariate analysis on the
distribution of the intersections can be done
providing a measure about the performance of the
algorithms in the region of the space represented by
each line. These authors use a pair of values (a, b),
in which a represents the percentage of the space
(lines) in which the first algorithm performs better
that the second algorithm and b represents the
percentage of the space (lines) in which the second
algorithm performs better than the first one. If the
set of lines cover the whole front then the attainment
surface method allows to deal with the three issues
raised in the performance assessment: distance to the
POF, distribution and diversity of the solutions.
1
f
2
f
1
f
2
f
Figure 1: (a) Attainment surface, in a problem with two
objective functions. (b) Two different attainment surfaces
resulting from 2 different runs (two different algorithms or
the same algorithm with a different set of parameters).
The analysis done using the AS is carried out
after the simulations of the GAs, and two different
analyses are possible: one carried out in a
generational basis all over the simulation and the
other based on the last generation populations only.
Very often the POF computed is very large and
may present many solutions that are not interesting
from the DM’s perspective. An interesting situation
is the one in which it is possible to take into account
the DM’s preferences when comparing the
populations. It is possible to introduce thresholds
representing the DM’s preferences and then
computing the AS metric taking into account those
threshold levels. That is, the AS can be used as a
tool allowing both to compare the performance of
GAs and at the same time to incorporate the DM’s
preferences in the analysis, thus resulting in a
reduced set of solutions more in accordance with the
DM’s preferences. The DM is asked to provide
aspiration and/or reservation levels and the AS takes
these levels into account. The aspiration level
represents the value that the DM would like to attain
in each objective function, thus leading to the
identification of a region in the search space
containing the “better” solutions according to the
DM’s preferences. The reservation levels represent
the worst values the DM is willing to accept for each
IJCCI 2009 - International Joint Conference on Computational Intelligence
238

objective function, according to his/her knowledge
about the problem domain. Solutions that do not
attain these levels may be eventually penalized and
would be hardly chosen. A third type of threshold
may be considered denoting a “non-feasible” level,
meaning that a solution is “unfeasible” according to
the DM’s preferences (that may evolve over the
simulation/generations). These non-feasible levels
can be taken into consideration in the MO model by
imposing hard constraints at the outset, which may
later be removed or revised. In some real-world
problems the best way to deal with non-feasible
solutions if through the penalization of their fitness,
and thus give them low reproduction probability.
These solutions can exist (preferably in very low
number) in the population. These preference-driven
thresholds influence the assessment of the
algorithms done by the AS (Figure 2 and Figure 3).
In figure 2, algorithm B performs better then
algorithm A in 60% of the search space. However,
when taking into consideration the DM preference
levels the amount of space in which algorithm B
performs better then algorithm A changes
drastically. One can say that A performs better in
85% of the “space” that is more interesting from the
DM perspective, that is, 85% of the space delimited
by the reservation levels of the DM.
1
f
2
f
1
f
2
f
Figure 2: AS metric as a way to compare the algorithm
performance.
2
f
1
f
1
f
2
f
Figure 3: AS metric, taking into consideration the DM’s
preferences.
3 CASE STUDY
With the restructuring and unbundling of the
electricity sector, a common scenario is the one in
which electricity retailers buy the electricity in the
wholesale market and sell the electricity to the end-
users in the retail markets. Very often, the electricity
prices at the wholesale market change more
frequently and more intensely than at the retail
market. As most consumers buy electricity at fixed
costs (over a period of time) if retailers have the
ability to appropriately change their customer’s load
then they can take advantage of the difference of
prices between the wholesale market and the retail
market. As energy profits depend on the amount of
energy sold and the maximum peak demand, the
application of control strategies to some end-use
loads changes the demand patterns and thus changes
the profits per unit of energy sold. The aim is to
identify adequate on/off periods (load control
actions that change the regular working cycle of
end-use loads) to be implemented on a daily basis
that allow, at the same time, to reduce the maximum
power demand and to increase profits without
imposing a severe discomfort to the end-users.
These competing objectives make the design and
selection of the direct load control actions a hard
combinatorial multiobjective problem that can be
tackled by EAs.
The objective of this work is to compare the
performance of NSGA-II and SPEA-II when used in
the identification of the direct load control action to
be applied over several groups of air conditioners in
order to reduce the maximum demand of a sub-
station. The topmost issue in these activities is the
identification of suitable on/off periods to be applied
over some end-use loads (Heffner and Goldman,
2001)(Hirst and Kirby, 2001)(Gomes et al., 2004)
(Molina et al., 2004).
In this case, the pursued objectives are
minimization of maximum peak power demand in a
given substation (PD); maximizing profits with
selling of electricity (Pr); and minimizing the
eventual discomfort caused to the consumers,
measured as the maximum interval of time (MI), in
minutes, in which the room temperature was above
the comfort temperature.
Usually, the implementation of activities
involving the use of demand-side resources requires
combining several end-use loads in groups and
applying a given control strategy (set of all on/off
control periods) over each group of loads 800 air
conditioners were identified as available for control
and have been grouped as shown in table 1.
The maximum peak demand at the substation is
about 17769 kW, at 15:00h, and the maximum
demand of all air conditioners under control is about
2280 kW also occurring at 15:00h.
USING ATTAINMENT SURFACE FOR COMPARING NSGA-II AND SPEA-II - A Case Study
239

Some characteristics of the algorithm are:
• Size of the population: 30
• Stop condition: 7000 generations
• Crossover probability
o NSGA-II: 0.1; SPEA-II: 0.7
• Mutation probability: adaptive control.
Table 1: Groups of air conditioners under control.
Groups 1 2 3 4 5 6 7
# loads 40 60 50 100 75 75 100
Groups 8 9 10 11 12 13 14
# loads 15 20 30 100 50 10 75
The values for the crossover probability in the
two algorithms are the ones that allowed obtaining
the best results in each case.
The implementation of the algorithms is slightly
different from the original implementations. The
main difference is the way the mutation operator is
constructed. In our implementation, instead of being
a fixed value the mutation operator presents an
adaptive control behaviour, in such a way that the
mutation probability of one gene may be different
from the mutation probability of other genes in the
same individual. Also, the mutation probability of
genes in one individual may be different from the
mutation probability of the genes in other
individuals in the population. Moreover, as the
binary alphabet has been used for the encoding of
individuals two different mutations can occur (0 → 1
and 1 → 0), and these two mutations may occur with
different probabilities (Figure 4).
0
5
10
15
20
25
30
35
0.0000
0.0002
0.0004
0.0006
0.0008
0.0010
0.0012
00:00
01:00
02:00
03:00
04:00
05:00
06:00
07:00
08:00
09:00
10:00
11:00
12:00
13:00
14:00
15:00
16:00
17:00
18:00
19:00
20:00
21:00
22:00
23:00
Power (MW)
Mutation probability for one individual
pm 0->1
pm 1->0
Demand SS
Figure 4: Mutation probability for one individual (showing
the values for the two mutations that can occur).
4 SOME RESULTS
The analysis is based on 7 runs for each algorithm.
The solutions computed by NSGA-II and SPEA-II
are displayed in Figures 5 - 8.
A 2D graph enables to qualitatively evaluate
each non-dominated front. As the results obtained
for objective function MI are integer values that are
multiple of 5 (5, 10, 15…), the non-dominated fronts
for different values of MI (5, 10, 15 and 20 minutes)
are shown in order to use 2D graphs. Only NSGA-II
was able to identify solutions with MI=5 minutes.
Regarding the situation MI=10 minutes, solutions
computed by SPEA-II dominate all the solutions
computed by NSGA-II. The opposite happens for
MI=15 and MI=20 minutes.
1.74 1.745 1.75 1.755 1.76 1.765
x 10
4
-8849
-8848.5
-8848
-8847.5
-8847
-8846.5
-8846
-8845.5
-8845
Power (kW)
Profits (Euro)
Maximum interval 5 minutes
NSGA-II
Figure 5: Results for profits and power demand
(considering maximum interval 5 minutes).
1.7 1.71 1.72 1.73 1.74
x 10
4
-8879
-8878
-8877
-8876
-8875
-8874
-8873
-8872
Power(kW)
Profits (Euro)
Maximum interval 10 minutes
NSGA-II
SPEA-II
Figure 6: Results for profits and power demand
(considering maximum interval 10 minutes).
With the non-dominated solutions resulting from
the 7 runs of each algorithm, the percentage of space
in which the solutions computed by NSGA-II
dominate the solutions computed by SPEA-II
(Figure 9) was calculated. NSGA-II is better in
about 35% of the space while SPEA-II performs
better in about 24%. In the remaining 41% one
cannot say that one algorithm is better than the
other.
The introduction of reservation levels (inferior
values the DM is willing to accept) leads to
IJCCI 2009 - International Joint Conference on Computational Intelligence
240

“removing” from the analysis some regions of the
search space that are not interesting to the DM when
computing the AS. In this problem the DM choose
as reservation levels the following values: 17300 kW
for peak power demand, 8860 k€ for profits and 10
for maximum interval objective. The new results for
the AS metric are shown in Figure 10.
1.67 1.675 1.68 1.685 1.69 1.695 1.7
x 10
4
-8918
-8916
-8914
-8912
-8910
-8908
-8906
Power(kW)
Profits (Euro)
Maximum interval 15 minutes
SPEA-II
NSGA-II
Figure 7: Results for profits and power demand
(considering maximum interval 15 minutes).
1.65 1.655 1.66 1.665
x 10
4
-8950
-8945
-8940
-8935
-8930
Power(kW)
Profits (Euro)
Maximum interval 20 minutes
NSGA-II
SPEA-II
Figure 8: Results for profits and power demand
(considering maximum interval 20 minutes).
35%
24%
41%
NSGA-II better SPEA-II better Equal
Figure 9: Percentage of the search space in which each
algorithm performs better.
It can be seen that solutions identified by SPEA-
II are never dominated by solutions computed by
NSGA-II and dominate the solutions computed by
NSGA-II in about 85% of the space. Introducing the
DM’s preferences in the calculation of the AS metric
causes changes in the initial results of the metric.
The two algorithms perform distinctly in different
regions of the search space, being the SPEA-II able
to compute solutions more in accordance with the
DM preferences. Probably, NSGA-II is able to
compute solutions that are very good in some
objectives but really bad in the other objectives.
85%
15%
SPEA-II better Equal
Figure 10: Percentage of the search space in which each
algorithm performs better taking into consideration the
DM preferences.
Besides applying the AS metric on the results of
the last generation of each algorithm, we have done
a generational analysis by computing the AS in each
generation by using one run of each algorithm
(Figure 11).
0
10
20
30
40
50
60
70
80
90
100
1 527 1053 1579 2105 2631 3157 3683 4209 4735 5261 5787 6313 6839
SPEA-II better then NSGA-II NSGA-II better then SPEA-II
NSGA-II equal to SPEA-II
%
Number of generations
Figure 11: AS computed in each generation.
We can see that after the first one thousand
generations the SPEA-II algorithm performs better
than NSGA-II only in about 15%-20% of the
objective search space while in about 40% of the
space no algorithm performs better that the other.
A generational analysis has been done based on
the minimal Euclidean distance between the
population and a reference point whose coordinates
can be the values the DM would like to attain in
each objective (aspiration levels) or, as in this case,
the best values obtained in each objective (16 500
kW; 5 minutes; 8950 k Euros) (Figure 12). The
population generated by NSGA-II always contains
USING ATTAINMENT SURFACE FOR COMPARING NSGA-II AND SPEA-II - A Case Study
241
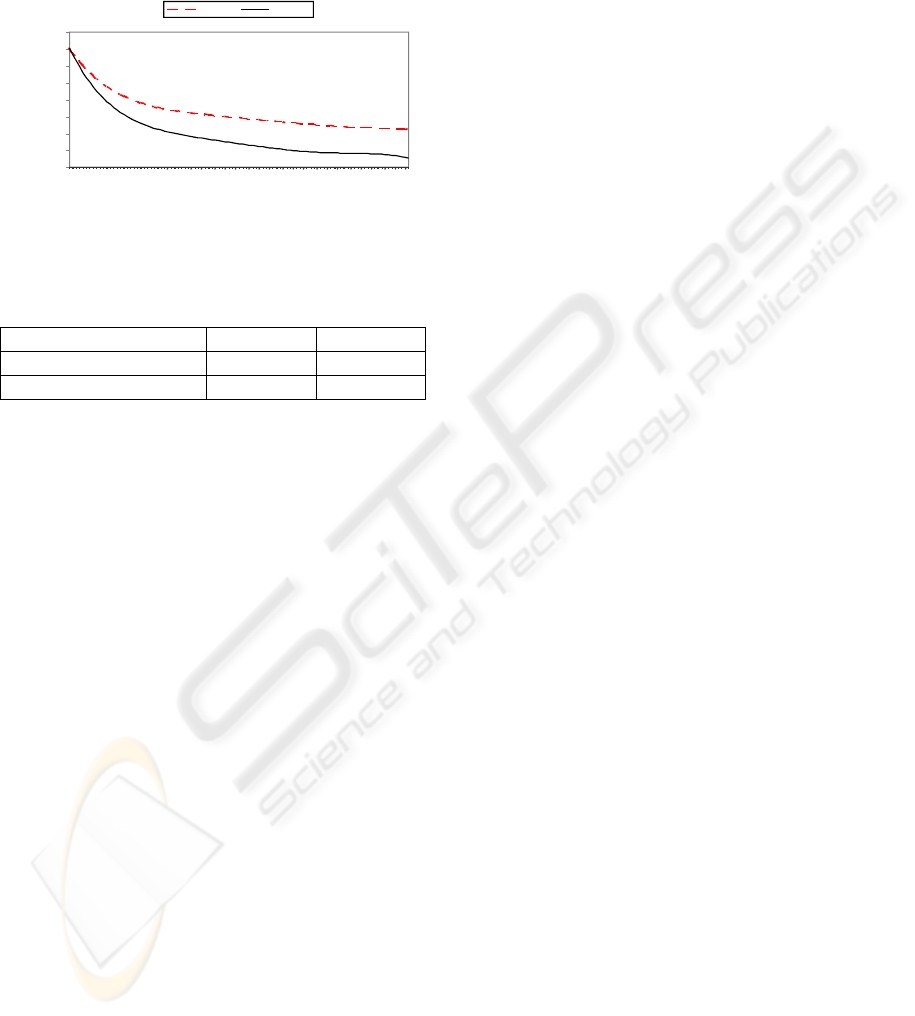
the individual(s) closer to the reference point (Fig. 12).
The impacts of the direct load control actions on
the demand are displayed in Table 1. It was possible
to reduce the maximum power demand at the sub-
station level without decreasing profits.
0
0.2
0.4
0.6
0.8
1
1.2
1.4
1.6
1 524 1047 1570 2093 2616 3139 3662 4185 4708 5231 5754 6277 6800
SPEA-II NSGA-II
Distance to PMO
Number of generations
Figure 12: Minimal distance in each generation between
the population and the reference point.
Table 1: Impacts of direct load control actions on the
demand at the sub-station and on the profits.
Original SPEA-II
Demand at SE (kW) 17769,1 17055,8
Profits (€) 8837,74 8876,96
5 CONCLUSIONS
In this work the AS has been used to compare the
results obtained with NSGA-II and SPEA-II in the
identification of load control actions to be
implemented over groups of air conditioners. AS
allows to dealing with diversity of solutions,
distribution and proximity to the true Pareto front.
Moreover, it was possible to introduce the DM
preferences and thus reduce the number of non-
dominated solutions that the DM has to screen in
order to select one solution for implementation.
REFERENCES
Ang, K., Y. Li, 2001. “Mutil-Objective Benchmark
Studies for Evolutionary Computation”, Genetic and
Evolutionary Computation Conference, Workshop
Program, 393-396, San Francisco, California, 2001.
Branke, J., T. Kaubler and H. Schmeck, 2001. "Guidance
in Evolutionary Multi-Objective Optimization",
Advances in Engineering Software, 32.
Brockhoff, D., T. Friedrich, and F. Neumann, 2008.
“Analysing Hypervolume Indicator Based
Algorithms”, Rudolph et al. (Eds.): PPSN X, LNCS
5199, pp. 847–858, 2008.
Deb, K., S. Agrawal, A. Pratab, T. Meyarivan, 2002. “A
fast and elitist multiobjective genetic algorithm:
NSGA-II”, IEEE Transactions on Evolutionary
Computation, 6 (2), pp. 182-197.
Fonseca, C., P. Fleming (1996), “On the performance
assessment and comparison of stochastic
multiobjective optimizers”, In H.-M. Voigt, W.
Ebeling, I. Rechenberg, and H.-P. Schwefel (Eds),
Fourth International Conference on Parallel Problem
Solving from Nature (PPSN-IV), Berlin, Germany,
584-593, 1996. Springer.
Gomes, A., C. H. Antunes, A. G. Martins, 2004b. “A
multiple objective evolutionary approach for the
design and selection of load control strategies". IEEE
Transactions on Power Systems, 2004, 19(2), p. 1173-
1180.
Gomes, A., C. H. Antunes, A. G. Martins, 2008. “Design
of an Adaptive Mutation Operator in an Electrical
Load Management Case Study”. Computers and
Operations Research, 2008, 35(9), p. 2925-2936.
Hansen, M., A. Jaszkiewicz (1998), "Evaluating the
quality of approximations to the non-dominated set”,
IMM Technical Report IMM-REP-1998-7, Technical
University of Denmark, http://delta.cs.cinvestav.mx
/~coello/EMOO/EMOObib.html em 24/10/2003,
March 1998.
Heffner, G., and C. Goldman, "Demand Responsive
Programs - An Emerging Resource for Competitive
Electricity Markets?", Proceedings of the International
Energy Program Evaluation Conference (2001
IEPEC), 2001.
Hirst, E., and B. Kirby, 2001. "Retail-Load Participation
in Competitive Wholesale Electricity Markets",
Edison Electric Institute, 2001.
Knowles, J., and D. Corne, 2000. "Approximating the
Nondominated Front Using the Pareto Archived
Evolution Strategy, "Evolutionary Computation
Journal, 8, 2.
Knowles, J., and D. Corne, 2001. "On metrics for
comparing non-dominated sets”, In Congress on
Evolutionary Computation (CEC’2002), Vol 1, pp
711-716, Piscatawya, New Jersey, May 2002.
Knowles, J., L. Thiele, and E. Zitzler, 2006. “A Tutorial
on The Performance Assessment of Stochastic
Multiobjective Optimizers”, Tik Report Nº 214, 2006.
Molina, A., A. Gabaldon, C. Alvarez, J. A. Fuentes, and E.
Gómez; “A Physically Based Load Modelo f
Residential Electric Thermal Storage: Applications to
LM Programs”; International Journal of Power and
Energy Systems, Vol. 24, 1, 2004.
Zitzler, E., L. Thiele, K. Deb, 2000. "Comparison of
Multiobjective Evolutionary Algorithms: Empirical
Results", Evolutionary Computation, 8, 2, 173-195.
Zitzler, E., L. Thiele, M. Laummans, C. Fonseca and V.
Grunert da Fonseca, 2003; “Performance Assessment
of Multiobjective Optimizers: An Analysis and
Review”; IEEE Transactions on Evolutionary
Computation, vol. 7, no. 2, April 2003.
Zitzler, E., L. Thiele, and J. Bader, 2008b. “SPAM: Set
Preference Algorithm for Multiobjective
Optimization”, Rudolph et al. (Eds.): PPSN X, LNCS
5199, pp. 847–858, 2008.
IJCCI 2009 - International Joint Conference on Computational Intelligence
242
