
C-FUZZY DECISION TREES IN DEFAULT PREDICTION OF
SMALL ENTERPRISES
Maria Luiza F. Velloso, Thales Ávila Carneiro
Department of Eletronics, Rio de Janeiro State University, São Francisco Xavier 524, Rio de Janeiro, Brazil
José Augusto Gonçalves do Canto
Institute of Political Science and Economics, Candido MendesUniversity, Rio de Janeiro, Brazil
Keywords: Decision trees, Fuzzy clustering, Default prediction.
Abstract: This work uses fuzzy c-tree in order to predict default in small and medium enterprises in Brazil, using
indexes that reflect the financial situation of enterprise, such as profitable capability, operating efficiency,
repayment capability and situation of enterprise’s cash flow, etc. Fuzzy c-trees are based on information
granules—multivariable entities characterized by high homogeneity (low variability). The results are
compared with those produced by the “standard” version of the decision tree, the C4.5 tree. The
experimental study illustrates a better performance of the C-tree.
1 INTRODUCTION
The issue of credit availability to small firms has
garnered world-wide concern recently. Small and
Medium Enterprises (SMEs) are almost 99% of the
total number of firms in Brazil, and they offer 78%
of the jobs in the country. But, around 80% of SMEs
is shut down before one year of activity. Many
public and financial institutions launch each year
plans in order to sustain this essential player of
nation economies (Altman, Sabato, 2006).
Borrowing remains undoubtedly the most important
source of external SME financing.
SMEs in Brazil share some characteristics with
the private individuals:
− Large number of applications
− Small profit margins
− Irregular available information (especially
for the micro companies).
Small firms may be particularly vulnerable
because they are often so informationally opaque,
and the informational wedge between insiders and
outsiders tends to be more acute for small
companies, which makes the provision of external
finance particularly challenging (Berger, Udell,
2002). Some financial ratios are used in the context
of default prediction in small and micro firms
operating in a state of Brazil and we choose some of
them, as described in Section 3.
Although the enterprise’s wish of returning loan,
which is represented by the rate of returning
interests, we often don’t have any information about
the amount of interests that has been repaid by
enterprises that are requiring a loan for the first time.
In this case, the prediction of default relies on
information in the balance sheet of these enterprises.
Decision trees (Quinlan, 1986) are the
commonly used architectures of machine learning
and classification systems, particularly in default
prediction or scoring. They come with a
comprehensive list of various training and pruning
schemes, a diversity of discretization (quantization)
algorithms, and a series of detailed learning
refinements. In spite of such variety of the
underlying development activities, one can easily
find several fundamental properties that are common
in the entire spectrum of the decision trees. First, the
trees operate on discrete attributes that assume a
finite (usually quite small) number of values.
Second, in the design procedure, one attribute is
chosen at a time. More specifically, one selects the
most “discriminative” attribute and expands (grows)
the tree by adding the node whose attribute’s values
are located at the branches originating from this
node. The discriminatory power of the attribute
94
Velloso M., Carneiro T. and Canto J. (2009).
C-FUZZY DECISION TREES IN DEFAULT PREDICTION OF SMALL ENTERPRISES.
In Proceedings of the International Joint Conference on Computational Intelligence, pages 94-98
DOI: 10.5220/0002324500940098
Copyright
c
SciTePress

(which stands behind its selection out of the
collectionof the attributes existing in the problem at
hand) is quantified by means of some criterion such
as entropy, Gini index, etc. (Weber, 1992).
Fuzzy clustered-oriented decision trees have an
structure where data can be perceived as a collection
of information granules (Pedrycz, Sosnowski, 2004).
Information granules are represented by clusters.
The continuous nature of the classes is captured by
fuzzy clusters. Fuzzy granulation deals with the
discretization problem in the formation of the tree in
a direct and intimate manner.
This work uses fuzzy c-tree in order to predict
default in small and medium enterprises in Brazil,
using indexes that reflect the financial situation of
enterprise, such as profitable capability, operating
efficiency, repayment capability and situation of
enterprise’s cash flow, etc.
Section 2 reviews some concepts of Fuzzy
Decision C- Trees and Section 3 describes the
experiment.
2 CLUSTER DECISION TREE
The architecture of the cluster–based decision tree
develops around fuzzy clusters that are treated as
generic building blocks of the tree. The training data
set X={x(k),y(k)}, k=1,2, …, N, where x(k) ∈ R
d
,
is clustered into clusters so that the similar data
points are put together.
These clusters are completely characterized by
their prototypes (centroids). They are positioned at
top nodes of the tree structure. The way of building
the clusters implies a specific way in which we
allocate elements of X to each of them. Each cluster
comes with a subset of X, namely X
1
, X
2
, … , X
c
.
The process of growing the tree is guided by a
certain heterogeneity criterion that quantifies a
diversity of the data (with respect to the output
variable y) falling under the given cluster (node).
We can choose the nodes with the highest
heterogeneities values and treat them as candidates
for further refinement.
The process is repeated by selecting the most
heterogeneous node out of all final nodes. The
growth of the tree is carried out by expanding the
nodes and building their consecutive levels that
capture more details of the structure. It is noticeable
that the node expansion leads to the increase in
either the depth or width (breadth) of the tree. The
pattern of the growth is very much implied by the
characteristics of the data as well as influenced by
the number of the clusters.
2.1 Tree Development
Fuzzy clustering is a core functional part of the
overall tree. It builds the clusters and the standard
fuzzy C-means (FCM) (Bezdek, 1981) is used.
For the purpose of clustering the ordered pairs
{x(k),y(k)} are concatenated. This implies that the
clustering takes place in the (d+1) dimensional
space and involves the data distributed in the input
and output space. Likewise, the resulting prototype
(f
i
) is positioned in R
d+1
.The coordinates of the
prototype are split into two parts as follows:
v
i
= {v
i1
, v
i2
, …, v
in
} = {f
i1
, f
i2
, …, f
in
}
and
w
i
= f
n+1
.
The first part, v
i
, describes a prototype located in the
input space and it is used in the classification
(prediction) mode.
The growth process of the tree is pursued by
quantifying the diversity of data located at the
individual nodes of the tree and splitting the nodes
that exhibit the highest diversity. This criterion takes
into account the variability of the data, finds the
node with the highest value of the criterion, and
splits it into c nodes that occur at the consecutive
lower level of the tree.
The ith node N
i
can be represented as an ordered
triple
N
i
= < X
i
, Y
i
, U
i
> (1)
X
i
denotes all elements of the data set that
belong to this node in virtue of the highest
membership grade
X
i
=
{
x
i
(k)∣u
i
(k) > u
j
(k) for all
j
≠i
}
(2)
The index j pertains to the nodes originating
from the same parent.
The second set collects the output coordinates of
the elements that have already been assigned to X
i
.
Likewise, U
i
= [u
i
(x(1)), u
i
(x(2)), …., u
i
((x(N))] is a
vector of the grades of membership of the elements
in X
i
.
We define the representative of this node
positioned in the output space as the weighted sum
(note that in the construct hereafter we include only
those elements that contribute to the cluster so the
summation is taken over X
i
and Y
i
), as follows:
(
)
(
)
(
)
()()
∑
∑
=
k
i
k
i
i
kxu
kykxu
m
(3)
C-FUZZY DECISION TREES IN DEFAULT PREDICTION OF SMALL ENTERPRISES
95

The variability of the data in the output space
existing at this node V
i
is taken as a spread around
the representative ( m
i
) where again we consider a
partial involvement of the elements in X
i
by
weighting the distance by the associated
membership grade,
()()
(
)()
() ()()
.
,
2
∑
−
=
×∈
ii
YXkykx
ii
i
mky
kxuV
(4)
In the next step, we select the node of the tree
(leaf) that has the highest value of V
i
, and expand
the node by forming its children by applying the
clustering of the associated data set into c clusters.
The process is then repeated: we examine the leaves
of the tree and expand the one with the highest value
of the diversity criterion.
The growth of the tree is controlled by conditions
under which the clusters can be further expanded
(split).We envision two intuitively conditions that
tackle the nature of the data behind each node.
The first one is self-evident: a given node can be
expanded if it contains enough data points. With
clusters, we require this number to be greater than
the number of the clusters; otherwise, the clusters
cannot be formed.
The second stopping condition pertains to the
structure of data that we attempt to discover through
clustering. It becomes obvious that once we
approach smaller subsets of data, the dominant
structure (which is strongly visible at the level of the
entire and far more numerous data set) may not
manifest that profoundly in the subset. It is likely
that the smaller the data, the less pronounced its
structure. This becomes reflected in the entries of the
partition matrix that tend to be equal to each other
and equal to 1/c.
If no structure becomes present, this equal
distribution of membership grades occurs across
each column of the partition matrix.
The diversity criterion (sum of variabilities at
the leaves) can be also viewed as another
termination criterion.
2.2 Classification (Prediction) Mode
Once the C-tree has been constructed, it can be used
to classify a new input ( x) or predict a value of the
associated output variable (denoted here by ).
In the calculations, we rely on the membership
grades computed for each cluster as the standard
fuzzy C-means (FCM). The calculations pertain to
the leaves of the C-tree, so for several levels of
depth we have to traverse the tree first to reach the
specific leaves. This is done by computing u
i
(x) and
moving down. At some level, we determine the path
that maximizes u
i
(x). The process repeats for each
level of the tree. The predicted value occurring at the
final leaf node is equal to m
i
defined in Equation (3).
3 DEFAULT PREDICTION
The sample data set comes from a state-owned
commercial bank. The dataset of 243 samples
represent SMEs. Among these enterprises, the
number of the enterprises which can repay the loan
is 123, the rest 120 are those which can not repay the
loan.
In order to evaluate the performance of the tree a
fivefold cross-validation was used. More
specifically, in each pass, an 80–20 split of data is
generated into the training and testing set,
respectively, and the experiments are repeated for
five different splits for training and testing data.
The binary default variable Yi = 1 if firm i
defaults, and Y
i
= 0 otherwise.
Our model is an accounting based model. In this
kind of model, accounting balance sheets are used
and the input indexes include the enterprise’s
capability of returning loan and wish of returning
loan. The wish of returning loan is measured by the
rate of returning interests, namely
X
0
= Amount of interests that has been repaid /
Amount of interests that should be repaid.
The capability of returning loan is measured by
several indexes that reflect the financial situation of
enterprise, such as profitable capability, operating
efficiency, repayment capability and situation of
enterprise’s cash flow, etc. The several rates are as
follows:
X
1
= Earnings before taxes / Average total assets
X
2
= Total liabilities / Ownership interest
X
3
= Operational cash flow / Total liabilities
X
4
= Working capital / Total assets.
Each index represented the average of three
periods before the prediction period.
In order to evaluate the performance of the tree a
fivefold cross-validation was used. More
specifically, in each pass, an 80–20 split of data is
generated into the training and testing set,
respectively, and the experiments are repeated for
five different splits for training and testing data.
The chosen number of clusters was c=2, since
we were dealing with a binary classification. We
selected the first node of the tree, which is
IJCCI 2009 - International Joint Conference on Computational Intelligence
96
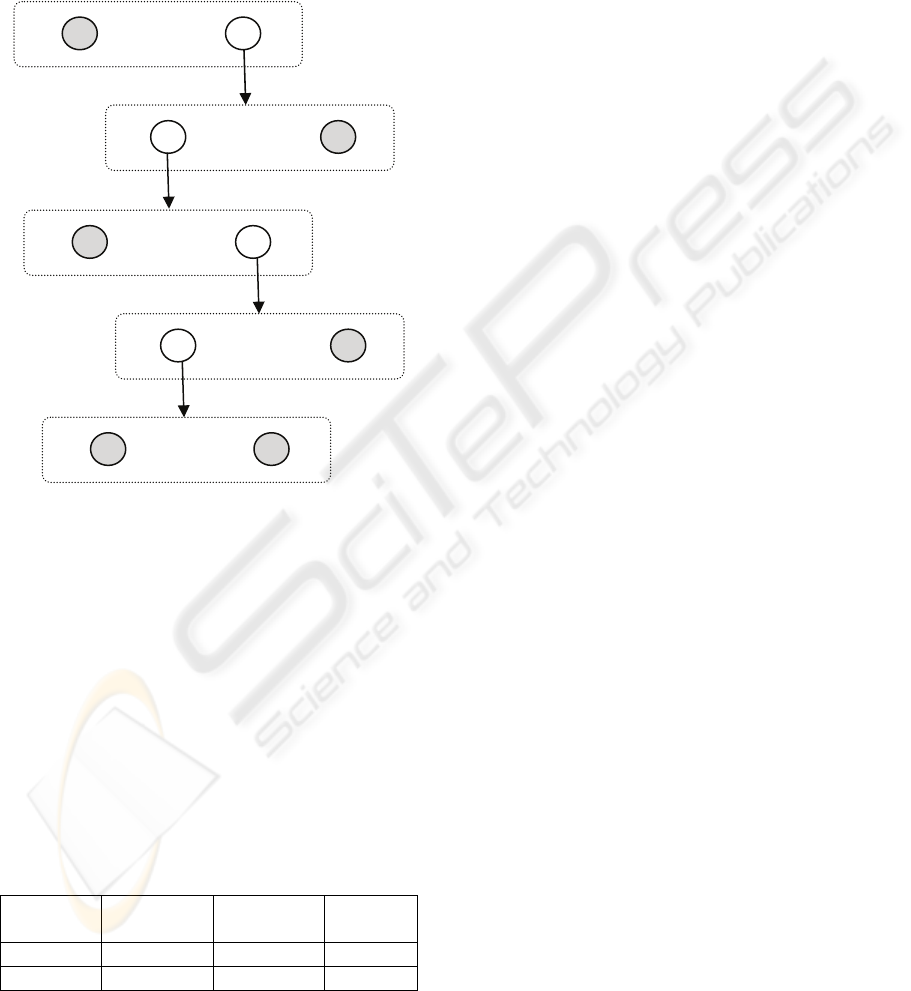
characterized by the highest value of the variability
index, and expand it by forming two children nodes
by applying the FCM algorithm to data associated
with this original node. The decision tree grown in
this manner is visualized in Fig. 1. Nodes in gray
represent zero variability. All leaves of the tree have
zero variability. Therefore, the error in training
dataset was zero.
Figure 1: Fuzzy c-tree structure. Gray circles have zero
variability.
It is of interest to compare the results produced
by the C-decision tree with those obtained when
applying “standard” decision trees, namely C4.5.
The results are summarized in Table 1. We
report the mean values of the error. For the C-
decision trees, the number of nodes is equal to the
number of clusters multiplied by the number of
iterations. The C-tree is more compact (in terms of
the number of nodes). This is not surprising as its
nodes are more complex than those in the C4.5
decision tree. The results on the training and test sets
are better for the C-trees.
Table 1: C-decisions tree and C4.5 results.
Decision
Tree
Error
Training
Error Test Nodes
C-tree 0% 20% 10
C4.5 10% 35% 14
4 CONCLUSIONS
The C-decision trees are classification constructs
that are built on a basis of information granules—
fuzzy clusters. In contrast to C4.5-like trees, all
features are used once at a time, and such a
development approach promotes more compact trees
and a versatile geometry of the partition of the
feature space. The experimental study illustrates a
better performance of the C-tree. Further research
should be conducted to test the potential
improvements associated with such approach. New
strategies for splitting nodes can be developed as
well as for stopping criterions. We intend conduct
research in order to extract rules with improved
interpretability. Others comparisons could be
experimented. In spite of the simplicity adopted, the
experimental results confirm the effectiveness of c-
trees in default prediction of SMEs .
REFERENCES
Altman, Edward I., Sabato, Gabriele. 2006. The Impact of
Basel II on SME Risk Management, 7° Forum
Internacional de Credito SERASA, Sao Paulo - Brazil
Berger, Allen N. Moore, Udell, Gregory F. ,2002. Small
Business Credit Availability and Relationship
Lending: The Importance of Bank Organisational
Structure. The Economic Journal, Vol. 112, 2002.
J. R. Quinlann, “Induction of decision trees,” Machine
Learning. 1, pp. 81–106, 1986.
W. P. Alexander and S. Grimshaw, “Treed regression,” J.
Computational Graphical Statistics, vol. 5, pp. 156–
175, 1996.
L. Breiman, J. H. Friedman, R. A. Olshen, and C. J.
Stone, Classification and Regression Trees. Belmont,
CA: Wadsworth, 1984.
A. K. Jain et al., “Data clustering: A review,” ACM
Comput. Surv., vol. 31, no. 3, pp. 264–323, Sep. 1999.
C4.5: Programs for Machine Learning. San Francisco,
CA:Morgan Kaufmann, 1993.
R.Weber, “Fuzzy ID3: A class of methods for automatic
knowledge acquisition,” in Proc. 2nd Int. Conf Fuzzy
Logic Neural Networks, Iizuka, Japan, Jul. 17–22,
1992, pp. 265–268.
W. Pedrycz, Z. A. Sosnowski, “C–Fuzzy Decision Trees”,
IEEE Transactions on Systems, Man, and Cybernetics,
Part C: Applications and Reviews, Vol. 35, No. 4,
2005.
J. C. Bezdek, Pattern Recognition with Fuzzy Objective
Functions, New York: Plenum, 1981.
W. Hardle. Applied nonparametric regression, Institut fur
Statistik und Okonometrie Spandauer Str.1,D-10178
Berlin, 1994.R., Lopes, J., 1999.
C-FUZZY DECISION TREES IN DEFAULT PREDICTION OF SMALL ENTERPRISES
97
