
CHANGE OF TOPICS OVER TIME
Tracking Topics by their Change of Meaning
Gerhard Heyer, Florian Holz and Sven Teresniak
NLP Department, Institute of Computer Science, University of Leipzig, Leipzig, Germany
Keywords:
Topic Tracking, Change of Meaning, Conceptual Drift, Volatility, Time-sliced Corpora, Text Mining.
Abstract:
In this paper we present a new approach to the analysis of topics and their dynamics over time. Given a
large amount of news text on a daily basis, we have identified “hotly discussed” concepts by examining the
contextual shift between the time slices. We adopt the volatility measure from econometrics and propose a
new algorithm for frequency-independent detection of topic drift.
1 INTRODUCTION
Large collections of digital diachronic text such as the
New York Times corpus and other newspaper or jour-
nal archives in many ways contain temporal informa-
tion related to events, stories and topics.
1
To detect
the appearance of new topics and tracking the reap-
pearance and evolution of them is the goal of topic de-
tection and tracking (Allan et al., 1998; Allan, 2002).
For a collection of documents, relevant terms need
to be identified and related to a particular time-span,
or known events, and vice versa, time-spans need to
be related to relevant terms. To identify relevant and
new terms in a stream of text (within a predefined pe-
riod of time), three main approaches have been fol-
lowed. (Swan and Allan, 1999; Swan and Allan,
2000; Kumaran and Allan, 2004) measure the rele-
vance of terms using multiple document models and
thresholds based on a tf/idf comparison of text stream
segments. (Kleinberg, 2002) introduces the burstiness
of terms during certain periods of time as an addi-
tional dimension for topic detection, and models the
temporal extension of relevant terms using a weighted
finite state automaton. (Wang and McCallum, 2006)
This research has been funded in part by DFG Focus
Project Nr. 1335 Scalable Visual Analytics
1
(Allan, 2002) understand these terms as follows:
Event – “A reported occurrence at a specific time and place,
and the unavoidable consequences. Specific elections, acci-
dents, crimes, natural disasters.”; Story – “A topically cohe-
sive segment of news that includes two or more declarative
independent clauses about a single event.”; Topic – “A sem-
inal event or activity, plus all derivative (directly related)
facts, events or activities”.
use co-occurrence patterns and their local distribution
in time to detect topics over time. By their approach,
every topic is represented by a co-occurrence set of
terms representative for a certain period of time. As-
suming topics and the terms representing them to be
constant over time, topics can efficiently be related to
times.
However, topics not only depict events in time,
they also mirror an author’s, or society’s, view on the
events described. And this view can change over time.
In language, the relevance of things happening is con-
stantly rated and evaluated. In our view, therefore,
topics represent a conceptualization of events and sto-
ries that is not statically related to a certain period of
time, but can itself change over time. Tracking these
changes of topics over time is highly useful for mon-
itoring changes of public opinion and preferences as
well as tracing historical developments.
In what follows, we shall argue that
1. changing topics can be detected by looking at
their change of meaning,
2. changing topics are interesting, i. e. they generally
represent topics that for some period of time are
“hotly discussed”, or remain fairly “stable”, and
3. tracking the change of topics over time reveals in-
teresting insights into a society’s conceptualiza-
tion of preferences and values.
In addition to term frequency, we consider a term’s
global context (see below) as a second dimension for
analyzing its relevance and temporal extension and ar-
gue that the global context of a term may be taken to
represent its meaning(s). Changes over time in the
223
Heyer G., Holz F. and Teresniak S. (2009).
CHANGE OF TOPICS OVER TIME - Tracking Topics by their Change of Meaning.
In Proceedings of the International Conference on Knowledge Discovery and Information Retrieval, pages 223-228
DOI: 10.5220/0002330602230228
Copyright
c
SciTePress
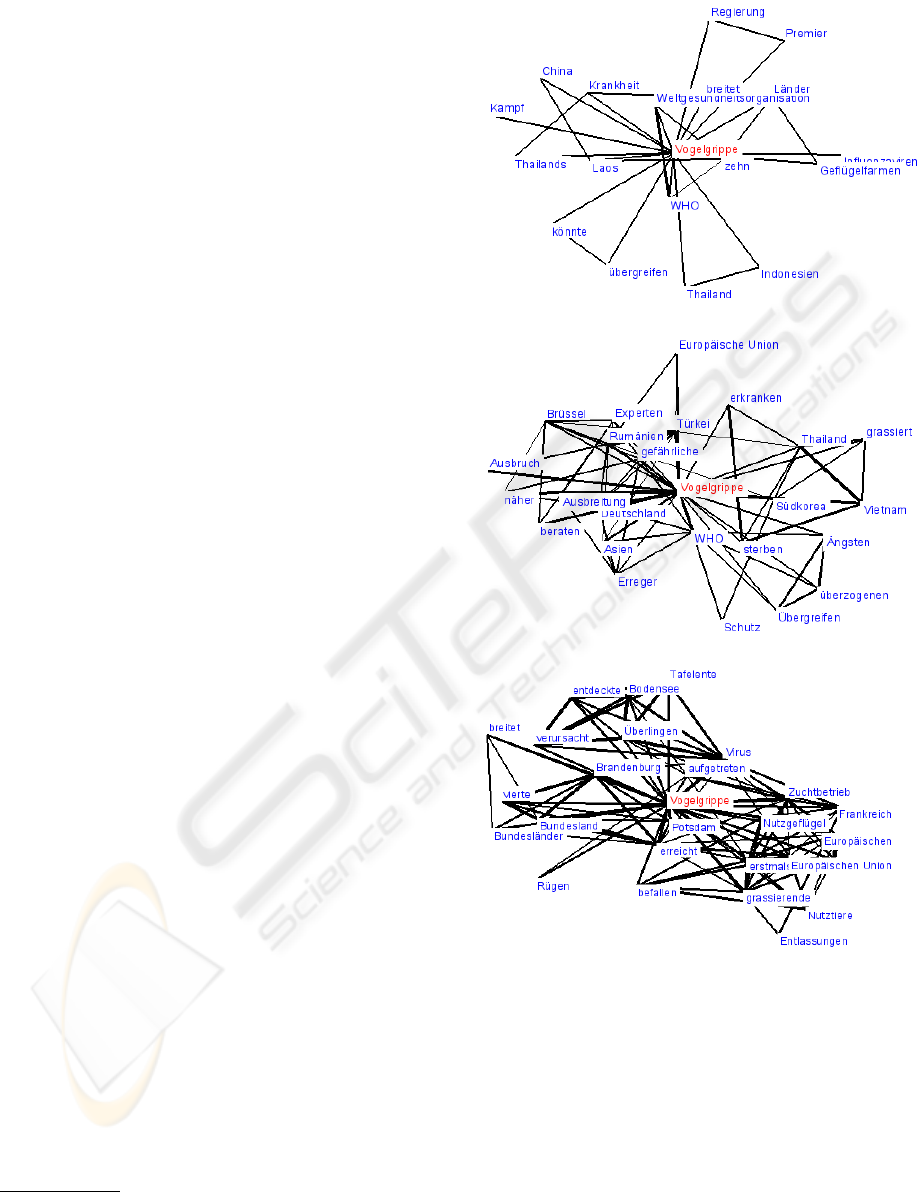
Table 1: The most significant co-occurrences and their sig-
nificance values in global context of “stock”.
market (8740), shares (5145), common (4276), trading
(4244), share (3972), preferred (3677), prices (2186), price
(2127), investors (1810), exchange (1743), Stock (1694),
Exchange (1673), buy (1598), crash (1574), company’s
(1510), dividend (1461), million (1445), yesterday (1440),
its (1400), cash (1290), company (1238), cents (1185),
split (1108), closed (1005), outstanding (954), shareholders
(947), payable (872), convertible (867), bond (835), York
(809), composite (807), holders (802), . . .
global context of a term indicate a change of mean-
ing. The rate of change is indicative of how much
the “opinion stakeholders” agree on the meaning of a
term. Fixing the meaning of a term can thus be com-
pared to fixing the price of a stock. Likewise the ana-
lysis of the volatility of a term’s global contexts can be
employed to detect topics and their change over time.
We first explain the basic notions and assumptions of
our approach and then present first experimental re-
sults.
2 TOPICS, GLOBAL CONTEXT,
AND CHANGE OF MEANING(S)
Following (Heyer et al., 2008), we take a term to
mean the inflected type of a word, where the notion
of a word is taken to mean an equivalence class of in-
flected forms of a base form. Likewise we take the no-
tion of a topic to mean an equivalence class of words
describing an event (as computed by the global con-
text of the topic’s name), and the notion of a concept
to mean an equivalence class of semantically related
words. The global context of a topic’s name is the set
of all its statistically significant co-occurrences within
a corpus. We compute a term’s set of co-occurrences
on the basis of the term’s joint appearance with its
co-occurring terms within a predefined text window
taking an appropriate measure for statistically sig-
nificant co-occurrence. In the experiments carried
out, the Poisson measure for co-occurrences of terms
co-occurring in sentences was used (Quasthoff and
Wolff, 2002). Table 1 exemplifies the global con-
text computed for the term “stock” based on publicly
available English and American newspaper text. The
numbers appearing in parenthesis behind a term in-
dicate its statistical significance.
2
The global context
can also be displayed as a graph which contains the
2
Source: Leipzig Corpora Collection 2009
http://www.corpora.uni-leipzig.de, http://www.corpora.uni-
leipzig.de
(a) Avian flu 2004
(b) Avian flu 2005
(c) Avian flu 2006
Figure 1: The co-occurrance graphs depicts the changes in
context of the term avian flu between (a) 2004, (b) 2005,
and (c) 2006.
term and its context terms as nodes where the edges
have a weight each according to the significance value
of the joint appearance of the terms (cf. Fig. 1).
Figures 1(a)–(c) illustrate the change of co-
occurrences and thus the change of the global context
of the German word “Vogelgrippe” (avian influenza)
based on different corpora of online newspaper texts
between 2004 and 2006.
KDIR 2009 - International Conference on Knowledge Discovery and Information Retrieval
224

As is quite apparent from these graphs, in 2004
the first events of avian influenza in Asia was con-
ceived of as a rather unimportant event from a Ger-
man point of view, more or less only related to China,
Laos and Thailand, only subject to the responsibility
of WHO. While it was already warned in 2004 that
the bird flu virus might move (“knnte”, “bergreifen”)
to Europe as well, it is only in 2006 that this event
is being perceived in Germany as a real threat when
the virus has reached very specific and familiar loca-
tions like Lake Konstanz (“Bodensee”) and the isle of
Rgen. The fears (“ngste”), that in 2005 were still con-
sidered exaggerated (“berzogen”), have become real-
ity in 2006 and resulted in a broad infection of birds
in Germany and in unemployment (“Entlassungen”)
in the meat industry.
The arrival of the avian flu virus in Germany def-
initely is an event worth reporting on. It also repre-
sents an event which forces people to reassess their
perception of bird’s diseases and their relation to hu-
man health. Considering avian flu as one well defined
slice of reality, the example thus illustrates a period of
change and how this change finds expression in lan-
guage.
3 THE APPROACH
The basis of our analysis is a set of time slice cor-
pora. These are corpora belonging to a certain pe-
riod of time, e. g. all newspaper articles of the same
day. The assessment of change of meaning of a term
is done by comparing the term’s global contexts of the
different time slice corpora.
The measure of the change of meaning is volati-
lity. It is derived from the widely used risk measure in
econometrics and finance
3
, and based on the sorting
of the significant co-occurrences in the global context
according to their significance values (see Sect. 2) and
compares the sortings of different time slices. This
is because the change of meaning of a certain term
leads to a change of the usage of this term together
with other terms and therefore to a change of its co-
occurrences and their significance values in the time-
slice-specific global context of the term. The algo-
rithm to obtain the volatility of a certain term is shown
in Fig. 2.
In order to reduce the time complexity of our al-
gorithm, we only take the overall most important co-
occurrences into account. This is done by computing
the global contexts of the terms based on an overall
3
But it is calculated differently and not based on widely
used gain/loss measures. For an overview over miscella-
neous approaches to volatility see (Taylor, 2007).
corpus which is the aggregation of all time slice cor-
pora. Using an overall significance threshold, only the
more significant terms are taken into account during
the comparison of the time-slice-specific global con-
texts. This leads to C
o,t
in Fig. 2.
1. Compute all significant overall co-occurrences C
o,t
for
term t.
2. Compute all significant co-occurrences C
t
i
,t
for every
time slice t
i
for term t.
3. For every co-occurrence term c
o,t, j
∈ C
o,t
compute the
series rank
i
(c
o,t, j
) variing i which represents the ranks
of c
o,t, j
in the different global contexts of t for every
time slice t
i
.
4. Compute the variance of rank series Var(rank
i
(c
o,t, j
))
for every co-occurrence term in c
o,t, j
∈ C
o,t
.
5. Compute the average of the variances to obtain the vo-
latility
Vol(t) = avg
Var
rank
i
(c
o,t, j
)
=
1
|C
o,t
|
∑
j
Var
rank
i
(c
o,t, j
)
.
Figure 2: Computing the volatility.
4 EXPERIMENTS
In what follows, we present results of experiments
that were carried out on the basis of data based on
a German news corpus
4
(WDT) and the New York
Times Annotated Corpus
5
(NYT) with the aim to
show that our method in fact works to detect top-
ics that during some period of time were “hotly dis-
cussed”, also giving an indication of why that has
been so.
The German news corpus Wrter-des-Tages (WDT,
words of the day) covers the period between January
2001 and end of 2008 with altoghether 2,845 daily
slices. Because there are several million types in both
corpora, we decided to compute the volatility only
for a chosen subset of terms for time complexity rea-
sons. Volatility was computed for 18,200 most fre-
quent noun types in the corpus.
6
For every sample
term its volatility over the whole time span was com-
puted using the algorithms sketched in Fig. 2. Fig-
ure 3 visualizes volatility of terms in relation to their
4
http://wortschatz.uni-leipzig.de/http://wortschatz.uni-
leipzig.de/
5
http://www.ldc.upenn.edu/, http://www.ldc.upenn.edu/
6
A candidate term had to occur at least
1
2
14
f
w
1
times in
the corpus where f
w
1
is the frequency of the most frequent
word (“der” in the WDT corpus). The same filtering criteria
applied to the NYT Corpus.
CHANGE OF TOPICS OVER TIME - Tracking Topics by their Change of Meaning
225
0
2
4
6
8
10
12
14
0 5000 10000 15000 20000 25000 30000
Volatility
Rank according to frequency
Volatility
AIG
Karadzic
Moshammer
Hoyzer
Holzmann
Heiligendamm
Mügeln
Auschwitz
Obama
Schaeffler
Volmer
Bombay
Finanzkrise
VW-Aktie
Südossetien
Georgien
Bhutto
Chrome
WamS
Filbinger
Flutkatastrophe
Biden
Betancourt
Kleinfeld
Ike
Rettungspaket
Milchbauern
Jelzin
Birma
Kerviel
Petraeus
Fritzl
Amstetten
Flutwelle
Lehman
Merckle
Mumbai
Flutopfer
Palin
Aceh
HRE
WolfowitzObamas
Molkereien
Qimonda
Kurzarbeit
Kurnaz
Benazir
GDL
Rangun
Pfahls
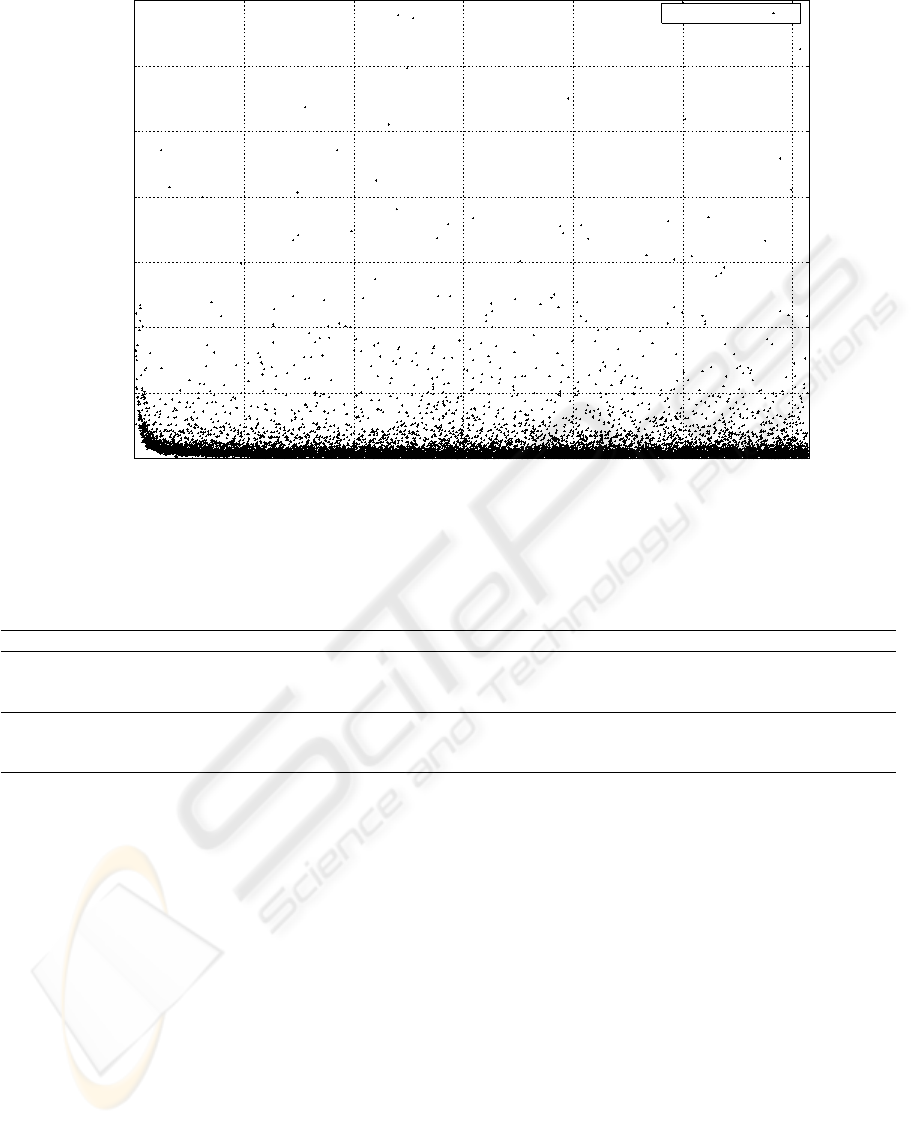
Figure 3: Volatility according to word frequency.
Table 2: Translation and explanation for some German terms with high degree of volatility.
Term Translation Explanation
Finanzkrise financial/banking crisis may be not limited to Germany and German news
GDL Trade union of German
locomotive drivers
About 79% of German locomotive drivers belong to the GDL. In 2007 and
2008 there were much quarrels about the demand of 40% wage increase and
the following strikes.
Moshammer Rudolph Moshammer, a
German fashion designer
Rudolph Moshammer was a German fashion designer and eccentric. He
was regulary present in the yellow press but in connection with his homicide
a new discussion about his formerly unknown sexual orientation arose.
Heiligendamm is a German seaside re-
sort
In 2008 the G8 summit was held there. There were many discussion about
heavy security precautions, different governmental actions illegally restrict-
ing demonstrations and the globalisation.
frequency rank. The dots of the 50 most volatile terms
are labeled with the actual word strings. Quite ob-
viously, volatility can not only be computed for high
frequency terms, but also for low frequency terms (ap-
pearing e. g. only 2,000 times in a corpus of 8 million
types and 1.4 billion tokens).
These 50 highest volatile terms were very well
known in the media during the last years and are eas-
ily assignable to certain developments which gained
high impact and lively public discussion. Unfor-
tunately, similar results for the NYT corpus aren’t
avaible yet, but Tab. 2 provides translations and ex-
planations for some of the German terms. It is ob-
vious that developing terms are rated high regard-
less to their frequency. Highly frequent examples are
e. g. “Obama” (a person) and “Finanzkrise” (finan-
cial crisis), low frequent ones are “Chrome” (google’s
browser) and “Moshammer” (a person).
The second corpus we currently look into is the
The New York Times corpus (NYT) which consists
of 7,475 daily time slices and covers the newspaper’s
complete print edition from 1987 until 2007. For this
corpus, we counted 3.6 million types and 1.2 billion
tokens (≈5.7GB plain text). The sample set of terms
consists of the 27,187 most frequent terms, including
multi word units.
The NYT corpus was used for the second exper-
iment dealing with a time window based volatility.
Analogously to the overall volatility, which subsumed
8 years of news, the volatility of a time span of 30
days was computed which means that the rank series
in Fig. 2 consisted of 30 daily ranks of c
o,t, j
. For ev-
KDIR 2009 - International Conference on Knowledge Discovery and Information Retrieval
226
0
100
200
300
400
500
600
700
800
1987
1988
1989
1990
1991
1992
1993
1994
1995
1996
1997
1998
1999
2000
2001
2002
2003
2004
2005
2006
2007
0
50
100
150
200
250
300
350
400
450
500
Volatility
Frequency
Date (daily time slices)
Frequency
Volatility
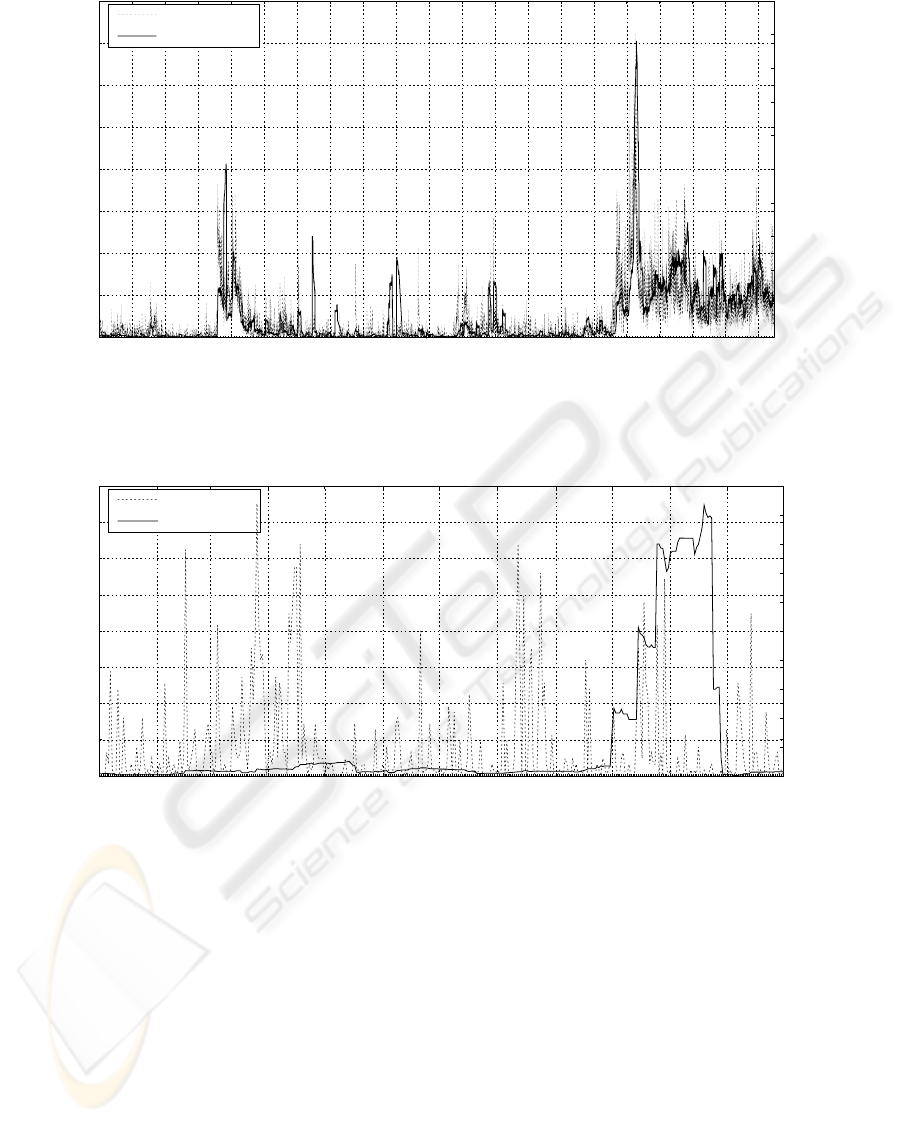
Figure 4: 30-day volatility of “Iraq” from 1987 to 2008 based on the NYT corpus.
0
20
40
60
80
100
120
140
160
January
February
March
April
May
June
July
August
September
October
November
December
0
5
10
15
20
25
30
35
40
45
50
Volatility
Frequency
Date (daily time slices)
Frequency
Volatility
Figure 5: 30-day volatility of “Iraq” in 1995 based on the NYT corpus.
ery day the volatility over the last 30 days was com-
puted. Figure 4 shows the time span volatility and the
30-day-averaged frequency of “Iraq” from 1987 until
2008 based on the NYT corpus.
Clearly outstanding are the peaks according to the
(First) Gulf War and the Iraq War. But there are other
interesting volatility peaks in-between, e. g. in 1995.
Figure 5 indicates that volatility does not correlate
with frequency, but marks the appearance of new as-
pects in public discussion. The usually high fre-
quency of “Iraq” corresponds to the ongoing diplo-
matic and military quarrels. But this constant context
leads to a low volatility. In contrast to this, in the end
of 1995 the New York Times reported about the Iraqi
elections before and after them and the reelection of
Saddam Hussein especially as well as about the hu-
manitarian situation of the people. This new aspect
of discussion does not lead to a higher frequency of
the term “Iraq” at all, while the new context increases
its volatility. Thus the increasing volatility indicates a
shift of topic.
CHANGE OF TOPICS OVER TIME - Tracking Topics by their Change of Meaning
227

5 CONCLUSIONS
In this paper, we have presented a new approach to the
analysis of topics changing over time by considering
changes in the gobal contexts of terms as indicative
of a change of meaning. First results carried out us-
ing data from contemporary news corpora for German
and English indicate the validity of the approach. In
particular, it could be shown that the proposed mea-
sure of a term’s volatility of meaning is highly inde-
pendent from a term’s frequency.
In a next step, the analysis proposed can be ex-
tended to look at individual topics changing over
those time spans identified as interesting. Instead of
only looking at the terms that change their meaning
over time, it might also be of value to look at those
terms that for some time span retain a “stable” mean-
ing, expressing a societie’s unquestioned consensus
on a topic, as it were. In the long run, this approach
might lead to an infrastructure for easily analyzing di-
achronic text corpora with many useful and interest-
ing applications in trend and technology mining, mar-
keting, and E-Humanities.
REFERENCES
Allan, J. (2002). Introduction to topic detection and track-
ing, pages 1–16. Kluwer Academic Publishers, Nor-
well, MA, USA.
Allan, J., Carbonell, J., Doddington, G., Yamron, J., Yang,
Y., Umass, J. A., Cmu, B. A., Cmu, D. B., Cmu, A. B.,
Cmu, R. B., Dragon, I. C., Darpa, G. D., Cmu, A. H.,
Cmu, J. L., Umass, V. L., Cmu, X. L., Dragon, S. L.,
Dragon, P. V. M., Umass, R. P., Cmu, T. P., Umass,
J. P., and Umass, M. S. (1998). Topic detection and
tracking pilot study final report. In In Proceedings of
the DARPA Broadcast News Transcription and Under-
standing Workshop, pages 194–218.
Heyer, G., Quasthoff, U., and Wittig, T. (2008). Text Min-
ing: Wissensrohstoff Text – Konzepte, Algorithmen,
Ergebnisse. W3L-Verlag, 2nd edition.
Kleinberg, J. (2002). Bursty and hierarchical structure in
streams. In KDD ’02: Proceedings of the eighth ACM
SIGKDD international conference on Knowledge dis-
covery and data mining, pages 91–101, New York,
NY, USA. ACM Press.
Kumaran, G. and Allan, J. (2004). Text classification and
named entities for new event detection. In SIGIR ’04:
Proceedings of the 27th annual international ACM SI-
GIR conference on Research and development in in-
formation retrieval, pages 297–304, New York, NY,
USA. ACM.
Quasthoff, U. and Wolff, C. (2002). The poisson col-
locations measure and its application. In Workshop
on Computational Approaches to Collocations, Wien,
Austria.
Swan, R. and Allan, J. (1999). Extracting significant time
varying features from text. In CIKM ’99: Proceedings
of the eighth international conference on Information
and knowledge management, pages 38–45, New York,
NY, USA. ACM.
Swan, R. and Allan, J. (2000). Automatic generation of
overview timelines. In SIGIR ’00: Proceedings of the
23rd annual international ACM SIGIR conference on
Research and development in information retrieval,
pages 49–56, New York, NY, USA. ACM.
Taylor, S. J. (2007). Introduction to asset price dynam-
ics, volatility, and prediction. In Asset Price Dynam-
ics, Volatility, and Prediction, Introductory Chapters.
Princeton University Press.
Wang, X. and McCallum, A. (2006). Topics over time: a
non-markov continuous-time model of topical trends.
In KDD ’06: Proceedings of the 12th ACM SIGKDD
international conference on Knowledge discovery and
data mining, pages 424–433, New York, NY, USA.
ACM.
KDIR 2009 - International Conference on Knowledge Discovery and Information Retrieval
228
