
AUTOMATIC IDENTIFICATION OF DNA MARKERS BASED
ON FEATURES REDUCTION
Carlos M. Travieso
1
, Jordi Solé-Casals
2
, Jesús B. Alonso
1
and Miguel A. Ferrer
1
1
Signals and Communication Department, Technological Centre for Innovation in Communnications, University of Las
Palmas de Gran Canaria, Campus de Tafira, sn, Ed. de Telecomuncación, Pabellón B, Despacho 111, E35017
Las Palmas de Gran Canaria, Spain
2
Digital and Information Technologies Department, Digital Technologies Group, University of Vic
c/ de la Laura, 13, E-08500, Vic, Barcelona, Spain
Keywords: Feature reduction, Principal Component Analysis, Independent Components Analysis, Classification
system, Deoxyribonucleic acid (DNA).
Abstract: This paper has implemented a feature reduction based on Independent Components Analysis (ICA) and
Principal Component Analysis (PCA) for an automatic supervised identification system of Pejibaye palm
DNA markers, using an Artificial Neural Network (ANN) as classifier; obtaining 100% for the classes’
identification. The biochemical parameterization proposed, based on 89 RAPD primer markers applied on
haplotypes of Pejibaye races, has correctly been proved for its reduction. The computational times have
been studied, obtaining results in real time for test mode. Finally the interesting combination of these
techniques (biochemical and computational), gives rise to a formulation of an inexpensive and handy
method of origin denomination plant certification.
1 INTRODUCTION
The study of feature selection or reduction in Pattern
Recognition area is an important field in order to
reduce the system complexity and computational
times. In this present work, we have developed an
automatic identification system applying feature
selection. In particular, a database of Pejibaye palm
DNA markers has been used.
The pejibaye palm belongs to the
monocotyledons, family of the Arecaceae, tribe of
the cocoids, sub tribe Bactridinae and Bactris genus.
(Henderson, 2000) (Mora-Urpí and Arroyo, 1996).
This palm is the only domesticated one of the
neotropic and produce: fruit, wood, and the most
common and know heart-of-palm “palmito” present
on international markets. This palm presents a large
variety of morphology genus and large distribution
over Central and South America. Since last 20th
Century, due to the crop origin controversy, (Mora-
Urpí and Arroyo, 1996) (Clemet et al., 1989) till
now unsolved, mayor concern has been to identify
biologically, domestic races and the research has
been aimed to obtain genetic improvement and
preservation instead of varieties identification. Till
now, there is not known literature on an automatic
Pejibaye identification system. Economically,
because different “landraces” (varieties), promote
more or less one or other product and, in order to
obtain origin denominations, there is an evident
interest to correctly certify each one of different seed
varieties.
For this study we considered six landraces
Pejibaye palms: Utilitis (Costa Rica), Tuira
(Panamá), Putumayo (Colombia), Yurimagua (Perú),
Tembé (Bolivia) and Pará (Brasil). Selected criterion
considered races proponed by Clement and Mora-
Urpi. (Mora-Urpí and Arroyo, 1996) (Porebski et al.,
1997) (Ravishankar et al., 2000) (Clemet et al.,
1989). Such races have enough general
representation on the germ plasma data bank and
were previously characterized by morphological
markers. (Dellaporta et al, 1983.). Original
population considered 191 palms with 18 to 10
individuals per race mean, evaluated with the RAPD
technique.
On this study we have obtained three important
results. First, a validation of RAPDS (Random
347
Travieso C., Solé-Casals J., Alonso J. and Ferrer M. (2010).
AUTOMATIC IDENTIFICATION OF DNA MARKERS BASED ON FEATURES REDUCTION.
In Proceedings of the Third International Conference on Bio-inspired Systems and Signal Processing, pages 347-352
DOI: 10.5220/0002335503470352
Copyright
c
SciTePress
Amplified polymorphic DNA) traces analysis
technique, obtaining an inexpensive straight forward
method to correct pejibaye palm parameterization of
DNA chains, and obtaining similar grouping on
selected landraces than morphological methods.
Second, a substantial reduction of parameters has
been done, and therefore, it have achieved a real
time system response. And finally a 100% correct
identification of each palm variety.
2 PEJIBAYE PALM DATABASE
The germ plasma data bank of the University of
Costa Rica has been stabilized about 30 years ago
and account for more than 1200 different
introductions of Pejibaye palms from Central and
South America, becoming one of the most World
wide completed.
In this present work, we have used a database
composed by 6 classes of Pejibaye (Utilitis - Costa
Rica, Tuira - Panama, Putumayo - Colombia,
Yurimagua - Peru, Tembé - Bolivia and Pará -
Brazil), and each one has 13 samples with 89
RAPDS primer markers per sample. This database
can looks somehow small, but we must know that its
building is very expensive, and for this reason we
must work in these conditions. In the future, with
new funds, we hope to increase the database.
3 DNA PARAMETERIZATION
Deoxyribonucleic acid (DNA) is a long polymer of
nucleotides, with a backbone made of sugars and
phosphate groups joined by ester bonds. Attached to
each sugar is one of four types of bases molecules
and, it is the sequence of these four bases along the
backbone that encodes information. This code is
read by copying stretches of DNA into the related
nucleic acid RNA.
Raw DNA analysis is a very expensive and time
consuming technique but, the interest of such
analysis is based on the fact that it is used on
decision making, handled and preservation of
genetic resources, taxonomy and systematic
molecular studies.
Several techniques have been developed in order
to diminish this description extension. RAPDS trace
analysis (Random Amplified polymorphic DNA) is
one of those finger printing technique based on PCR
(Polymerase Chain Reaction) (Mora-Urpí et al.,
1993) (Dellaporta et al., 1993) (Ferrer et al., 2004)
(Mattos, 1992) (Porebski et al., 1997) (Ravishankar
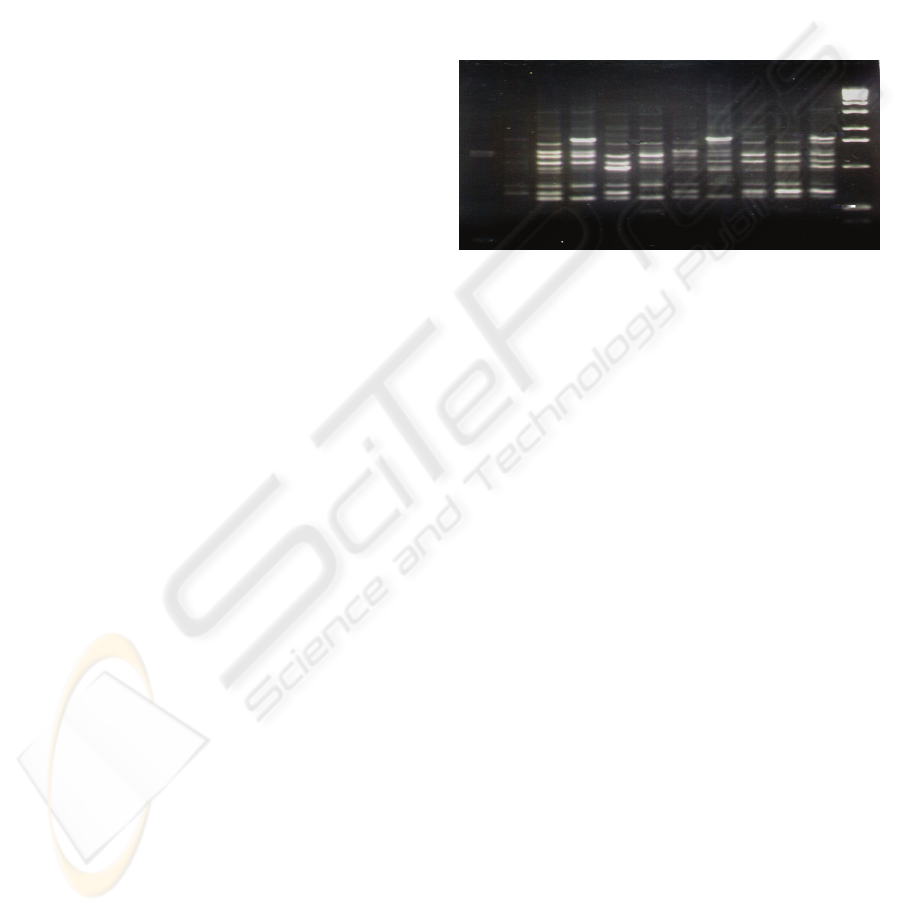
et al., 2000) (Clemet et al., 1989) (see figure 1).
This study was realized over each individual’s
genetic material, with 89 OPC primers (from the
Operon Company) obtaining information variables
with clear and well defined fragments, after
multiples reactions amplifications. That is, for each
individual, an 89 long parameter binary description
vector. That is to say, markers and individuals
produced a binary matrix, indicating enough
presence of a particular RAPDS primer, from the six
different Pejibaye races considered.
Figure 1: Some examples of Utilitis-Tucurrique pejibaye
amplified DNA description, through the application of the
PCR OPC-20 primer, with the RAPDS technique.
4 COMPONENT ANALYSIS
Over the last century, Component Analysis (CA)
methods such as Principal Component Analysis
(PCA), Linear Discriminant Analysis (LDA),
Canonical Correlation Analysis (CCA), Local Linear
Projections (LPP), and Spectral Clustering (SC)
have been extensively used as a feature extraction
step for modeling, classification, visualization, and
clustering. (De la Torre, 2008). CA techniques are
appealing because many can be formulated as eigen-
problems, offering great potential for learning linear
and non-linear representations of data without local
minima. A unified least-squares framework can be
derived to formulate many CA methods. As
explained in (De la Torre, 2008), PCA, LDA, CCA,
LPP, k-means, SC, kernel and regularized
extensions, correspond to a particular instance of
least-squares weighted kernel reduced rank
regression (LS-WKRRR). The LS formulation of
CA has several advantages: (1) allows understanding
the communalities and differences between several
CA methods, as well as the intrinsic relationships,
(2) helps to understand normalization factors, in CA
methods, (3) suggests new optimization strategies,
(4) avoids some problems of existing eigen-methods
for rank deficient matrices (e.g. SSS), (5) allows
many straight-forward extensions of CA methods.
BIOSIGNALS 2010 - International Conference on Bio-inspired Systems and Signal Processing
348

In this first work we will use only two methods,
in order to compare results and try to improve the
success classification rate that we have without any
pre-processing. The fist one is the classical Principal
Component Analysis (PCA) method, as an example
of well known and extensively used method. The
second one is the so called Independent Component
Analysis (ICA) that is a more recent method
introduced in these last years in the framework of
blind source separation problems. (Jutten and
Herault, 1991) (Hyvärinen et al., 2001).
4.1 Principal Component Analysis
(PCA)
Principal Components Analysis (PCA) is a way of
identifying patterns in data, and expressing the data
in such a way as to highlight their similarities and
differences (Jolliffe, 2002). Since patterns in data
can be hard to find in data of high dimension, where
the luxury of graphical representation is not
available, PCA is a powerful tool for analyzing data.
The other main advantage of PCA is that once you
have found these patterns in the data, and you
compress the data, i.e. by reducing the number of
dimensions, without much loss of information.
PCA is an orthogonal linear transformation that
transforms the data to a new coordinate system such
that the greatest variance by any projection of the
data comes to lie on the first coordinate (called the
first principal component), the second greatest
variance on the second coordinate, and so on. PCA
is theoretically the optimum transform for a given
data in least square terms.
In PCA, the basis vectors are obtained by solving
the algebraic eigenvalue problem
(
)
Λ=RXXR
TT
where X is a data matrix whose
columns are centered samples, R is a matrix of
eigenvectors, and
Λ
Γ
is the corresponding
diagonal matrix of eigenvalues. The projection of
data,
XRC
T
nn
= from the original p dimensional
space to a subspace spanned by n principal
eigenvectors is optimal in the mean squared error
sense.
This method is very well known and extensively
used in many different applications for feature
selection and/or dimensionality reduction.
4.2 Independent Component Analysis
(ICA)
ICA can be viewed as a generalization of PCA
procedure, in the sense that instead of obtaining
decorrelated components, here we obtain
independent components that is a harder condition
that decorrelation as uncorrelated variables are only
partly independent.
As explained in (Hyvärinen et al., 2001), ICA is
a very general-purpose statistical technique in which
observed random data are linearly transformed into
components that are maximally independent from
each other, and simultaneously have interesting'
distributions. ICA can be formulated as the
estimation of a latent variable model. The intuitive
notion of maximum non-Gaussianity can be used to
derive different objective functions whose
optimization enables the estimation of the ICA
model. Alternatively, one may use more classical
notions like maximum likelihood estimation or
minimization of mutual information to estimate
ICA; somewhat surprisingly, these approaches are
(approximately) equivalent. ICA has been used for
dimensional reduction and classification
improvement with success (Sanchez-Poblador et al.
2004), and that is the reason for what we are
interested in use this technique in our problem.
In our experiments, even if many different
algorithms exist for obtaining such independent
components, we have used only the Jade algorithm
(Cardoso, 1999), because is a fast algorithm in the
case where few components are extracted, and is
robust. Of course, other algorithms could be used,
but it's not the objective of our work to compare all
the possible algorithms.
5 NEURAL NETWORK
In recent years several classification systems have
been implemented using different techniques, such
as Neural Networks. The widely used Neural
Networks techniques are very well known in pattern
recognition applications.
An Artificial Neural Network (ANN) is an
information processing paradigm that is inspired by
the way biological nervous systems, such as the
brain, process information. The key element of this
paradigm is the novel structure of the information
processing system. It is composed of a large number
of highly interconnected processing elements
(neurones) working in unison to solve specific
problems. ANNs, like people, learn by example. An
ANN is configured for a specific application, such as
pattern recognition or data classification, through a
learning process. Learning in biological systems
involves adjustments to the synaptic connections
that exist between the neurones. This is true of
AUTOMATIC IDENTIFICATION OF DNA MARKERS BASED ON FEATURES REDUCTION
349
ANNs as well.
One of the simplest ANN is the so called
perceptron that consist of a simple layer that
establishes its correspondence with a rule of
discrimination between classes based on the linear
discriminator. However, it is possible to define
discriminations for non-linearly separable classes
using multilayer perceptrons that are networks
without refreshing (feed-forward) and with one or
more layers of nodes between the input layer and the
output layer. These additional layers (the so called
hidden layers) contain hidden neurons or nodes, are
directly connected to the input and output layer
(Bishop, 1995) (Hush and Horne, 1993).
A neural network multilayer perceptron (NN-
MLP) of one hidden layer had been used in this
work. Each neuron is associated with weights and
biases. These weights and biases are set to each
connections of the network and are obtained from
training in order to make their values suitable for the
classification task between the different classes.
In particular and for our experiments, we have
used a Multilayer Perceptron (MLP) Feed-Forward
with Back-Propagation training algorithm with only
one hidden layer of several different neurons
(nodes), obtained empirically in each case. The
number of input neurons fits in with the number of
DNA elements or its reduction, and the number of
output neurons with the number of Pejibaye palms
races.
6 EXPERIMENTS
A supervised identification system has been
developed for comparing three different neural
networks: the first one using all the available
parameters (89 inputs), a second one by using PCA
for dimensionality reduction, and the last one by
using ICA for the same purpose.
Cross-validation method is used to measure the
effectiveness of the system. Training mode is done
with 8% to 53% samples per class from our database
(from 1 to 7 samples/class), and the rest of them
(from 92% - 12 samples/class to 47% - 6
samples/class) are used in the test mode.
Experiments have been repeated 30 times, and
therefore the success rate is shown with mean and
standard deviation.
In order to investigate the effects of all different
parameters involved into the system, many
experiments are done, by adapting the number of
hidden neurons on the NN, the number of selected
features (principal or independent components) and
the number of samples used during the training
process. Keeping in mind that the main objective is
to achieve a 100% of classification success with the
simplest possible system, we show the best results of
the original data (using all the 89 features) in table 1.
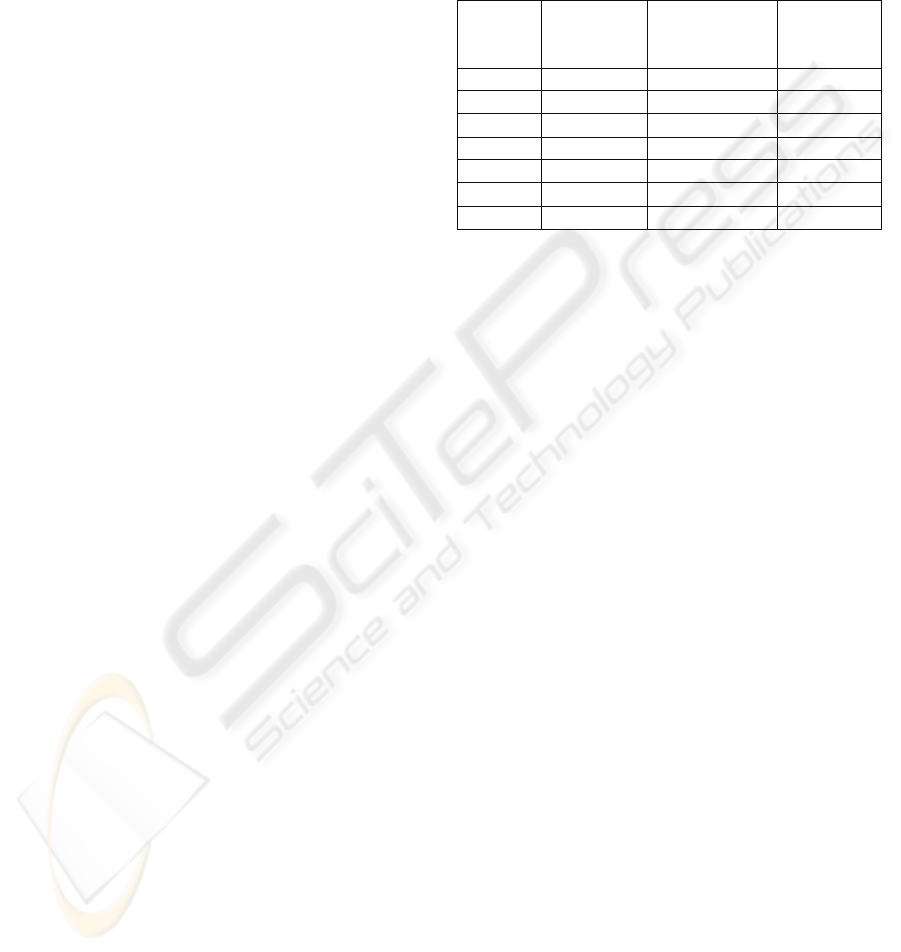
Table 1: Success rates and computational time for original
features.
Training
samples
Number of
hidden
neurons
Success rates
Training
time
1 30 79.30% ± 5.88 219.6 ms
2 20 82.50% ± 7.33 243.1 ms
3 25 89.50% ± 5.76 439. 5 ms
4 20 94.90% ± 5.19 487.2 ms
5 20 97.50% ± 2.67 519.3 ms
6 30 97.97% ± 1.93 627.8 ms
7 20 98.88% ± 1.43 556.0 ms
We can observe here that success rate increases as
the samples per class used in the training phase
increases, starting from 79.30% with one single
sample per class used for training, to 98.88% using 7
samples per class that represents approximately half
of the available samples per class.
Anyway, no 100% of success is achieved in any
case, and as all 89 parameters are used as inputs of
the system, a very complex neural network is
necessary in this case (concerning the number of
hidden neurons, we show the best case tuning this
number from 1 to 180 neurons).
When some method of features' selection is used
(PCA or ICA in our experiments) results are
improved and at the same time the system's
complexity is reduced. We can see experimental
results in tables 2 (using PCA) and 3 (using ICA).
In the PCA case, we can see how using only the
first three principal components, results are very
similar that there obtained with all of 89 features of
the original system. But now, as only 3 components
are used, the complexity of the system is
considerably reduced. By using only two or three
components we can also obtain very interesting
visual representations of the different classes, as we
can see in figure 2, where all different Pejibaye
classes are plotted using the first three PCA
components.
In order to achieve a 100% ± 0 of classification
success, we need 4 principal components and at least
4 samples per class for the training phase. In this
case, as showed in table II, only 20 neurons in the
hidden layer are necessary, similarly as obtained in
table I. Finally, using 5 principal components gives
very good results in the success rates, even if only
one sample per class is used in the training phase
BIOSIGNALS 2010 - International Conference on Bio-inspired Systems and Signal Processing
350
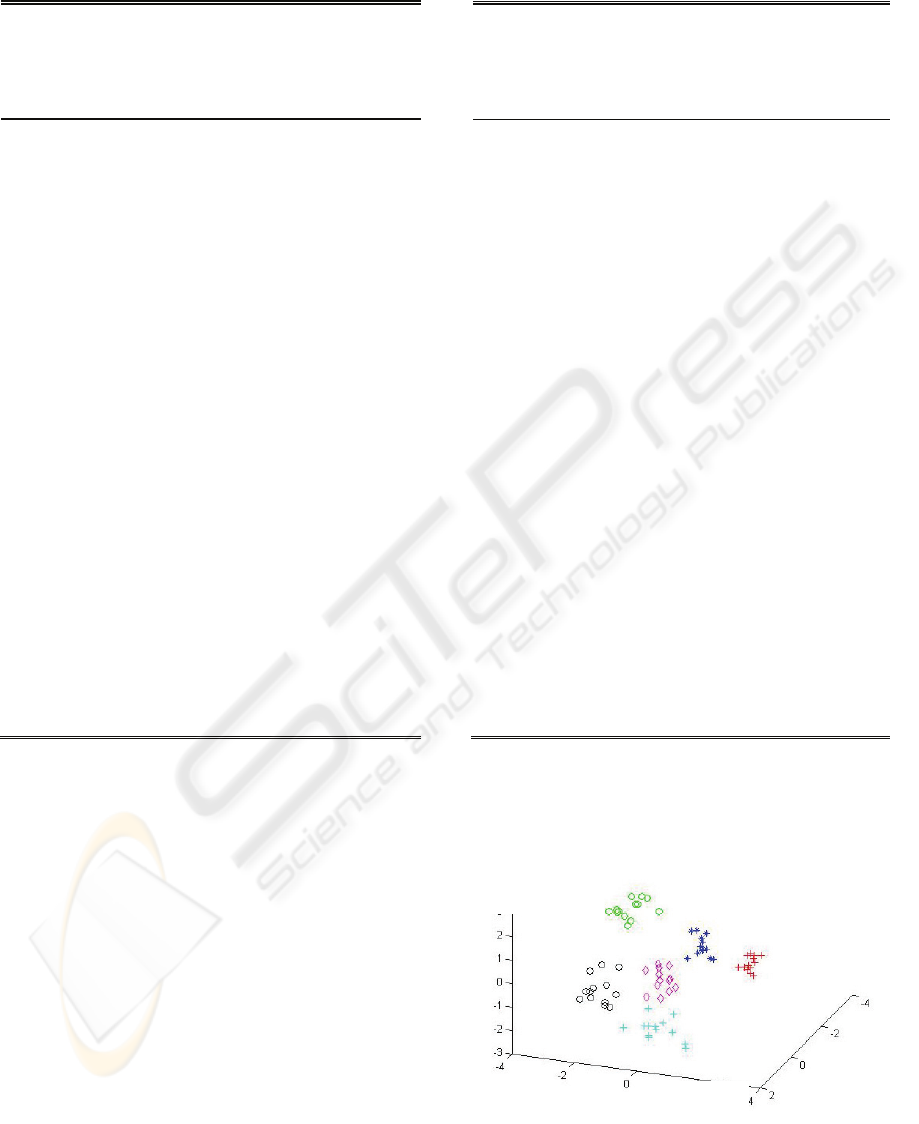
Table 2: Success rates and computational time for features
reduction using PCA.
Number of
components
Trainin
g
samples
Number
of
hidden
neurons
Success rates
Training
time
2 1 120 84.34% ± 5.26 152.8 ms
2 2 120 84.39% ± 5.54 586.5 ms
2 3 105 85.16% ± 5.23 728.3ms
2 4 125 85.92% ± 4.12 789.5 ms
2 5 120 85.77% ± 4.49 962.4 ms
2 6 115 86.23% ± 5.13 1085 ms
2 7 120 86.55% ± 5.06 1226 ms
3 1 120 96.04% ± 3.38 100.7 ms
3 2 95 98.03% ± 2.14 496.4 ms
3 3 100 98.00% ± 2.26 634.2 ms
3 4 120 98.98% ± 1.12 781.0 ms
3 5 100 98.75% ± 1.25 777.4 ms
3 6 25 98.80% ± 1.22 461.3 ms
3 7 115 98.75% ± 1.68 1039 ms
4 1 125 98.54% ± 1.82 75.3 ms
4 2 80 99.3% ± 0.91 335.3 ms
4 3 25 99.58% ± 0.74 414.0 ms
4 4 20 100% ± 0 432.7 ms
4 5 130 99.89% ± 0.46 927.5 ms
4 6 90 100% ± 0 834.6 ms
4 7 90 100% ± 0 879.3 ms
5 1 130 99.16% ± 1.04 50.4 ms
5 2 90 100% ± 0 257.1 ms
5 3 90 100% ± 0 535.7 ms
5 4 30 100% ± 0 461.3 ms
5 5 30 100% ± 0 490.7 ms
5 6 30 100% ± 0 517.2 ms
5 7 30 100% ± 0 540.9 ms
(99.16% of success rate), or more (100% with 2
samples per class or higher).
In the ICA case, results are similar than those
obtained with PCA, but it seems that habitually we
need more neurons in the hidden layer than in PCA
case. For example, the first 100% of success with
ICA is obtained with 4 independent components, 6
training samples per class and 75 neurons in the
hidden layer, since for PCA we use also 4 principal
components but only 4 training samples per class
with 20 neurons in the hidden layer.
On the contrary, when we use 5 components
(features), ICA can give us a 100% ± 0 of success
with fewer neurons than those needed with PCA
especially if 5 or more samples per class are used in
the training phase.
In any case, using selected features with PCA or
ICA we can improve the success rate up to 100% ± 0
for all of the classes, with only (at least) 4 input
Table 3: Success rates and computational time for features
reduction using ICA.
features, and a reasonable number of training
samples and neurons, giving as a result a much more
simple system. In all the cases, we obtain a very low
execution time in test mode, low to 0.1 milliseconds.
Figure 2: 3D representation of Pejibaye palms using three
PCA components. Each one of 6 classes is plotted with a
different symbol and colour.
Number of
components
Trai
ning
samp
les
Number
of hidden
neurons
Success rates
Training
time
2 1 215 81.75% ± 7.50 268.1 ms
2 2 15 83.79% ± 5.90 341.4 ms
2 3 25 86.25% ± 5.37 418.3 ms
2 4 20 86.29% ± 5.36 425.9 ms
2 5 75 87.39% ± 3.79 590.2ms
2 6 110 88.09% ± 4.52 995.2 ms
2 7 130 89.36% ± 6.40 1088 ms
3 1 205 97.08% ± 2.51 127.3 ms
3 2 20 97.47% ± 2.30 397.4 ms
3 3 25 97.67% ± 2.21 432.8 ms
3 4 45 97.90% ± 1.66 510.6 ms
3 5 125 98.8% ± 1.55 912.2 ms
3 6 45 98.89% ± 1.62 575.8 ms
3 7 25 99.16% ± 1.29 504.4 ms
4 1 115 99.51% ± 1.12 86.0 ms
4 2 65 99.54% ± 1.21 412.6 ms
4 3 75 99.58% ± 0.74 578.3 ms
4 4 105 99.81% ± 0.82 711.2 ms
4 5 105 99.89% ± 0.46 792.8 ms
4 6 75 100% ± 0 740.5 ms
4 7 25 100% ± 0 505.0 ms
5 1 25 99.58% ± 0.78 64.3 ms
5 2 105 99.92% ± 0.33 322.7 ms
5 3 110 100% ± 0 647.1 ms
5 4 65 100% ± 0 628.2 ms
5 5 25 100% ± 0 484.3 ms
5 6 25 100% ± 0 489.7ms
5 7 25 100% ± 0 511.5 ms
PCA 1
PCA 3
PCA 2
AUTOMATIC IDENTIFICATION OF DNA MARKERS BASED ON FEATURES REDUCTION
351

7 CONCLUSIONS
In this paper, we present a robust well performing
system and innovative parameterization for
automatic supervised identification of Pejibaye palm
RAPD markers, using a NN-MLP as classifier,
obtaining a success rate of 100%.
We have verified that the use of that classifier
offers better guaranties with the reduction feature
and good load times for training mode. Besides, this
work presents a great advantage, because in all
experiments for test mode, it is considered a real
time application (> 0.1 millisecond).
ACKNOWLEDGEMENTS
This work has been in part supported by “Programa
José Castillejo 2008” from Spanish Government
under the grant JC2008-00398; by the University of
Vic under de grant R0904; by private funds from
Spanish Company Telefónica, under “Cátedra
Teléfonica-ULPGC 2009”; and by funds from
Research Action from Excellent Networks on
Biomedicine and Environment belonging to
ULPGC.
REFERENCES
Henderson, A., 2000. Bactris (Palmae). Flora Neotropica
Monograph 79, pp: 1-181.
Mora-Urpí, J., Arroyo. C., 1996, Sobre origen y diversidad
en pejibaye. Serie Técnica Pejibaye (Guilielma).
Boletín Informativo. Editorial de la Universidad de
Costa Rica. 5(1): 18-25.
Mora-Urpí, J., Clement C. and Patiño. V., 1993.
Diversidad Genética en Pejibaye: I. Razas e Híbridos.
IV Congreso Internacional sobre Biología, Agronomía
e Industrialización del Pijuayo. Universidad de Costa
Rica. p. 11-20.
Dellaporta, S.L., Wood, J., Hick, J.B., 1983. Plant DNA
minipreparation. Version II: Plant Mol. Biol. Rep. 1,
pp 19-21.
Ferrer, M., Eguiarte, L.E., Montana, C., 2004. Genetic
structure and outcrossing rates in Flourensia cernua
(Asteraceae) growing at different densities in the
South-western Chihuahuan Desert. Annals of Botany
94, pp 419–426.
Mattos, L., 1992. Diferenciación Taxonómica de Diez
Razas de Pejibaye Cultivado (Bactris(Guilielma)
Gasipaes Kunth) y su relación con otras Especies de
Bactris. Magister Scientiae, Universidad de Costa
Rica. pp 197.
Porebski, S., Grant, L., Baun, B., 1997. Modification of a
CTAB DNA extraction protocol for plants containing
high polysaccharide and polyphenol components.
Plant Molecular Biology Reporter 15, pp: 8-15.
Ravishankar, K. V., Anand, L., Dinesh M.R., 2000.
Assessment of genetic relatedness among mango
cultivars of India using RAPD markers. Journal of
Horticultural Sci. & Biotechnology, 75, pp 198-201.
Clement, C.R., Aguiar, J., Arkcoll, D.B., Firmino, J.,
Leandro, R., 1989. Pupunha brava (Bactris
dahlgreniana Glassman): progenitora da pupunha
(Bactris gasipaes H.B.K.). Boletim do Museu
Paraense Emilio Goeldi, Botánica, 5(1) pp 39-55.
De la Torre, F., 2008. A Least-Squares Unified View of
PCA, LDA, CCA and Spectral Graph Methods. Tech.
report CMU-RI-TR-08-29, Robotics Institute,
Carnegie Mellon University, May.
Jutten, C. Herault, J., 1991. Blind separation of sources,
Part 1: an adaptive algorithm based on neuromimetic
architecture”, Signal Processing (Elsevier), Vol. 24 ,
Issue 1.
Hyvärinen, A., Karhunen, J., Oja, E., Independent
Component Analysis, New York, USA: John Wiley &
Sons, 2001
Jolliffe I.T. 2002. Principal Component Analysis, Series:
Springer Series in Statistics, 2nd ed., Springer, NY.
Sanchez-Poblador, V. Monte Moreno, E., Solé-Casals, J.,
2004. ICA as a preprocessing technique for
Classification, ICA 2004, Granada, Spain,. Lecture
Notes in Computer Science, Springer-Verlag Volume
3195/2004.
Cardoso, J. F., 1999. High-Order Contrasts for
Independent Component Analysis, Neural
Computation, 11(1):157--192,
Bishop, C.M., 1995. Neural Networks for Pattern
Recognition,
Oxford University Press.
Hush, D.R., Horne, B.G., 1993. Progress in supervised
neural networks”, IEEE Signal Processing Magazine,
10 (1), pp. 8-39.
BIOSIGNALS 2010 - International Conference on Bio-inspired Systems and Signal Processing
352
