
ENHANCED METHOD FOR ROBUST MOOD EXTRACTION
FROM SKIN CONDUCTANCE
Gert-Jan de Vries and Marjolein D. van der Zwaag
Philips Research Europe, High Tech Campus 34, NL-5656 AE Eindhoven, The Netherlands
Keywords: Affective computing, Mood, Skin conductance, Algorithm, Parametric model.
Abstract: One of the key challenges in affective computing is the interpretation of physiological signals into affect.
Mood, as a subclass of affect, is known to be reflected in skin conductance. While most reports concern
strictly controlled laboratory settings, daily life situations pose more challenges in interpreting physiology
because more bodily and cognitive processes that influence skin conductivity are involved; for example
temperature regulation or physical and mental activity. Existing techniques to reduce the effects of these
processes in order to extract mood from skin conductance are rather crude and leave room for improvement.
We introduce a more sophisticated method based on skin conductance response subtraction that provides
better resemblance with mood. Validation of our method, using comparison with two alternative methods,
shows our method excels in differentiation between positive and negative moods from skin conductance.
Our method thereby enhances mood extraction from skin conductance, thus improving robustness of mood
measurements.
1 INTRODUCTION
The role of technologies in our daily life is changing
rapidly. It is expected that technologies more and
more help us to balance our mind and body state as
well. The importance of our mood is also
increasingly recognized namely, being in a positive
mood has the advantage to increase, among others,
optimistic feelings to dominate our cognitive
flexibility, problem solving capabilities (Lewis &
Haviland-Jones, 2000), as well as our health and
longevity (Salovey et al., 2000; Pressman & Cohen,
2005). Therefore it will not take very long before
technologies that measure and that react to the
affective state of the user will appear, e.g., a music
player that plays music that suits or directs the mood
state of the user (Janssen et al., 2009; Schroeder et
al., 2008).
Mood is seen as our baseline body state, it is a
tonic state which varies over minutes to days
(Thayer, 1996). Changes in mood are accompanied
by changes in our skeletal-muscular system
(Cacioppo, 2000) as well as in our autonomic
nervous system (ANS), reflected in e.g., skin
conductance (SC; Van der Zwaag & Westerink,
2009). The use of SC in applications is promising
because it can be unobtrusively and easily
implemented in our daily life habits (Westerink et
al., 2009).
SC is, besides mood, also affected by several
other influences, among which physical and mental
activity, environmental temperature, and emotions.
In this paper we present a method to reduce the
influence of these changes in SC that are other than
mood, in order to obtain a signal that better reflects
mood. This method is based on the fact that changes
in mood are gradual and tonic, whereas the other
aspects mentioned that influence SC have a phasic
character; they are short and intense. In sum, our
method is designed to remove the phasic effects in
order to obtain a more resembling mood signal.
In mood research the ground truth available
consists of subjective reports or effects hypothesized
by the researcher. In order to quantify the success of
the mood extraction method that will be proposed in
this paper, we have chosen for a validation with
hypothesized effects, which have been verified with
subjective reports.
The remainder of this paper starts with a
description of the physiological signals in section 2,
followed by a detailed description of the method in
section 3. Section 4 describes the validation of our
method and we end with a conclusion.
139
de Vries G. and van der Zwaag M. (2010).
ENHANCED METHOD FOR ROBUST MOOD EXTRACTION FROM SKIN CONDUCTANCE.
In Proceedings of the Third International Conference on Bio-inspired Systems and Signal Processing, pages 139-144
DOI: 10.5220/0002588501390144
Copyright
c
SciTePress
2 SIGNAL EXPLORATION
The skin conductance signal roughly contains two
types of information (Dawson et al., 2000; Boucsein,
1992). The tonic SC, usually referred to as Skin
Conductance Level (SCL), shows gradual changes
over time. Phasic SC manifests as high(er)
frequency components superimposed on the tonic
level. These phasic SC components, known as Skin
Conductance Responses (SCRs), have a typical form
as schematically depicted in Figure 1: After a
latency period (of approximately 2 seconds after
observation of a stimulus), the signal rises relatively
quickly, reaches a local maximum and then slowly
declines again.
Figure 1: Graphical representation of a typical skin
conductance response, taken from Dawson et al. (2000).
Most SCRs have a clear cause of their origin
(Boucsein, 1992; Dawson, 2000), which can vary
from an emotional event, physical activity or an
internal thought. Moods, our psychological construct
of interest, however, are long lasting affective states
with no clear cause of their origin (Thayer, 1986); it
is a tonic phenomenon like the skin conductance
level SCL (apart from the SCRs). We therefore
hypothesized, that removing SCRs from the SC
signal would result in a SCL signal reflecting mood
more precisely.
Although SCRs are well defined from onset to
the moment of half recovery, their effect on a longer
time span can be quite undeterministic: SCRs often
decline until the onset level is reached, however they
sometimes build on top of each other (humped
SCRs) or the SC level does not decline to the onset
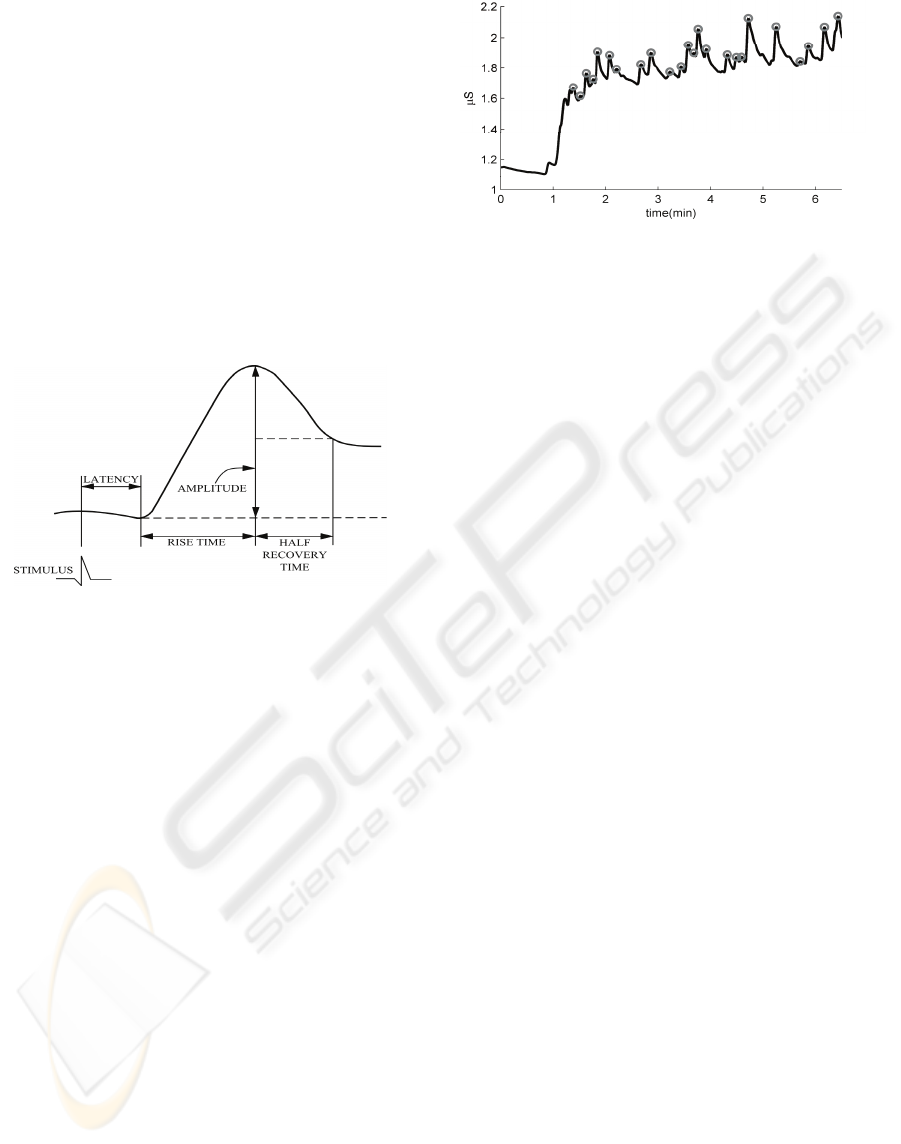
level (i.e., there is a change in tonic level). Figure 2
shows an example trace of SC data in which the
circles indicate the maxima of detected SCRs. The
figure, for example, shows SCRs that decay to their
onset level (e.g., around t=5), thereby only causing a
phasic change; having no effect on the tonic level, as
well as SCRs that cause a change in tonic level (e.g.,
the humped SCR with onset around t=1).
Figure 2: Example trace of SC data. The marks indicate
the maxima of detected SCRs.
In this paper, we hypothesize the possibility to
estimate the full phasic influence of an SCR by
suitably extrapolating the well defined part of the
SCR (from onset to half recovery time). All effects
that remain after subtracting the SCRs from the
signal (i.e., subtraction of the difference between the
SCR and the SCR onset level), can then be
considered as effects on the tonic level.
It should be clear that for this assumption the
robust detection of SCRs is a necessity. Over time,
multiple analysis techniques have been developed to
extract the individual SCRs from an SC signal. A
very basic technique compares the SC signal with a
static threshold, after detrenting the signal, and fire
in case of exceeding the threshold. More
sophisticated methods, as the SCRGauge algorithm
(Kohlisch, 1992), search for local maxima and use
the notion of maximal curvature to find the onset of
SCRs. The half recovery time value is searched for,
and if not present, extrapolated.
3 ALGORITHM DESCRIPTION
Our method of processing the SC signal consists of
three steps. 1) Each SCR needs to be detected, 2) for
each SCR a model is fitted and 3) this model is
subtracted from the original SC signal. The next
three subsections describe these steps in more detail.
3.1 SCR Detection
The first step of the algorithm is to determine the
individual Skin Conductance Responses (SCRs)
reliably. For this we employ the SCRGauge method
on top of which we build an extra layer that handles
well those cases that SCRGauge indicates as
doubtfully detected. In this extra layer, the half
recovery time is extracted more reliably by linear
extrapolation from the first occurring bending point
(i.e., zero crossing of the second derivative) after the
BIOSIGNALS 2010 - International Conference on Bio-inspired Systems and Signal Processing
140
top of the SCR (in other words, use the tangent at
the point of maximal decline). SCRGauge uses the
same technique, however it extrapolates from the
last bending point occurring before the signal rises
again after the top of the SCR.
Besides that, the extra layer contains an
improved indication of humped SCRs, i.e., SCRs
that happen that soon after one another that they
stack on top of each other, as can be seen in Figure 2
at t=1. We choose to combine the SCRs that have
time wise overlap (considering rise time and half
recovery time) and treat these humped SCRs as
single large SCRs, by using the first onset, the
maximal top and re-estimation of the half recovery
time.
3.2 SCR Modelling
For each of the SCRs detected, a parameterized
model is optimally fitted. This parameterized model
should be a mathematical function that represents
the shape of a typical SCR well. We used the
sigmoid-exponential four-parameter SCR model as
proposed by Lim et al. (1997):
0
exp
⁄
1
(1)
where the model of the i-th SCR (
) is
characterized by four parameters: the onset time
,
gain (related but not identical to the SCR
amplitude), and rise time and decay time constants
and
, respectively.
The optimal fit of the parameters can be
determined by an error minimizing method, as for
example minimization of the sum of squared error
(also known as the method of least squares). This
method minimizes the difference between the
observed data (
) and the model (
):
argmin
,
,,
(2)
where
is the time of onset of the -th SCR and
specifies the length of the window that is taken into
account for the comparison. To optimally fit the
SCR, this length is defined dynamically to fit the
SCR from onset to half recovery point, i.e., the
window has a length equal to the sum of the rise
time and the half recovery time (see Figure 1). In the
cases that the half recovery time is extrapolated
(during the extraction phase) the extrapolated signal
can be used up to the half recovery time for
determining the optimal fit.
There are several methods to solve the least
squares problem, or more general, solve
optimization problems; Lim et al. (1997) use the
Marquardt-Levenberg method, we chose to use the
Nelder-Mead Simplex Method (Lagarias et al.,
1998), which is less susceptible for local minima
(Miller, 2000). These optimization algorithms aim at
finding an optimal set of (model) parameters such
that a given measure is optimized (i.e., minimized or
equivalently maximized), given an initial parameter
setting. The averages found by Lim et al. proved to
be sufficient as initialization of the parametric
model.
3.3 Subtraction of SCRs
The parametric models (
) are used to subtract the
SCRs from the SC signal () according to:
(3)
For practical reasons, the modelled SCRs are
taken into account from the onset time
, see
equation (1), up to where their contribution is
negligible. In only few occasions the optimization
did not lead to a good fit of the model, characterized
by a major overestimation of the tails of the SCRs.
These cases are recognized by extraordinary
parameter values and treated with extra care, i.e., the
signal after subtraction is limited by the original SC
signal, thereby ensuring the signal does not decay
below the SCR onset value (for the duration of the
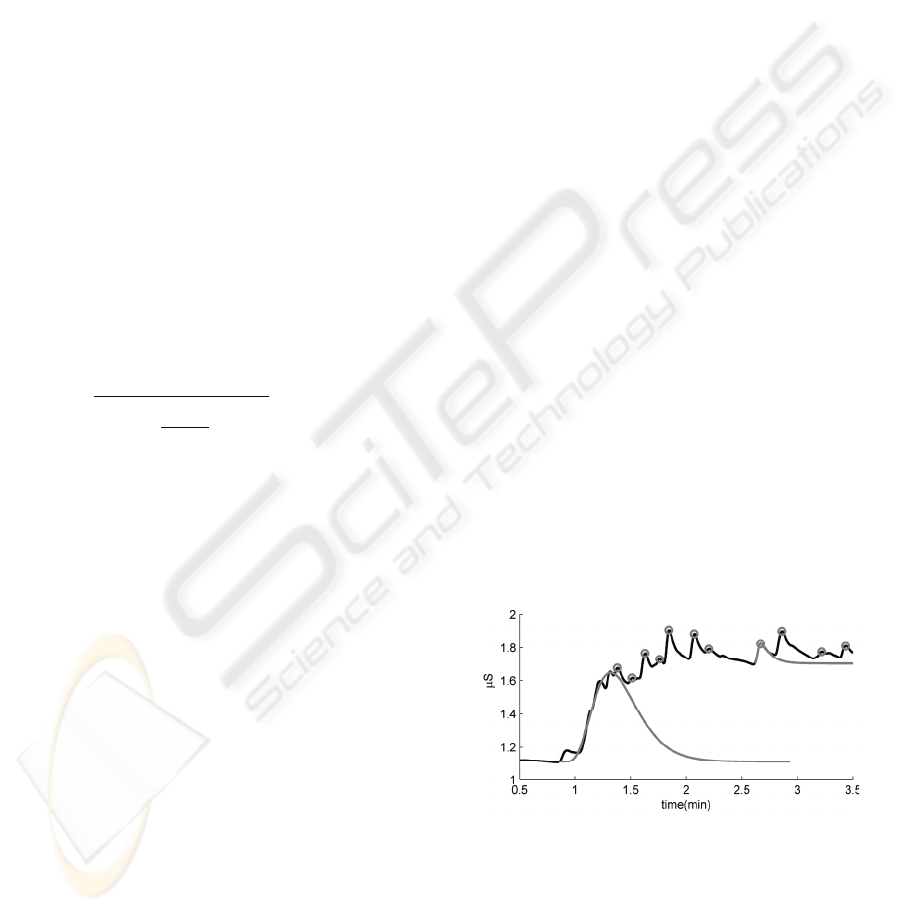
SCR). Figure 3 shows an example trace of SC signal
with projections of the modelled SCRs.
Figure 3: Overlay of two modelled SCRs (grey) on the
original SC signal (black) for a ‘simple’ SCR (right) and
humped SCR (left).
Figure 4 shows the residual signal after
subtraction of the modelled SCRs as the dark grey
line close to the black line. It can be seen that high
frequency noise is introduced in the residual signal
ENHANCED METHOD FOR ROBUST MOOD EXTRACTION FROM SKIN CONDUCTANCE
141

Figure 4: Overview of the original signal (light grey), and the residual signal before (dark grey) and after (black) filtering.
because of local misfits of the SCR models. We applied a
small low-pass filter, 8 second moving average, afterwards
in order to smooth the residual signal as displayed in
Figure 4.
In the following, we will refer to the complete
algorithm as SCR subtraction, whereas this sub-step
of removing the SCRs will be referred to as
subtraction of SCRs.
3.4 Alternative Techniques
In mood research alternative techniques have been
applied also with the aim of obtaining a better mood
signal from SC. To our knowledge, these alternative
methods include (strict) low-pass filtering and
interpolation of SCR onsets (Lykken & Venables,
1971).
Figure 5 shows an overview of their effects on an
example trace of SC data.
We implemented the first method using a
moving average filter with relatively large windows
of 50 and 100 seconds. This method has as
advantage that it does not rely on the detection of
individual SCRs. It however has a strong tendency
to overshoot the original signal.
The latter method highly depends on the correct
detection of SCRs and moreover, the correct
detection of humped SCRs. As can be seen in
Figure
5, especially the presence of small SCRs
(close to larger SCRs) causes this method to
relatively closely resemble the original SC signal.
3.5 Complexity
The methods mentioned above, can roughly be
divided into two groups: those that rely on SCR
detection and those that do not. The low-pass
filtering methods fall into the last category and are
clearly of linear complexity; each sample needs to
be multiplied with a constant number of filter
coefficients.
When SCR detection is involved, the complexity
of the method depends on the algorithm used for
SCR detection. SCRGauge uses searching strategies
which can, in worst case scenario’s, result in
quadratic complexity (i.e., the number of
comparisons per sample can be in the order of the
total number of samples). In our implementation we,
however, bounded the number of search steps by a
constant maximum, thereby ensuring linear
complexity of the SCR detection (note that the
maximum number of steps is rarely reached in
practice). Our method also incorporates SCR
modelling, which uses an optimization algorithm.
Also here, the number of iterations is bounded by a
constant, therefore the complexity is in the order of
the number of data samples taken into account for
the model (e.g., comparable to in equation (2)),
which we also bounded by a constant. Finally the
subtraction of SCRs is also linear in the number of
data samples.
In summary, all methods are of linear
complexity. Where low pass filtering is least
computational complex, our SCR subtraction
algorithm requires more calculation steps. The time
needed, on a standard working station, however, is
still small enough to allow real time application.
With little effort on a more efficient implementation,
it should also run on, e.g., a mobile phone or pda.
4 VA L I D AT I O N
In order to validate the proposed method, we applied
it to a dataset containing SC signals (van der Zwaag
& Westerink, 2009). SC was recorded during two
sessions where a positive or a negative mood was
induced in 37 participants using music. Each session
started with a habituation period of eight minutes in
which the participants could relax, after which the
participants were asked to pay attention to eight
minutes of music presentation. To verify the state of
BIOSIGNALS 2010 - International Conference on Bio-inspired Systems and Signal Processing
142

Figure 5: Comparison of (alternative) techniques, showing, from top to bottom, a) the original SC signal, b) interpolation of
SCR onsets, low pass filtering (moving average), using a window of c) 50 and d) 100 seconds, and e) our method: SCR
subtraction. In order to improve visibility, the latter four have been offset with -1 to -4 μS, respectively.
the participants, the UMACL mood inventory was
presented after the habituation period and the mood
induction (Matthews, 1990). Results show that the
two moods were successfully induced. See Van der
Zwaag & Westerink (2009) for detailed information
on the design of the experiment and the data
gathering.
We applied our SCR subtraction method as well
as two alternative processing methods on the
available dataset; the processed signal will be
referred to as skin conductance level (SCL) and the
three methods applied will be referred to as: Plain
SC, Low-pass filtering, and SCR subtraction.
Successively, the means (in analogy to SCL-
mean) were calculated for each minute of the
habituation phase and the mood induction period. To
compensate for individual differences in SCL, the
features , derived from SCL, were normalized for
each participant per session using z-transformations:
(4)
where feature instance
is transformed using
the mean
and standard deviation
taken over
the third till fifth minute of the habituation period,
thereby serving as baseline period. Thereafter a
repeated-measures ANOVA with the mood (positive
/ negative) and time (minute 1 till minute 8) was
conducted on the data obtained from each method.
Results solely show a main effect for mood for SCR
subtraction; meaning that positive and negative
moods can be distinguished in SCL in this method
only (Plain SC: F(1,34)=1.14, p=.294, η
2
=.032;
Low-pass filtering: F(1,34)=3.01, p=.092, η
2
=.081;
SCR subtraction: F(1,34)=5.69, p=.023, η
2
=.143).
Post-hoc analyzes of our SCR subtraction method
show that the positive and negative moods can be
differentiated from the fourth minute of mood
induction onwards.
As can be seen in Figure 6, the SCR subtraction
method provides the smallest error bars of the three
methods, indicating that the data is more consistent
over participants. The effect sizes (η
2
) are
additionally larger in the SCR subtraction data then
in the data of the other methods; implying the
strength of the relation between mood and SCL is
larger in the SCR subtraction method. The mood
with time interaction in the SCR subtraction data
show that the relation between mood and SCL
increases over time (from η
2
=.008 in the first minute
to η
2
=.361 in the eighth minute).
Please note that we did not apply any participant
or data removal criterion, including outlier removal.
Together with the large difference between positive
and negative mood the SCR subtraction method
shows (in Figure 6), this indicates that the inter-
personal noise has been reduced significantly,
implying that our method is robust to inter-personal
differences in physiology.
To summarize, we can conclude that the SCR
subtraction method is the only method where
positive and negative moods can be fully
discriminated from the SC. Treated with this
method, the SC signal represents mood best and is
more accurate than the Plain SC and the Low-pass
filtering method.
a
b
c
d
e
ENHANCED METHOD FOR ROBUST MOOD EXTRACTION FROM SKIN CONDUCTANCE
143

Figure 6: The three figures show the differentiation between moods by mean SCL (in normalized units (n.u.)) for the three
methods discussed. The time in minutes during the mood induction is presented on the horizontal axis. The dotted
(continuous) lines indicate the positive (negative) mood condition. Error bars indicate the standard error.
5 CONCLUSIONS
We propose a method to adjust the skin conductance
signal in order to better reflect mood. It is based on
the observation that SCRs, which frequently occur
on top of the tonic SCL, correspond to event type
stimuli that are not related to mood. The SCR
subtraction method removes these phasic influences
from the SC signal by subtracting the SCRs from the
SC so that an estimate of the pure SCL signal
remains. We validate the SCR subtraction method
with SC data taken in a mood induction experiment.
The results show that the SCR subtraction method
outperforms the alternative SCL estimations. In fact,
the SCR subtraction technique is the only method
resulting in significant differences between the
positive and negative moods.
Using the method we present, skin conductance
can serve as a robust indicator for positive versus
negative mood. Whenever someone’s mood can be
measured, steering one’s mood, or creating
awareness of one’s mood, is only one step away. As
mentioned in the introduction, the range of possible
applications is very broad, including systems that
help in making us feel better, and healthier.
REFERENCES
Boucsein, W., 1992. Electrodermal Activity, The Springer
Series in Behavioral Psychophysiology and Medicine.
Springer.
Cacioppo, J., Tassinary, L., Berntson, G., 2000. Handbook
of psychophysiology. Cambridge University press:
Cambridge.
Dawson, M. E., Schell, A. M., Filion, L., 2000. The
electrodermal system, chapter 8 from Handbook of
Psychophysiology, Cambridge University Press, 2
nd
edition.
Janssen, J. H., van den Broek, E. L., Westerink, J. H. D.
M., 2009. Personalized affective music selection.
Proceedings of the ACII 2009 conference, Amsterdam,
The Netherlands.
Kohlisch, P., 1992, SRCGAUGE - A Computer Program
for the Detection and Quantification of SCRs. In
Electrodermal Activity, Boucsein, W. ed., New York:
Plenum:432-442.
Lagarias, J. C., Reeds, J. A., Wright, M. H., Wright, P. E.,
1998. Convergence Properties of the Nelder-Mead
Simplex Method in Low Dimensions, SIAM Journal
of Optimization, 9(1):112-147.
Lewis, M., & Haviland-Jones, J.M.H., 2000. In handbook
of emotions (Second ed.). New York: Guilford press.
Lim, C. L., Rennie, C., Barry, R. J., Bahramali, H.,
Lazzaro, I., Manor, B., and Gordon, E., 1997.
Decomposing skin conductance into tonic and phasic
components. International Journal of
Psychophysiology, 25(2):97-109.
Lykken, D. T., Venables, P. H., 1971. Direct measurement
of skin conductance: a proposal for standardization.
Psychophysiology, 8(5):656-672.
Matthews, G., Jones, D. M., & Chamberlain, A., 1990.
Refining the measurement of mood: the UWIST mood
adjective checklist. The British Journal of Psychology,
81:17-42.
Miller, R. E., 2000. Optimization: foundations and
applications, Wiley-IEEE.
Pressman, S. D. and Cohen, S., 2005. Does positive affect
influence health? Psychological Bulletin, 131(6):925-
971.
Salovey, P., Rothman, A. J., Detweiler, J. B., Steward, W.
T., 2000. Emotional states and physical health.
American Psychologist, 55(1):110-121.
Schroeder, A., Van der Zwaag, M. D., Hammer, M., 2008.
A Middleware Architecture for Human-Centered
Pervasive Adaptive Applications, 1st PerAda
Workshop at SASO 2008, 21. Oct. 2008, Venice, Italy.
Thayer, R., 1996. The origin of everyday moods. New
York: Oxford University press.
Westerink, J., Ouwerkerk, M., De Vries, G-J. , De Waele,
S., Van den Eerenbeemd J., Van Boven, M., 2009.
Emotion measurement platform for daily life
situations, Proceedings of the ACII 2009 conference,
Amsterdam, The Netherlands.
Van der Zwaag, M. D., Westerink, J. H. D. M., 2009.
Physiological differentiation between moods,
(submitted).
BIOSIGNALS 2010 - International Conference on Bio-inspired Systems and Signal Processing
144
