
MODEL DEVELOPMENT FOR PROPOFOL AND
REMIFENTANIL MANAGEMENT DURING ICU ANESTHESIA
Ramona Hodrea
1
, Sandra Iulianetti
2
, Clara Ionescu
1
and Robin De Keyser
1
1
Department of Electrical Energy, Systems and Automation, Ghent University
Technologiepark 913, 9052 Gent, Belgium
2
Faculté Polytechnique de Mons, 31 Boulevard Dolez, 7000 Mons, Belgium
Keywords: Modeling, Anesthesia, Drug delivery.
Abstract: This paper presents the development of a MISO (multiple-input single-output) patient model for sedation
and analgesia components used in ICU. The two inputs are Propofol and Remifentanil and the output is the
Bispectral Index. The MISO model consists of two well-known PK-PD models for Propofol and
Remifentanil, and an interaction model which describes the synergistic effect of these two drugs on the
Bispectral Index. The interaction model parameters were identified using a nonlinear least squares method.
Data collected during clinical trials in ICU at Ghent University Hospital have been used for model
development. The final purpose is to use this model for prediction in a model based predictive control
strategy.
1 INTRODUCTION
General anesthesia plays an important role in
surgery and Intensive Care Unit (ICU) and requires
critical assessment of induced quantities of drugs
into the patient. There are three major interactive
parts in anesthesia: sedation, analgesia and
neuromuscular blockade.
Usually, anesthesiologists control the drug
dosing during anesthesia by monitoring
hemodynamic signals. This open-loop technique
reaches the target level of sedation fast, but it may
result in minimal values (undershoot) which are not
safe for the patient. On the other hand, if the drug
delivery regulation is done automatically,
anesthesiologists will have more time to concentrate
on critical issues that may threaten the safety of the
patient. Control of anesthesia poses a manifold of
challenges: multivariable characteristics, variable
time delays, inter- and intra-patient variability,
dynamics dependent on anesthetic substances and
stability issues (Haddad, Hayakawa & Bailey, 2003;
Struys et al., 2003).
Numerous PID controllers have been designed
during decades, but since these controllers cannot
anticipate the response of the patient and do not have
any prior knowledge of the drug metabolism, the
performances were sub-optimal. Therefore, model
based strategies using fuzzy (Curatolo et al., 1996),
adaptive (Haddad, Hayakawa & Bailey, 2003) and
predictive (Nunes et al., 2007; Ionescu et al., 2008)
control algorithms have been developed and applied
in clinical trials.
For many control techniques, compartmental
models are used to represent the drug distribution in
the body for patients undergoing anesthesia. SISO
patient models for control of most anesthetic drugs
already exist in the literature (O’Hara, Bogen &
Noordergraaf, 1992). General anesthesia consists of
loss of consciousness through the action of
anesthetics, but also inhibition of pain through the
action of analgesics. Therefore a MISO model is
required for improved control performances. The
anesthetic drug used in this study is Propofol, while
the analgesic drug is Remifentanil. These two drugs
are the inputs of the model, and the output is the
Bispectral Index (BIS), a measure for brain activity.
The clinical data used for model development are
presented in the next section. The structure of the
MISO model is given in section 3 and the
identification results are discussed in section 4. The
conclusions of this study are summarized in a final
section and some future steps are suggested.
145
Hodrea R., Iulianetti S., Ionescu C. and De Keyser R. (2010).
MODEL DEVELOPMENT FOR PROPOFOL AND REMIFENTANIL MANAGEMENT DURING ICU ANESTHESIA .
In Proceedings of the Third International Conference on Bio-inspired Systems and Signal Processing, pages 145-150
DOI: 10.5220/0002591101450150
Copyright
c
SciTePress
2 CLINICAL DATA
The Propofol and Remifentanil dynamics with
respect to the Bispectral Index are taken from real-
life clinical tests in patients during ICU at Ghent
University Hospital. For model development and
validation, data from 9 patients in open loop control
are used. The drugs are administered in open loop
using a TCI (Target-Controlled Infusion) device
called Rugloop (Struys, De Smet & Versichelen,
2003). Briefly, the anesthesiologist sets the desired
target concentration . The system, based on a
mathematical model, calculates the infusion rates
required to achieve and maintain this target
concentration and applies the drug accordingly.
The biometric values of the patients used for this
study were: 63±9 years, 172±14 cm, 91±23 kg, all
male. All patients have undergone cardiac surgery
prior to ICU.
3 MODEL DEVELOPMENT
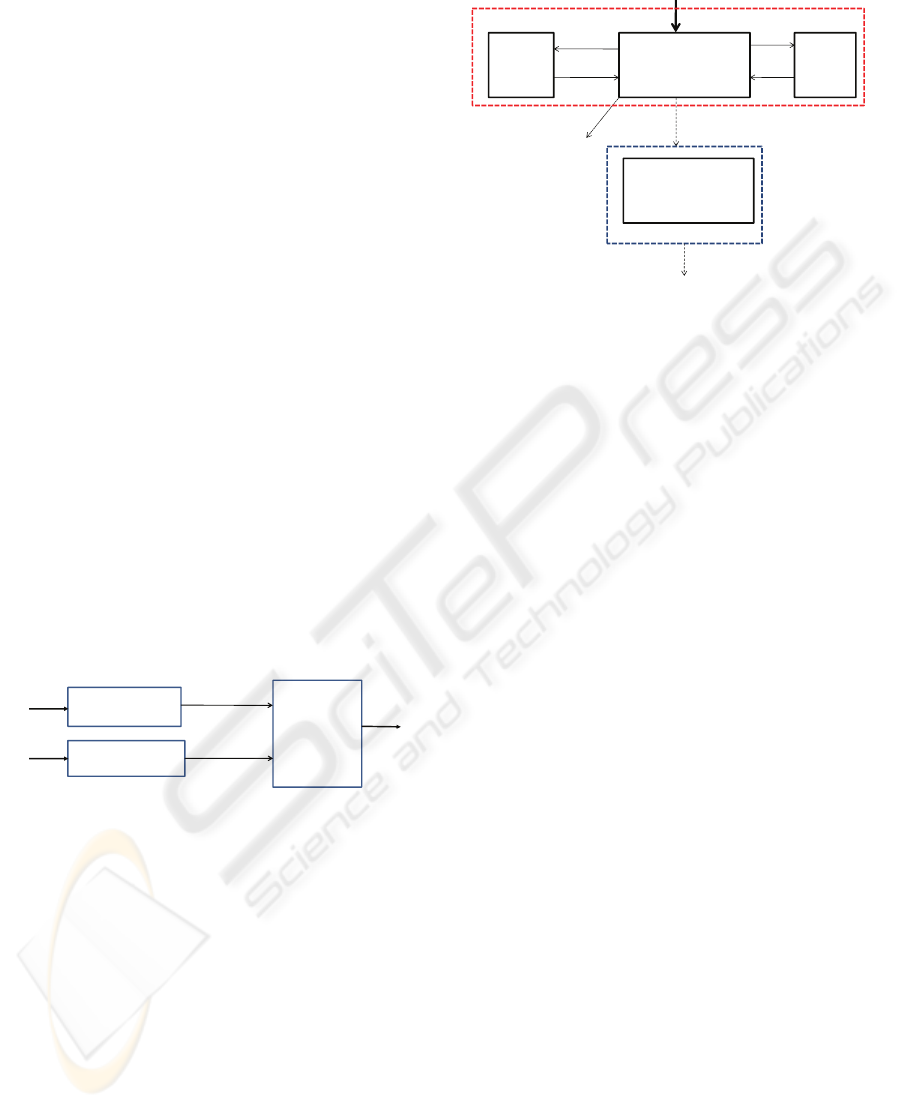
The block diagram of the MISO model is depicted in
Fig.1. It consists of two individual pharmacokinetic
and pharmacodynamic models: for Propofol
(Schnider et al., 1998; Minto et al., 1997) and
Remifentanil (Minto et al., 1997), respectively, and
a nonlinear interaction model describing the drugs
synergistic effect on BIS.
BIS
PK – PD
Propofol model
PK – PD
Remifentanil model
Propofol
Remifentanil
Ce Propofol
Ce Remifentanil
Nonlinear
interaction
model
Figure 1: Block diagram of the MISO model.
The two individual PK-PD models are commonly
used in the TCI devices and have the same structure:
three compartments for pharmacokinetics and one
effect-site compartment for pharmacodynamics. A
non-linear relation between the Bispectral index and
the effect of the two drugs is used (Minto et al.,
2000).
3.1 Propofol and Remifentanil PK-PD
Models
The individual PK-PD models for Propofol
(Schnider et al., 1998) and Remifentanil (Minto et
al. 1997) are depicted in Fig. 2.
MUSCLE
V
2
x
2
INTRAV ASCULAR
BLOOD
V
1
x
1
x
3
V
2
FAT
EFECTSITE
COMPARTMENT
x
e
k
12
k
21
k
13
k
31
DRUGINFUSION(input)
Propofol or Remif entanil
k
10
Clearance:Cl
1
Cl
3
Cl
2
PK
PD k
e0
k
1e
Figure 2: Compartmental model of the patient, where PK
denotes the pharmacokinetic model and PD denotes the
pharmacodynamic model.
The PK model predicts the blood concentration
profile of the drug after infusion. The PD model
describes the relation between the blood
concentration and the corresponding clinical effect.
The Propofol and Remifentanil PK-PD mathematical
models, the rates of drug metabolism or elimination,
the rates of drug transfer between different
compartments, and volumes of distribution are taken
from (Schnider et al., 1998; Minto et al. 1997).
The PK models are expressed by the following
equations:
)1(
where
1
x [mg] denotes the amount of drug in the
central compartment (blood). The blood
concentration is expressed by
11
/Vx . The peripheral
compartments 2 and 3 model the drug exchange of
the blood with well and poorly diffused body tissues.
The remainder of the drug in the body is assumed to
reside in two peripheral compartments: one
identified as muscle tissue and the other one
identified as fat mass. The masses of drug in these
compartments are denoted by
2
x and
3
x ,
respectively. The constants
ji
k
for j≠i, denote the
transfer rate of drug from the j
th
to the i
th
compartment. The constant
10
k is the rate constant
for the processes that irreversibly remove drug from
the central and peripheral compartments, and u(t)
[mg/s] is the infusion rate of the anesthetic drug
[
]
)()()(
)()()(
)()(
)()()(
3311133
2211122
331
22111312101
txktxktx
txktxktx
tutxk
txktxkkktx
⋅−⋅=
⋅−⋅=
+⋅+
⋅+⋅++−=
BIOSIGNALS 2010 - International Conference on Bio-inspired Systems and Signal Processing
146

(Propofol or Remifentanil) into the central
compartment (blood).
An additional hypothetical effect compartment
was proposed to represent the lag between drug
plasma concentration and drug response. The effect
compartment receives drug from the central
compartment by a first-order process. The input to
the effect site compartment is expressed by a first-
order rate constant, k
1e
. The output is also expressed
by a first-order rate constant, k
e0
. This effect site
compartment is represented by the following
equation:
)()()(
10
tCktxktx
peeee
⋅+
⋅
−=
)2(
where
][min456.0],[min456.0
1
1
1
0
−−
==
ee
kk
and
is the amount of drug
in the effect compartment.
Knowing , the apparent concentration in the
effect compartment can be calculated since
will
precisely characterize the temporal effects of
equilibration between the plasma concentration and
the corresponding drug effect. Consequently, the
equation is often used as:
))()(()(
0
tCtCktC
epe
e
−⋅=
⋅
(3)
with Ce called the effect-site compartment
concentration.
3.2 Nonlinear Interaction Model
The interaction model which relates BIS to the effect
concentrations of Propofol and Remifentanil was
developed based on the response-surface
methodology. The latter is a statistical methodology
for estimating and interpreting the response of a
variable dependent on multiple inputs (Schnider et
al. 1998).
The combination of two drugs can be either
additive, either synergistic (or supra-additive), either
infra-additive (greater amounts of both drugs are
needed to produce the drug effect when administered
together). Propofol and Remifentanil have a supra-
additive interaction.
The effects of individual drugs are modeled by
relating BIS to drug effect concentration
e
C
using a
Sigmoid model:
γγ
γ
50
max0
)(
)(
)(
CtC
tC
EEtBIS
e
e
+
⋅−=
)4(
To obtain the interaction model, the
concentrations were normalized to their respective
potencies
op
C
Pr,50
(Propofol effect concentration at
half of the maximum effect) and
m
C
Re,50
(Remifentanil effect concentration at half of the
maximum effect).
;
)(
)(
Pr,50
Pr
Pr
op
ope
op
C
tC
tU =
m
me
m
C
tC
tU
Re,50
Re
Re
)(
)( =
(5)
The ratio of the interacting drugs can be expressed
by:
)()(
)(
)(
PrRe
Pr
tUtU
tU
t
opm
op
+
=
θ
(6)
where: θ is the concentration ratio of the new
combined drug and ranges from 0 (Remifentanil
only) to 1 (Propofol only). The concentration-
response relation of the two drugs can be described
as:
)(
50
RePr
)(
50
RePr
max0
)(
)()(
1
)(
)()(
)()(
θγ
θγ
θ
θ
θ
⎟
⎟
⎠
⎞
⎜
⎜
⎝
⎛
+
+
⎟
⎟
⎠
⎞
⎜
⎜
⎝
⎛
+
⋅−=
U
tUtU
U
tUtU
EEtBIS
mop
mop
)7(
where:
)()(
RePr
tUtU
mop
+
is the new drug
concentration; γ(θ) is the steepness of the
concentration-response relation at ratio θ; U
50
(θ) is
the number of units (U) associated with 50% of
maximum effect at ratio θ; E
max
(θ) is the maximum
possible drug effect at ratio θ.
According to (Minto et al., 2009), E
max
(θ) is
constant and U
50
(θ) can be expressed by a quadratic
polynomial:
(8)
The unknown coefficient β can be estimated
from the data. Since the interaction between the two
drugs is supra-additive, β should be a positive
number. This means that is lower than 1 for
any value of θ between 0 and 1.
4 PARAMETER
IDENTIFICATION
The models are fitted to the data collected from the 9
patients during the maintenance phase of anesthesia.
The interaction model parameters
(
β
,
γ
,
op
C
Pr,50
,
m
C
Re,50
) are estimated for each
patient, using the nonlinear least squares method,
based on a large-scale algorithm. Before being used
2
50
1)(
θβθβθ
⋅+⋅−=U
)(
50
θ
U
e
x
0e
k
0e
k
MODEL DEVELOPMENT FOR PROPOFOL AND REMIFENTANIL MANAGEMENT DURING ICU ANESTHESIA
147
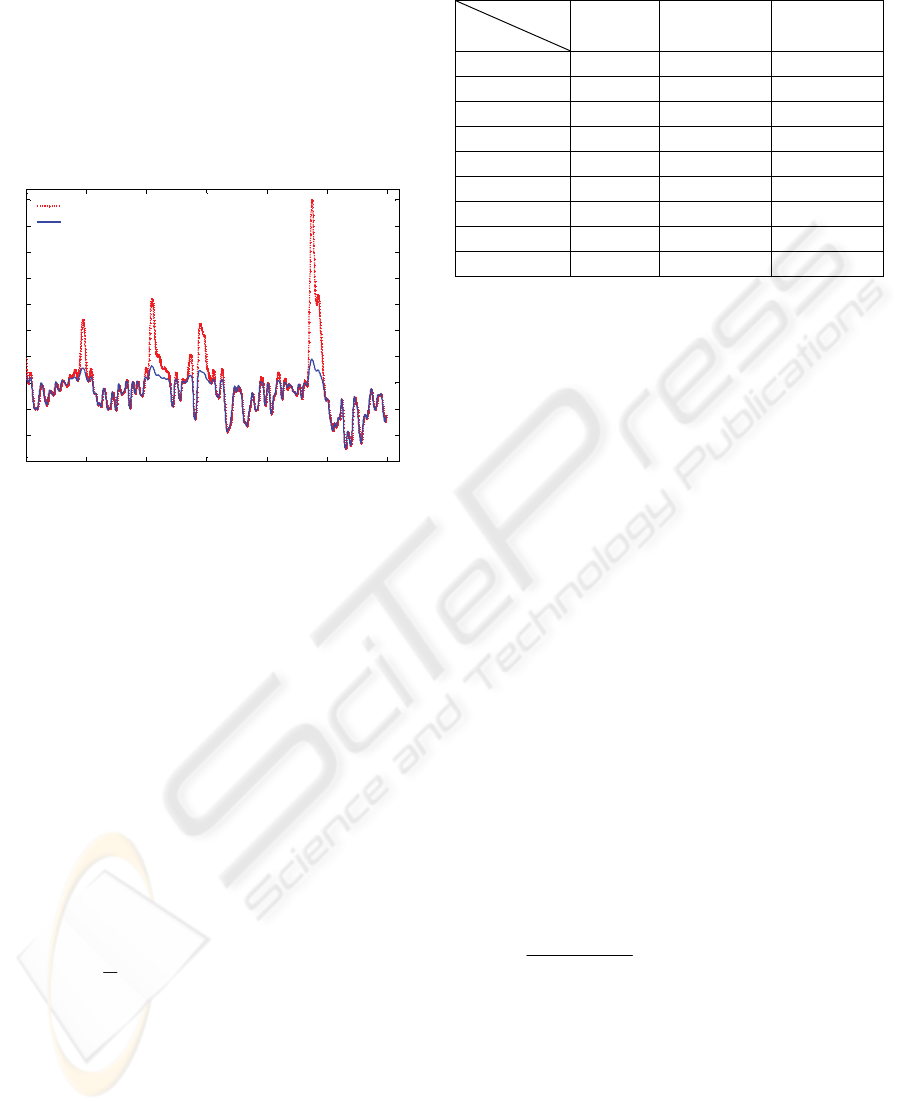
in the identification procedure, the BIS signal is pre-
filtered with a 3
rd
order low-pass Butterworth filter.
For some patients, BIS is strongly affected by
disturbances, such as leg movement or coughing.
For example, these disturbances appear for patient 1
as depicted in Fig. 3. Several peaks can be observed
in the BIS signal, which had to be removed (their
effect is not related to Propofol or Remifentanil
variations).
0 1 2 3 4 5 6
30
35
40
45
50
55
60
65
70
75
80
Time (hours)
BIS
Original BIS signal
Corrected BIS signal for artefact removal
Figure 3: BIS signal for patient 1; original (--) and filtered
signal (-).
By eliminating the artefacts due to coughing or
leg movement, the optimisation procedure
converged to the global optimum. However, the
patient model is varying during ICU (intra-patient
variability). Therefore, the total measurement (6
hours) of the input-output data has been divided in
windows (w) with various lengths. The identification
was performed on data from each window. Three
cases were considered:
1. Identification with 8 windows (
8
=
w )
2. Identification with 25 windows (
25
=
w )
3. Identification with 50 windows (
50
=
w ).
For model validation, the mean absolute error
(MAE) was evaluated as follows:
(9)
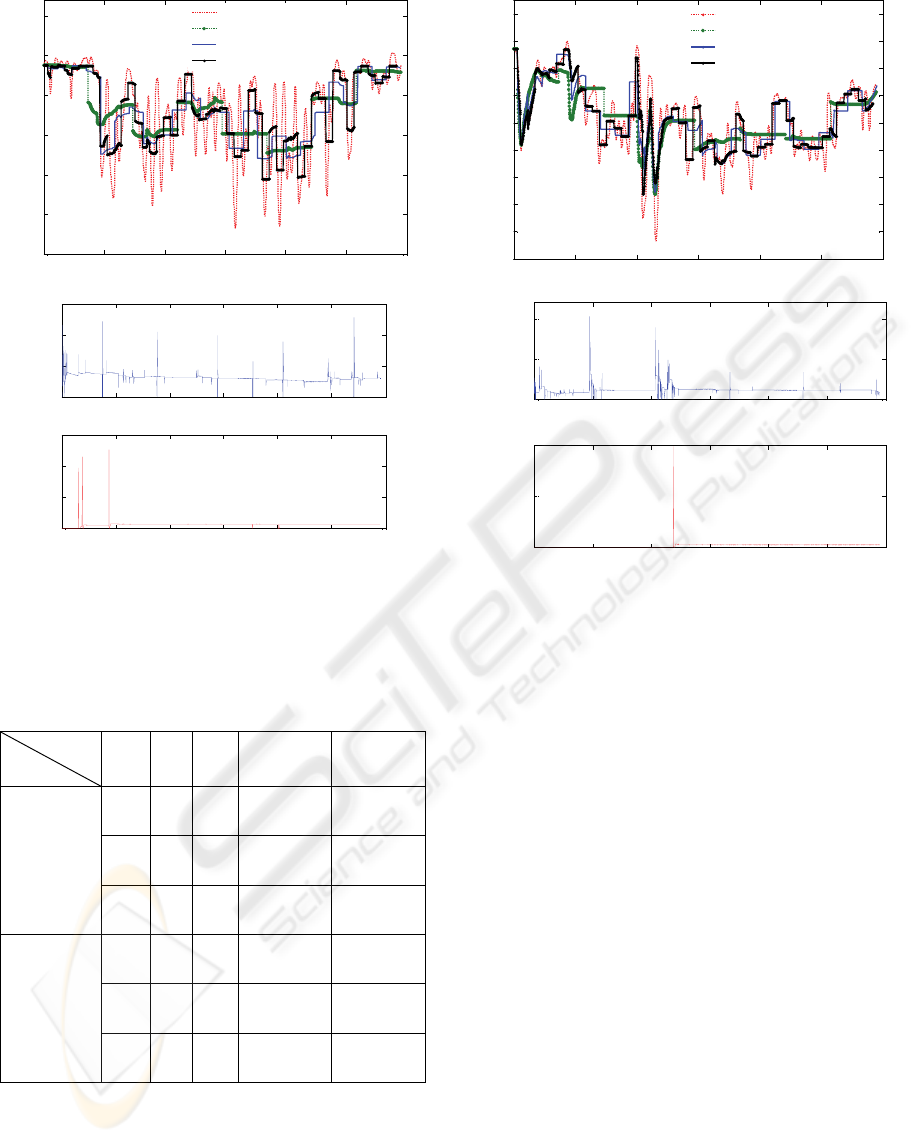
Table 1 presents the MAE obtained for each
patient, considering the three cases. It can be
observed that the best model prediction is obtained
in case of patient 9, while the worst case scenario
corresponds to patient 4. Propofol and Remifentanil
signals used for identification and the results
obtained for these two patients are presented in Fig.
4. and Fig. 5, respectively.
Table 1: Mean absolute error (MAE) for each patient.
MAE
Patient
w=8
w=25
w=50
1 2.06 1.41 1.18
2 3.13 2.12 1.93
3 2.68 1.78 1.46
4 4.31 2.80 2.17
5 2.01 1.62 1.23
6 1.99 1.83 1.51
7 3.28 2.11 1.61
8 1.86 1.23 0.88
9 1.56 1.08 0.80
The results confirmed the assumption that by
using multiple windows in the identification method,
the performance is increased. However, using 50
windows means that the parameters are estimated
every 8 minutes and this is not realistic, because the
time constant of the patient is bigger. A trade-off
between the prediction model performance and the
number of windows should be considered. In this
study, the time elapsed during the identification
procedure to converge to the optimal results is about
1.57 seconds. It is then applicable in an on-line
estimation procedure, since the sample time is 10
seconds.
Although the highest MAE was obtained in case
of patient 4, one can observe that the estimated BIS
follows the real BIS signal. Therefore, the model
performance is acceptable.
The interaction model parameters (7) estimated
with the nonlinear least squares algorithm for the
best and the worst case scenario are presented in
Table 2. Values higher than zero were obtained for β
in case of each patient, which means that
)(
50
θ
U is
lower than 1 for any value of
θ
. Therefore, the
effect of the two drugs combined is higher than the
sum of their separate effect at the same doses (10),
so the Propofol and Remifentanil supra-additive
interaction was confirmed.
mop
mop
UU
U
UU
RePr
50
RePr
)(
+>
+
θ
(10)
Each patient has a different sensitivity to the drug,
therefore different values of
op
C
Pr,50
and
m
C
Re,50
were obtained (inter-patient variability).
|)(|
1
1
Re
∑
=
−=
n
k
alEst
BisBis
n
MAE
BIOSIGNALS 2010 - International Conference on Bio-inspired Systems and Signal Processing
148
0 1 2 3 4 5 6
20
25
30
35
40
45
50
Time(hours)
BIS
Real BIS
Estimated BIS 1
Estimated BIS 2
Estimated BIS 3
0 1 2 3 4 5 6
0
0.2
0.4
Time (hours)
Propofol (mg/s)
0 1 2 3 4 5 6
0
0.5
1
1.5
Time (hours)
Remifentanil (µg/s)
Figure 4: The worst case scenario (Patient 4) - Real BIS
versus modeled BIS, case 1 for w=8, case 2 for w=25 and
case 3 for w=50 (top); Propofol and Remifentanil signals
used for identification (bottom).
Table 2: Estimated parameters for the best and the worst
case scenario.
Parameter
Patient
Case γ β
op
C
Pr,50
(µg/ml)
m
C
Re,50
(ng/ml)
4
1 4.5
±
0.5
0.6
±
0.3
8.1 ± 1.9 44.7 ± 4.7
2 4.3
±
0.5
0.5
±
0.3
7.7 ± 2.2 45.2 ± 5.3
3 4.5
±
0.5
0.5
±
0.3
7.5 ± 2.5 45.1 ± 5.0
9
1 4.3
±
0.4
0.4
±
0.2
4.6 ± 0.3 44.9 ± 4.9
2 3.9
±
0.5
0.4
±
0.2
6.9 ± 2.8 44.9 ± 4.8
3 4.1
±
0.4
0.4
±
0.3
5.9 ± 1.9 45.1 ± 4.9
0 1 2 3 4 5 6
38
40
42
44
46
48
50
52
54
56
Time
(
hours
)
BIS
Real BIS
Estimated BIS 1
Estimated BIS 2
Estimated BIS 3
0 1 2 3 4 5 6
0
0.5
1
Time (hours)
Propofol (mg/s)
0 1 2 3 4 5 6
0
0.5
1
Time (hours)
Remifentanil (µg/s)
Figure 5: The best case scenario (Patient 9) - Real BIS
versus modeled BIS, case 1 for w=8, case 2 for w=25, case
3 for w=50 (top); Propofol and Remifentanil signals used
for identification (bottom).
5 CONCLUSIONS
In this paper, a MISO patient model has been
developed for Propofol and Remifentanil
management during ICU anesthesia. The interaction
model parameters were identified using a nonlinear
least squares method. The total measurement of the
input-output data has been divided in several
windows (w) and the identification was performed
on each window, considering three cases: w=8,
w=25 and w=50. A trade-off between the prediction
model performance and the number of windows has
been considered. Therefore, an identification
procedure with w=25 proved to be a reasonable
choice.
The results obtained are well correlated with the
data from the patients, providing reliable prediction
for Bispectral Index evolution as a result of
manipulated variables Propofol and Remifentanil.
The final purpose is to use the synergistic effects of
these two drugs in a model-based predictive control
MODEL DEVELOPMENT FOR PROPOFOL AND REMIFENTANIL MANAGEMENT DURING ICU ANESTHESIA
149

of anesthesia during ICU, administering both
Propofol and Remifentanil.
Even though the presented model has a good
accuracy, an online identification needs to be
performed and several investigations must be carried
out before applying it in real-life. It will be possible
to exploit afterwards the benefits of multi-drug
anesthesia in an automatic control algorithm.
ACKNOWLEDGEMENTS
This work is funded by IWT TBM project number
060776 supported by the Flemish Institute for
Innovation through Science and Technology.
REFERENCES
Curatolo, M., Derighetti, M., Petersen-Felix, S.,
Feigenwinter, P., Fisher, M., Zbinden, A.M., 1996.
Fuzzy logic control of inspired isoflurane and oxygen
concentrations usingminimal flow anesthesia. In Brit.
J. Anesthesia, vol. 76, pp. 245–250.
Haddad, W.M, Hayakawa, T., Bailey, J.M, 2003.
Nonlinear adaptive control for intensive care unit
sedation and operating room hypnosis. In American
Control Conference, pp1808-1813.
Ionescu, C., De Keyser, R., Torrico, B.C., De Smet, T.,
Struys, M., Normey-Rico, J.E., 2008. Robust
Predictive Control Strategy Applied for Propofol
Dosing using BIS as a Controlled Variable during
Anaesthesia. In IEEE Transactions on Biomedical
Engineering, vol. 55, pp. 2161-2170.
Minto, C.F., Schnider, T.W., Egan, T.D., Youngs, E.,
Lemmens, H.J., Gambús, P.L., Billard , V., Hoke ,
J.F., Moore, K.M. , Hermann, D.J., Muir, K.T.,.
Mandema , J.W., Shafer, S.L., 1997. Influence of age
and gender on the pharmacokinetics and
pharmacodynamics of reminfetanil. I. Model
development. In Anesthesiology, pp. 86:10-23
Minto, C., Schnider, T., Short, T., Gregg, K., Gentilini,
A., Shafer, S., 2000. Response Surface Model for
Anesthetic Drug Interactions. In Anesthesiology,
92(6), pp. 1603-1616
Nunes, C.S., Mendoca, T., Lemos, J.M. , Amorim, P.,
2007. Predictive Adaptive Control of the Bispectral
Index of the EEG (BIS): Exploring Electromyography
as an Accesible Disturbance. In Proceeding of the 15
th
Mediteranean Conference on Control and Automation,
Athena
O’Hara, D. , Bogen, D., Noordergraaf, A., 1992. The use
of computers for controlling the delivery of
anaesthesia. In Anesthesiology, vol. 77, pp. 563–581.
Schnider, T.W., Minto, C.F., Gambus , P.L., Andresen,
C., Goodale , D.B., Youngs, E.J., 1998. The influence
of method of administration and covariates on the
pharmacokinetics of propofol in adult volunteers. In
Anesthesiology, vol. 88, pp. 1170–1182.
Struys, M., Vereecke, H., Moerman, A., Jensen, E. W.,
Verhaeghen, D., De Neve, N., Dumortier, F., Mortier,
E., 2003. Ability of the bispectral index,
autoregressive modelling with exogenous input-
derived auditory evoked potentials, and predicted
propofol concentrations to measure patient
responsiveness during anesthesia with propofol and
remifentanil. In Anesthesiology, vol. 99, 2003, pp.
802–814.
Struys, M., De Smet, T., Versichelen, L., 2003. System
and method for adaptive drug delivery. US Patent
6605072
BIOSIGNALS 2010 - International Conference on Bio-inspired Systems and Signal Processing
150
