
COMBINATION OF CONVOLUTIVE BLIND SIGNAL SEPARATION
AND WAVELET DECOMPOSITION TO EXTRACT THE ATRIAL
ACTIVITY IN ATRIAL FIBRILLATION
C. Vay
´
a, J. J. Rieta
Biomedical Synergy, Universidad Polit
´
ecnica de Valencia, Carretera Nazaret-Oliva s/n, 46730, Gandia, Valencia, Spain
R. Alcaraz
Universidad de Castilla-La Mancha, Camino del Pozuelo s/n, 16071 Cuenca, Spain
Keywords:
Atrial fibrillation, Blind source separation, Convolutive mixture, ECG, Wavelet transform.
Abstract:
In order to use the ECG as a tool for the characterization of atrial fibrillation (AF), we need to dissociate atrial
activity (AA) from ventricular activity. On the other hand, the reduced number of leads recorded from a Holter
system limits the necessary spatial diversity required by Blind Source Separation (BSS) techniques to accu-
rately extract the AA. In this work, we propose a new method, the Convolutive Multiband Blind Separation
(CMBS), to solve the problem of reduced number of leads by combining the Wavelet transform with the con-
volutive BSS algorithm Infomax. Our analysis shows up that CMBS improves the extraction performance of
AA from Holter systems in comparison with previous extraction methods. This improvement is accomplished
in two different scenarios, one for synthetic signals and another one for real signals. A high accuracy of the
estimated AA for synthetic and real AF ECG episodes is reached in both scenarios. In addition, results prove
that CMBS preserves the original AA spectral parameters.
1 INTRODUCTION
The analysis of the surface ECG is the most extended
noninvasive technique in medical diagnosis and treat-
ment of atrial fibrillation (AF). In order to use the
ECG as a tool for the characterization and analysis
of AF analysis, we need to separate the atrial ac-
tivity (AA) from the ventricular activity (VA) and
other bioelectric signals (Langley et al., 2006). Given
that the spectra of AA and VA overlap, they can-
not be separated by simple linear filtering, and non-
linear processing techniques must be used instead.
In this sense, Blind Source Separation (BSS) tech-
niques (Hyv
¨
arinen et al., 2001) are able to perform a
multi-lead statistical analysis of the ECG with the aim
to obtain a set of independent sources where the AA
is included (Rieta et al., 2004). In a previous work,
we made a performance comparison of AA extrac-
tion between convolutive BSS algorithms and Inde-
pendent Component Analysis (ICA) algorithms (Vay
et al., 2007). As a main conclusion of the aforemen-
tioned work, the Infomax algorithm was the convo-
lutive BSS algorithm with the best extraction perfor-
mance, but an adjustment to the specific problem of
the AA extraction was still mandatory to improve re-
sults obtained by ICA algorithms. On the other hand,
the limited numbers of leads recorded from a Holter
system reduces excessively the necessary special di-
versity required by BSS techniques to accurately ex-
tract the AA. Consequently, other extraction tech-
niques diferent from BSS, as Average Beat Substrac-
tion (ABS) (Slocum et al., 1992), are prefered when
multi-lead ECG recordings are not available and indi-
vidual leads are used instead (Bollmann et al., 2006).
Sanchez et all partially solved this difficulty by in-
cluding a wavelet decomposition of Holter leads prior
to ICA analysis, what was called the Wavelet Blind
Separation (WBS) method (Snchez et al., 2004). In
this work, we present an improvement of WBS where
the ICA stage has been replaced with the convolutive
BSS algorithm Infomax (Amari et al., 1996). We will
subsequently refer to this new method as Convolutive
Multiband Blind Separation (CMBS).
373
Vayá C., J. Rieta J. and Alcaraz R. (2010).
COMBINATION OF CONVOLUTIVE BLIND SIGNAL SEPARATION AND WAVELET DECOMPOSITION TO EXTRACT THE ATRIAL ACTIVITY IN
ATRIAL FIBRILLATION.
In Proceedings of the Third International Conference on Bio-inspired Systems and Signal Processing, pages 373-376
DOI: 10.5220/0002592003730376
Copyright
c
SciTePress

Matrix
A
AA
VA
Synthetic leads
x [n]
1
x [n]
2
Figure 1: First scenario synthetic ECG generation. Sepa-
rated AA and VA recordings of AF ECG episodes are con-
volutively mixed by the aleatory mixing matrix A.
2 DATABASE
Two different scenarios were proposed to test the AA
extraction performance of CMBS. In the first sce-
nario, 15 pairs of separated atrial and ventricular ac-
tivities of AF episodes were mixed convolutively in
order to obtain two leads of synthesized ECGs. This
mixture was made by random mixing matrices. The
mixing process in the first scenario can be expressed
using matrix notation as:
x[n] = A · s[n] (1)
where s[n] contains the mixed AA and VA, the s[n]
contains two synthetic ECG leads, and A is a 22 ran-
dom mixing matrix. This mixing process is schema-
tized in Fig 1 .
In the second scenario, the AA extraction perfor-
mance is analyzed on 18 real two-lead Holter record-
ings from leads V1 and V5 of AF episodes. Tree lev-
els of white additive Gaussian noise were studied in
both scenarios: no noise, a signal to noise ratio (SNR)
of 5 dB, and a SNR of 15 dB.
3 METHODS
The main difficulty for applying BSS techniques to
extract the AA from Holter recordings is the lack of
ECG leads. The number of observation required to
solve a BSS problem is, at least, the number of mixed
sources (Hyv
¨
arinen et al., 2001). Given that AA,
VA, noise and other bioelectric signals are always
present in the ECG generation, two Holter leads are
not enough to determine the AA. One way to increase
the number of leads was first introduced in the WBS
method in (Snchez et al., 2004) by the inclusion of a
wavelet decomposition stage prior to the application
of ICA. The Wavelet analysis transforms the signal
under investigation into a set of signals. These sig-
nals are called detail and approximation coefficients,
each of them carrying the ECG information in differ-
ent frequency bands (Addison, 2001).
The function symlet8 with eight levels of decom-
position was used, because several wavelet fami-
lies (Addison, 2001) were tested and the best out-
comes were achieved with this configuration. A
detailed description of this functions can be found
in (Addison, 2001). Detail and approximation coef-
ficients were considered, so that nine observation sig-
nals resulted from each Holter lead. Consequently,
eighteen signals were used as inputs of the BSS stage.
The FastICA algorithm (Hyv
¨
arinen et al., 2001), used
in WBS, was replaced by an infomax algorithm. The
infomax algorithms belong to an important family of
algorithms based on the information theory. Mutual
information is a natural measure of the dependence
between random signals (Hyv
¨
arinen et al., 2001).
Asano et al proposed a BSS algorithm for convo-
lutive mixture that works in the time-frequency do-
main (Asano et al., 2001). We will subsequently refer
to this algorithm as convolutive Infomax. The general
process is illustrated in Fig 2 .
The selection of the AA from the sources esti-
mated by convolutive Infomax is made regarding to
the spectral morphology of the signals. The typical
power spectrum of AA signals contains a sharp peak
between 4 an 8 Hz and insignificant content in the
rest of frequencies (Bollmann et al., 1999). This se-
lection can be made either by visual observation of
the extracted sources spectra, or by using the Spec-
tral Concentration (SC) index, which automatizes the
decision (Castells et al., 2005). The SC will be later
defined as a index that is also used to measure the per-
formance of the AA extraction.
4 PERFORMANCE INDEXES
In order to test CMBS, four performance indexes
were computed from the extracted AA in the first sce-
nario. These indexes are the temporal correlation (R
t
)
with the original mixed AA, the spectral correlation
(R
s
) with the Fourier transform of the original AA,
the main peak frequency ( f
p
), and the SC. The SC is
defined as (Castells et al., 2005):
SC =
1.17 f
p1
∑
f =0.82 f
p1
P
AA
( f )
0.5 f
s
∑
f =0
P
AA
( f )
(2)
where P
AA
is the power spectral density of the AA
signal, f is the frequencies vector, f
s
is the sampling
rate (1024 Hz), and f
p1
is the main peak frequency
of the AA. In the second scenario, only the two last
BIOSIGNALS 2010 - International Conference on Bio-inspired Systems and Signal Processing
374
Wavelet
Decomposition
Infomax
x ,x ,...,x
21 22 29
x ,x ,...,x
11 12 19
x
1
x
2
AA
VA
Noise
Other
Figure 2: General CMBS process for AA extraction.
indexes were applicable since the original AA is un-
known. Good performance of AA extraction is char-
acterized by values of R
t
and R
s
near to one and high
values of SC expressed in percentage.
5 RESULTS
The results for R
t
in the first scenario are shown in Fig
3. The mean values of R
t
obtained by CMBS (0.8526
0,8021&
0,4626&
0,2887&
0,7801&
0,7552&
0,7128&
0,8526&
0,8356&
0,7965&
0& 0,2& 0,4& 0,6& 0,8& 1&
NO&NOISE&
15&dB&
5&dB&
R
t#
CMBS&
WBS&
ICA&
Figure 3: Mean R
t
between the original AA and the one
extracted by ICA, WBS and CMBS from synthesized ECG
recordings at three levels of SNR.
for no noise, 0.8356 for 15 dB of SNR, 0.7965 for
5 dB of SNR) are higher than mean values obtained
by WBS (0.7801 for no noise, 0.7572 for 15 dB of
SNR, 0.7128 for 5 dB of SNR) and ICA (0.8021 for
no noise, 0.4626 for 15 dB of SNR, 0.2887 for 5 dB
of SNR).
The results for R
s
in the first scenario are shown
in Fig 4. The mean values of R
s
obtained by CMBS
0,8225&
0,6087&
0,5516&
0,7066&
0,6436&
0,6396&
0,8371&
0,8236&
0,6708&
0& 0,2& 0,4& 0,6& 0,8& 1&
NO&NOISE&
15&dB&
5&dB&
R
s#
CMBS&
WBS&
ICA&
Figure 4: Mean R
s
between the original AA and the one
extracted by ICA, WBS and CMBS from synthesized ECG
recordings at three levels of SNR.
(0.8371 for no noise, 0.8236 for 15 dB of SNR,
0.6708 for 15 dB of SNR) are higher than those ob-
tained by WBS (0.7066 for no noise, 0.6436 for 15
dB of SNR, 0.6396 for 5 dB of SNR) or ICA (0.8225
for no noise, 0.6087 for 15 dB of SNR, 0.5516 for 5
dB of SNR).
The results for f
p
in the first scenario are shown
in Fig 5. The mean f
p
estimated by CMBS (5.49 Hz
5,50$
5,20$
4,71$
5,65$
5,92$
3,84$
5,49$
6,07$
5,80$
0$ 1$ 2$ 3$ 4$ 5$ 6$ 7$
NO$NOISE$
15$dB$
5$dB$
f
p#
(Hz)%
CMBS$
WBS$
ICA$
Figure 5: Mean f
p
of the AA extracted by ICA, WBS and
CMBS from synthesized ECG recordings at three levels of
SNR.
for no noise, 6.07 Hz for 15 dB of SNR, 5.80 for 5
dB of SNR) is the best approach to the mean f
p
of the
original mixed AA sources (5.46 Hz). Also the SC ob-
tained by CMBS (62.82% for no noise, 61.64% for 15
dB of SNR, 60.04% for 5 dB of SNR) improves the re-
sults of WBS (57.00% for no noise, 55.71% for 15 dB
of SNR, 47.61% for 5 dB of SNR) and ICA (61.78%
for no noise, 60.86% for 15 dB of SNR, 44.68% for
5 dB of SNR), and it is the best approach to the mean
SC of the mixed AA sources (62.92%). The results
for SC in the first scenario are shown in Fig 6.
61,78&
60,86&
44,68&
57,00&
55,71&
47,61&
62,82&
61,44&
60,04&
0& 10& 20& 30& 40& 50& 60& 70&
NO&NOISE&
15&dB&
5&dB&
SC#(%)$
CMBS&
WBS&
ICA&
Figure 6: Mean SC of the AA extracted by ICA, WBS and
CMBS from synthesized ECG recordings at three levels of
SNR.
In the second scenario, the estimation of f
p
by
CMBS (5.46 Hz for no noise, 5.21 Hz for 15 dB of
SNR, 5.35 Hz for 5 dB of SNR) is less affected by
the level of noise than the estimation made by WBS
(5.24 Hz for no noise, 4.52 Hz for 15 dB of SNR, 4.77
Hz for 5 dB of SNR), and the one estimated by ICA
(5.40 Hz for no noise, 4.91 Hz for 15 dB of SNR, 4.19
Hz for 5 dB of SNR). The estimated SC values for real
Holter ECG obtained by CMBS (71.83% for no noise,
71.53% for 15 dB of SNR, 64.70% for 5 dB of SNR)
exceed the values obtained by WBS (67.13% for no
COMBINATION OF CONVOLUTIVE BLIND SIGNAL SEPARATION AND WAVELET DECOMPOSITION TO
EXTRACT THE ATRIAL ACTIVITY IN ATRIAL FIBRILLATION
375
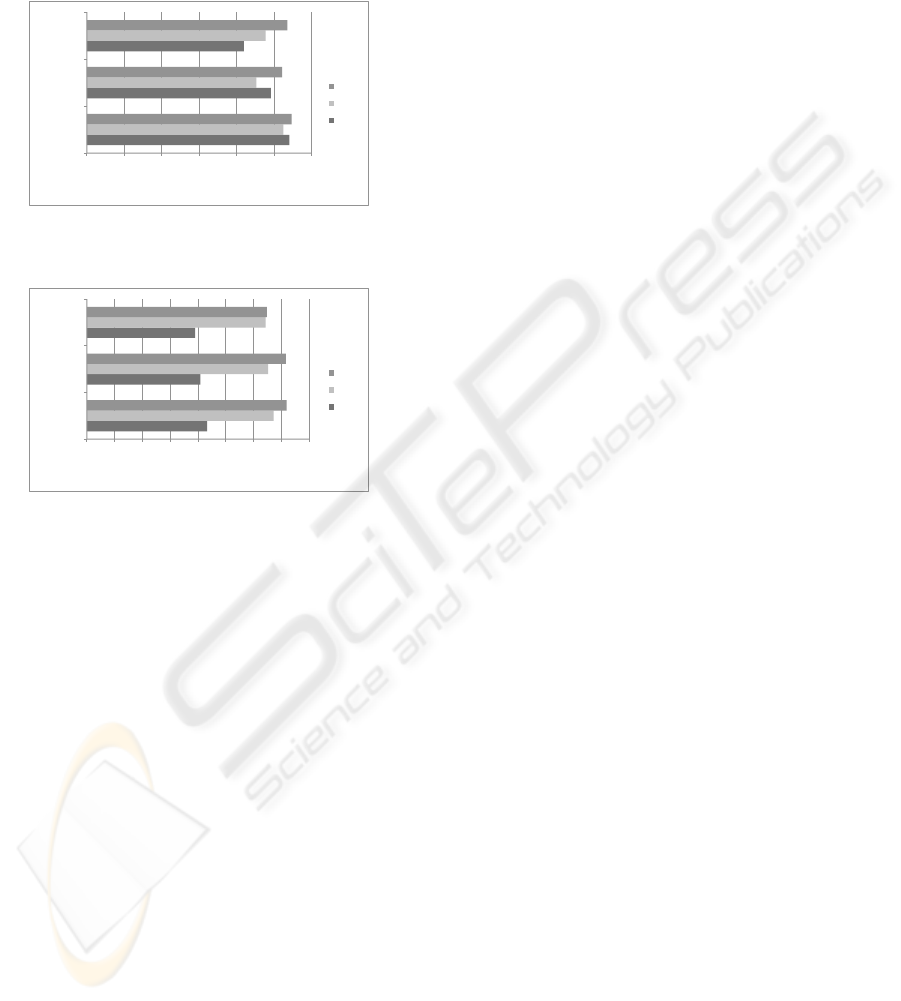
noise, 65.18% for 15 dB of SNR, 64.32% for 5 dB of
SNR) and ICA (43.23% for no noise, 40.77% for 15
dB of SNR, 38.94% for 5 dB of SNR). The results of
f
p
and SC in the second scenario are depicted in Fig
7 and Fig 8, respectively.
5,40%%
4,91%%
4,19%%
5,24%
4,52%
4,77%
5,46%
5,21%
5,35%
0% 1% 2% 3% 4% 5% 6%
NO%NOISE%
15%dB%
5%dB%
f
p
!(Hz)!
CMBS%
WBS%
ICA%
Figure 7: Mean f
p
of the AA extracted by ICA, WBS and
CMBS from real ECG recordings at three levels of SNR.
43,23%
40,77%
38,94%
67,13%
65,18%
64,32%
71,83%
71,53%
64,70%
0% 10% 20% 30% 40% 50% 60% 70% 80%
NO%NOISE%
15%dB%
5%dB%
SC
#
(%)$
CMBS%
WBS%
ICA%
Figure 8: Mean SC of the AA extracted by ICA, WBS and
CMBS from real ECG recordings at three levels of SNR.
6 CONCLUSIONS
Our analysis showed up that CMBS improves the ex-
traction performance of WBS and ICA in both sce-
narios so that a high accuracy of the estimated AA
for synthetic and real AF ECG episodes is accom-
plished, what is proved by the high values of R
t
. In
addition, the high values of R
s
and SC and the low
error of f
p
estimation prove that the original spectral
parameters of the AA are preserved in the AA esti-
mated by CMBS from both synthetic and real signals.
This fact enables CMBS as a suitable previous step to
the analysis of AA signals in the spectral domain.
ACKNOWLEDGEMENTS
This work was supported by the projects TEC2007–
64884 from the Spanish Ministry of Science and
Innovation and PAID–05–08 from the Universidad
Polit
´
ecnica de Valencia.
REFERENCES
Addison, P. (2001). The Illustrated Wavelet Transform
Handbook.1st edition. Taylor & Francis.
Amari, S., Cichocki, A., and Yang, H. (1996). A new learn-
ing algorithm for blind source separation. Advances in
Neural Information Processing Systems, 8:757–763.
Asano, F., Ikeda, S., Ogawa, M., Asoh, H., and Kitawaki, N.
(2001). A combined approach of array processing and
independent component analysis for blind separation
of acoustic signals. In Proceedings of the IEEE Con-
ference on Acoustics, Speech and Signal Processing,
Salt Lake City, USA.
Bollmann, A., Husser, D., Mainardi, L., Lombardi, F., Lan-
gley, P., Murray, A., Rieta, J. J., Millet, J., Olsson,
S. B., Stridh, M., and L, S. (2006). Analysis of sur-
face electrocardiograms in atrial fibrillation: Tech-
niques, research and clinical applications. Europace,
8(11):911–926.
Bollmann, A., Sonne, K., Esperer, H. D., Toepffer, I., Lang-
berg, J. J., and Klein, H. U. (1999). Non-invasive as-
sessment of fibrillatory activity in patients with parox-
ysmal and persistent atrial fibrillation using the Holter
ECG. Cardiovascular Research, 44:60–66.
Castells, F., Rieta, J. J., Millet, J., and Zarzoso, V.
(2005). Spatiotemporal blind source separation ap-
proach to atrial activity estimation in atrial tach-
yarrhythmias. IEEE Transactions on Biomedical En-
gineering, 52(2):258–267.
Hyv
¨
arinen, A., Karhunen, J., and Oja, E. (2001). Indepen-
dent Component Analysis. John Wiley & Sons, New
York.
Langley, P., , J. J., Stridh, M., Millet, J., Srnmo, L., and
Murray, A. (2006). Comparison of atrial signal ex-
traction algorithms in 12-lead ECGs with atrial fibril-
lation. IEEE Transactions on Biomedical Engineer-
ing, 53(2):343–346.
Rieta, J. J., Castells, F., S
´
anchez, C., and Zarzoso, V. (2004).
Atrial activity extraction for atrial fibrillation analysis
using blind source separation. IEEE Transactions on
Biomedical Engineering, 51(7):1176–1186.
Slocum, J., Sahakian, A., and Swiryn, S. (1992). Diagno-
sis of atrial fibrillation from surface electrocardiogram
based on computer-detected atrial activity. Journal of
Electrocardiology, 25(1):1–8.
Snchez, C., Rieta, J., Castells, F., Alcaraz, R., and Millet,
J. (2004). Wavelet blind separation: A new method-
ology for the analysis of atrial fibrillation from holter
recordings. In Proc.Int.Conf on Computers in Cardi-
ology, volume 31, pages 417–420.
Vay, C., Rieta, J. J., Snchez, C., and Moratal, D. (2007).
Convolutive blind source separation algorithms ap-
plied to the electrocardiogram of atrial fibrillation:
Study of performance. IEEE Transactions on Biomed-
ical Engineering, 54(8):1530–1533.
BIOSIGNALS 2010 - International Conference on Bio-inspired Systems and Signal Processing
376
