
DETECTION OF TOOTHBRUSHING ACTIVITY USING
FREE-LIVING ACCELERATION DATA
R
¨
udiger Zillmer
Unilever R&D Port Sunlight, Quarry Road East, Bebington, U.K.
Keywords:
Activity monitoring, Free-living, Accelerometer, Classification.
Abstract:
The present paper discusses the characterisation of toothbrushing activity, using acceleration data collected
for 50 subjects in free-living conditions. The data logging is triggered by super-threshold values of accelera-
tion, which can give rise to false activations by non-brushing activities. Due to large intra and inter individual
variations, it is not possible to obtain an exhaustive training-set of all activities that trigger the logging. Thus,
a structural analysis of appropriate data features is performed, which reveals a clustering of the data. The
comparison with brushing activity traces from laboratory experiments allows the identification of toothbrush-
ing activity, while the remainder corresponds to various false activation events like electronic noise or brush
handling. The distribution of the resulting toothbrushing activity shows distinct peaks for morning and night
brushing activity.
1 INTRODUCTION
The measurement of human activity plays an im-
portant part in medical monitoring, where many ap-
plications consider the detection of certain dynami-
cal states which subsequently allows drawing conclu-
sions about the physical state of the subject. Usu-
ally, activity is measured in a laboratory environment,
where the experiment follows a fixed protocol (e.g.,
5min walk, 5min treadmill etc.) (Preece et al., 2009),
or the user has to label manually the respective aciv-
ity (Bao and Intille, 2004). Due to obvious logistic
problems the sample size is usually restricted to 5 -
20 subjects. The labelling of the data allows the train-
ing and subsequent validation of different classifica-
tion techniques. However, little is known about the
properties of data collected in free-living conditions
for large populations. Typical issues encountered in
field experiments are:
• Unpredictable behaviour of the subjects.
• Unexpected noise sources.
• High interindividual variability of activity (see
e.g., (Welk et al., 2007)).
In order to obtain a labeling of the activity, experi-
ments can be combined with video observation (Vega-
Gonzalez et al., 2007). However, it is plausible that
knowledge of being observed changes the individual’s
behaviour. The last issue also effects the quality of
questionnaires, or self-reports, which are often biased
towards the ’desired’ behaviour. This paper consid-
ers an industrial approach to the activity classification
based on accelerometer data. The data are taken from
a study conducted by Unilever Oral Care (Claessen
et al., 2008a), which measured the toothbrushing be-
haviour of a large population in Xian (China). The
subjects were given a Sensor brush, a novel device
developed by Unilever, which logged toothbrushing
events over a period of 3 weeks. The study was
originally designed to evaluate the effect of public
health communication, but in the present paper only
the technical aspect concerning activity classification
shall be addressed.
The paper is organized as follows. First, the Sen-
sor brush technology is introduced. In Section 3 the
data format and analysis methods are discussed. This
includes results on the classification of logged events
together with examples for the different classes.
2 THE SENSOR BRUSH DATA
In order to capture toothbrushing behaviour in free-
living conditions, a logging device, called Sensor
377
Zillmer R. (2010).
DETECTION OF TOOTHBRUSHING ACTIVITY USING FREE-LIVING ACCELERATION DATA.
In Proceedings of the Third International Conference on Bio-inspired Systems and Signal Processing, pages 377-380
DOI: 10.5220/0002592403770380
Copyright
c
SciTePress
brush (Figure 1), has been developed by Unilever Oral
Care (Claessen et al., 2008a). The Sensor brush has
the shape of a normal toothbrush with a compartment
in the handle that contains the data logger. The latter
includes a 3-axial accelerometer, memory, and bat-
tery. In order to reduce memory and power usage, the
data logging starts when the accelerometer signal ex-
ceeds a certain threshold, and then continues for 60
seconds. After 60 seconds the logging either contin-
ues if the signal is still above threshold, otherwise it
stops. The data thus consists of 60s traces of the x, y, z
acceleration, sampled at 10Hz, together with the date
and start time of the event.
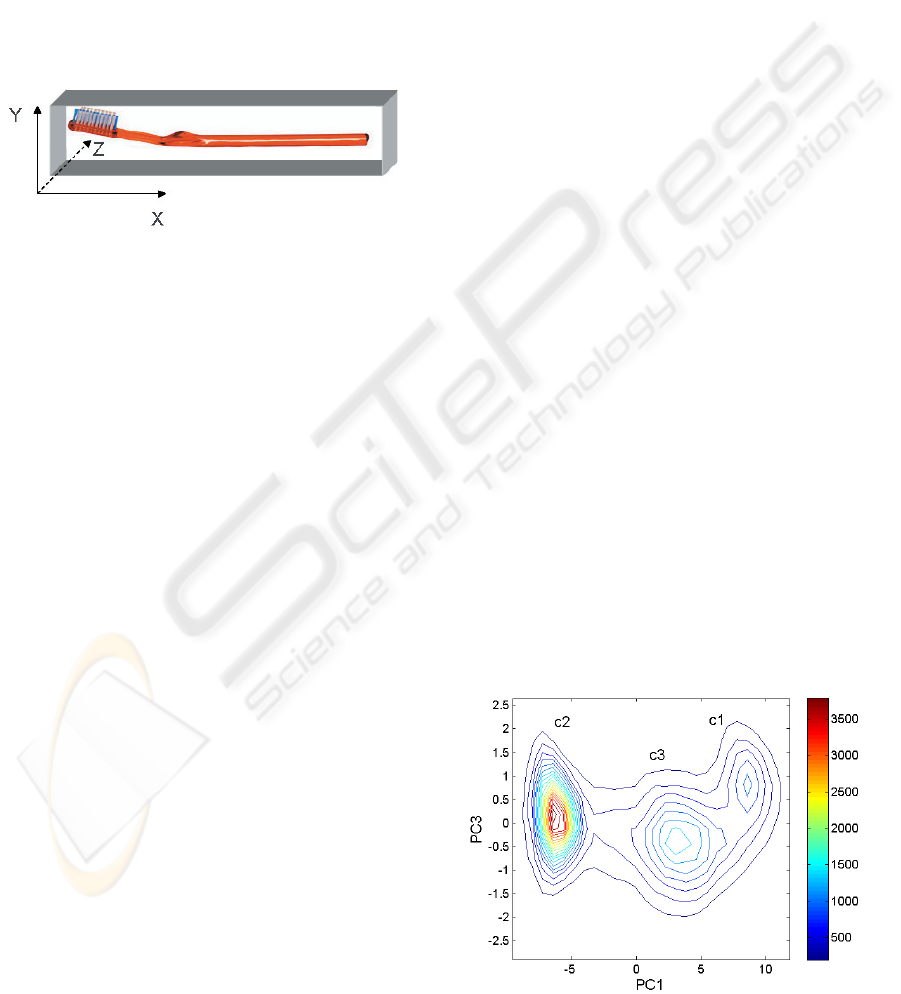
Figure 1: Sensor brush 3-axial measurement.
The validity and reliability of this technology has
been established in a number of studies (Claessen
et al., 2008b), which confirm that the Sensor brush
is able to detect time and date of brushing events, and
does not influence the brushing duration when com-
pared to a standard marketed toothbrush.
3 DATA ANALYSIS
As outlined in the previous section, the device starts
to log 60s of the acceleration trace after the signal
exceeds a threshold. The latter is chosen in a way
that no brushing events are lost. As a result, the data
is corrupted by false activations, due to handling of
the brush, opening and closing of cabinet doors, inci-
dental dropping of the brush, internal electronic noise
and many more. Hence, a post-processing of the data
is necessary, which should allow for unknown error
sources. Since there is no sufficient training set avail-
able, the data features are searched for patterns, or
structures, which allow extracting the true brushing
events via an unsupervised clustering technique.
The data considered in the following consist of
logged events (60s of x, y, z acceleration) for 50 male
adults over a period of 3 weeks. Each event is labelled
by time and date, which allows the extraction of the
average intensity of toothbrushing for a given time of
the day. The respective analysis steps are described in
the following.
3.1 Feature Extraction
The signal of the accelerometers is corrupted by noisy
spikes that are removed in a pre-processing step. Each
data sample is then divided into adjacent windows of
3s that contain 3x30 data points for the x, y, z accelera-
tion. Because the sampling frequency is 10Hz, which
is quite close to typical brushing frequencies (between
3 and 5Hz), a principal component analysis is per-
formed to obtain the linear combination of the three
acceleration traces that contains the maximal vari-
ance. This is done for each window i, yielding a set of
(maximum variance) components a
i
(n), n = 1. . . 30.
The absolute values of ten Fourier coefficients, cor-
responding to frequencies 2, 2.33, 2.67, . . . , 5Hz, are
obtained via fast Fourier transformation of the a
i
. We
denote these values as s
i,k
, k = 1. . . 10.
3.2 Data Analysis and Classification
For the subsequent analysis, the logarithms of the co-
efficients, logs
i,k
, for all subjects are merged to form a
large data matrix S
j,k
, where j labels the respective 3s
window and k = 1. . . 10 indicates the frequency com-
ponent. In order to reduce the dimensionality a princi-
pal component analysis (PCA) is performed on the ten
frequency components. The loadings of the first three
principal components, which explain 93% of the total
variance, can be interpreted as follows: PC1 reflects
the total variation of all frequencies; PC2 reflects the
variation of the power in the 5Hz frequency compo-
nent; PC3 contrasts the power in 4, 4.33, 4.67Hz with
the other frequencies. Because 5Hz corresponds to
the Nyquist frequency, the second component PC2
is excluded from further analysis. More interesting
are the frequencies reflected by PC3, which corre-
spond to the typical range of toothbrushing frequen-
cies (Van Someren et al., 1996).
Figure 2: The distribution of the data in the PC1-PC3 plane,
indicating a partition into 3 clusters, C1, C2, C3.
BIOSIGNALS 2010 - International Conference on Bio-inspired Systems and Signal Processing
378
A scatter plot of the data in the PC1-PC3 plane
reveals a partition into three clusters. This is clearly
seen in the contour-plot of the data distribution shown
in Figure 2. The upper right cluster, C1, in Figure 2 is
characterized by high total power and relatively high
power in the frequency components 4, 4.33, 4.67Hz.
This is the expected property of toothbrushing events.
A visual check of the data and a comparison with test
toothbrushing traces (collected in the laboratory) con-
firms this expectation, such that it can be assumed
that the cluster C1 contains toothbrushing events. Ac-
cordingly, the false activations (due to non-brushing
activity) belong to the clusters C2 and C3. In order
to discriminate the data, a Gaussian mixture model is
used (Press et al., 2007). The result is presented in
Figure 3. The figure indicates a considerable over-
lap between the clusters, which is a typical feature of
real-life data.
Figure 3: The result of the clustering in the PC1-PC3 plane.
The toothbrushing events are contained in C1.
The majority of the data points belong to clusters
C2 and C3 with 41 and 46%, resp., while C1 con-
tains 13% of the data. Because the Gaussian mixture
model assigns a membership probability to each data
point, the probability of misclassification can be esti-
mated. The results shown in the table 1 below sug-
gest that there is a 0.02 probability of misclassifying
a toothbrushing event as false activation (false nega-
tive) and a 0.13 probability of misclassifying a false
activation as toothbrushing (false positive). However,
these numbers are obtained under the assumption that
the Gaussian mixture model correctly describes the
data, while Figure 2 indicates that this is only approx-
imately valid.
In Figure 4 typical examples of logged events be-
longing to the three clusters are presented. The C1
sample shows strong oscillations combined with base-
line changes (due to brush rotations), which is char-
acteristic for toothbrushing activity. The C2 sample
Table 1: The average membership probabilities for the clus-
ters C1, C2, and C3.
classified as prob. C1 prob. C2 prob. C3
C1 0.87 0 0.13
C2 0 0.98 0.02
C3 0.02 0.01 97
is typical for a logger activation due to exceptional
electronic noise (spikes) that is followed by baseline
noise. An interesting case is the C3 sample: there are
distinct regular oscillations of about 2Hz that might
suggest a brushing activity. However, the small am-
plitude of the oscillations and the absence of baseline
shifts indicate a false activation, probably due to static
vibrations generated by a washing machine or similar.
Figure 4: Examples for accelerometer signals for (from top
to bottom) cluster C1 (toothbrushing, 1:00am), C2 (false
activation due to electronic noise), C3 (false activation due
to external perturbation).
An interesting property is the distribution of
logged events over the day. The result for the three
clusters is shown in Figure 5. The brushing activity
has distinct maxima between 7 and 8am and around
10pm, and minima between 3 and 4am and around
5pm. The prevalence of brushing in the morning
is typical for the group considered (see (Zhu et al.,
2005)). There is a small peak around 12 noon that
indicates toothbrushing activity after lunch. The non-
brushing events in C2 and C3 have a more ragged dis-
tribution, which is in general well correlated with the
brushing events. This is not surprising, since tooth-
DETECTION OF TOOTHBRUSHING ACTIVITY USING FREE-LIVING ACCELERATION DATA
379
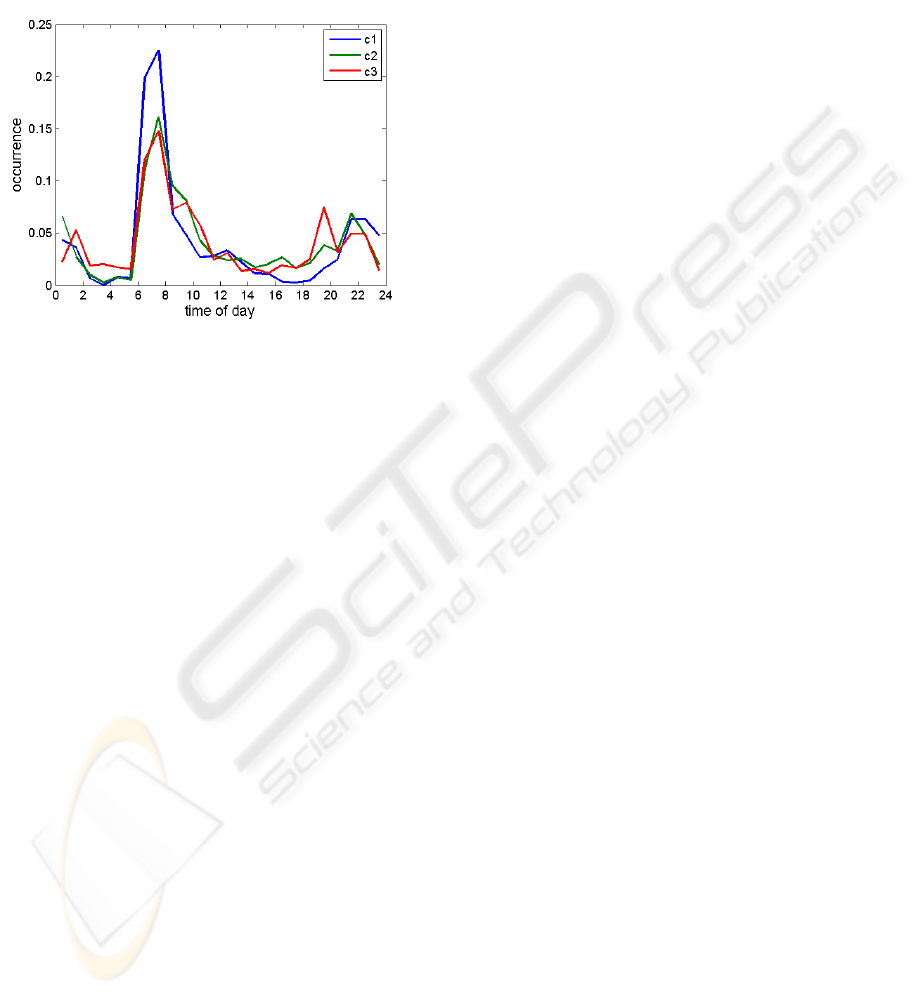
brushing is usually accompanied by other activities in
the bathroom that are likely to trigger a false logging
event. There is a pronounced maximum between 7
and 8pm, which might be caused by a regular rou-
tine (e.g. washing after work), but this can only be
guessed due to the lack of further information.
Figure 5: The normalised distribution of logged events over
the day for the three groups C1, C2, and C3.
4 CONCLUSIONS
The present paper discusses the characterisation of
toothbrushing activity, where the data consists of ac-
celeration traces logged by a sensor that is integrated
in the brush. Because the data has been collected
under free-living conditions for a large population, it
was not possible to obtain an exhaustive training-set
of all possible super-threshold activities that trigger
the logging. Thus, a structural analysis of appropri-
ate data features is performed, which reveals a parti-
tion into three clusters. The comparison with brush-
ing activity traces from laboratory experiments allows
assigning one cluster to toothbrushing activity, while
the remainder corresponds to various false activation
events like electronic noise or handling of the brush
in the context of other activities.
An inherent property of real-life activity data is
the enormous variability, both within and across sub-
jects. Here, this is reflected by an overlap between the
clusters found in the data, that leads to a 13% classi-
fication uncertainty for toothbrushing events. A pos-
sible remedy for this problem is to collect more vari-
ables (e.g., rotation rate) at higher sampling frequen-
cies, which, however, is restricted by memory and en-
ergy consumption issues in the logger design. An im-
portant point is that the logger should not influence
the normal behaviour of the subjects while being in
the field for several days.
It would be interesting to gather more information
about the possible sources of false activation and their
acceleration patterns. This will require elaborate lab-
oratory experiments that take into account learnings
from field experiments.
REFERENCES
Bao, L. and Intille, S. (2004). Activity Recognition from
User-Annotated Acceleration Data, Lecture Notes in
Computer Science, volume 3001. Springer, Berlin.
Claessen, J. P., Bates, S., Sherlock, K., Seeparsand, F., and
Wright, R. (2008a). Designing interventions to im-
prove tooth brushing. International Dental Journal,
58.
Claessen, J. P., Seeparsand, F., and Wright, R. (2008b).
Brushing up on behaviour measurement: Validation
study of new technology. PEF-IADR, London.
Preece, S. J., Goulermas, J. Y., Kenney, L. P. J., and
Howard, D. (2009). A comparison of feature extrac-
tion methods for the classification of dynamic activ-
ities from acceleration data. IEEE Transactions on
Biomedical Engineering, 56:871.
Press, W. H., Teukolsky, S. A., Vetterling, W. T., and Flan-
nery, B. P. (2007). Numerical Recipies 3rd Edition:
The Art of Scientific Computing. Cambridge Univer-
sity Press, 3rd edition.
Van Someren, E. J. W., Lazerona, R. H. C., Vonk, B. F. M.,
Mirmirana, M., and Swaab, D. F. (1996). Gravita-
tional artefact in frequency spectra of movement ac-
celeration: implications for actigraphy in young and
elderly subjects. J Neurosci Methods, 65(1):55–62.
Vega-Gonzalez, A., Bain, B. J., Dall, P. M., and Granat,
M. H. (2007). Continuous monitoring of upper-limb
activity in a free-living environment: a validation
study. Medical and Biological Engineering and Com-
puting, 45(10):947–956.
Welk, G. W., McClain, J. J., Eisenmann, J. C., and Wickel,
E. E. (2007). Field validation of the mti actigraph and
bodymedia armband monitor using the ideea monitor.
Obesity, 15(4):918–928.
Zhu, L., Petersen, P. E., and Wang, H. Y. (2005). Oral health
knowledge, attitudes and behaviour of adults in china.
Int Dent J, 55:231–241.
BIOSIGNALS 2010 - International Conference on Bio-inspired Systems and Signal Processing
380
