
PREDICTING THE EVOLUTION OF PRESSURE ULCERS
Francisco J. Veredas, H´ector Mesa
Dpto. Lenguajes y Ciencias de la Computaci´on, Universidad de M´alaga, M´alaga, Spain
Juan C. Morilla
Distrito Sanitario de M´alaga, Servicio Andaluz de Salud, M´alaga, Spain
Laura Morente
Escuela Universitaria de Enfermer´ıa, Diputaci´on Provincial, M´alaga, Spain
Keywords:
Pressure ulcer, Wound, Prediction, Machine learning, Artificial intelligence.
Abstract:
A pressure ulcer is a clinical pathology of localized damage to the skin and underlying tissue caused by pres-
sure, shear or friction. Diagnosis, treatment and care of pressure ulcers are costly for health services. Accurate
wound evaluation is a critical task for optimizing the efficacy of treatment and care. Prediction of wound
evolution helps the effective management of health resources and planning of pharmacological treatment and
health-care decisions. In this paper, different machine learning approaches have been designed and used to
predict the evolution of pressure ulcers. These predictive systems are based on local features extracted from
wound images which were weekly taken in uncontrolled lighting conditions. The images were automatically
segmented by the mean-shift procedure. A group of clinical experts manually classified the segmented regions
into five different tissue types, and a set of local descriptors based on area measurements of these tissues was
extracted. The one-week evolution of two different indicators for pressure ulcer evaluation is predicted: the
ratio between granulation and devitalized tissue, and the percentage of wound-bed border consisting of granu-
lation tissue. Of the tens of machine learning approaches and architectures tested in this study, support vector
machines, naive Bayes classifiers, neural networks and decision trees achieved the highest accuracy rates in
the prediction of the two indicators above, with also acceptable sensitivity and positive predictive value rates.
Feature selection significantly reduced the number of input features needed for prediction. Neural networks
and decision trees gave the best performance results, and the C4.5 algorithm achieved the highest accuracy
rate (∼ 81%) in the prediction of the granulation/devitalized ratio from a small number of input features.
1 INTRODUCTION
The European Pressure Ulcer Advisory Panel
(EPUAP) defines a pressure ulcer (PU) as an area
of localized damage to the skin and underlying tis-
sue caused by pressure, shear, friction and or a com-
bination of these (European Pressure Ulcer Advi-
sory Panel (EPUAP), 1999; Gawlitta et al., 2007).
The prevention, care and treatment of PU pathol-
ogy involve high costs for health services (Stratton
et al., 2003) and imply important consequences for
the health of the population. The prevalence of pres-
sure ulcer varies in different contexts. Diverse stud-
ies carried out among differentpopulations of patients
with home-care assistance or in acute care or long-
term units have produced prevalence rates ranging
from 7% to 33% (Zulkowski, 1999; Horn et al., 2002;
Gunningberg, 2004; Tannen et al., 2004; Woodbury
and Houghton, 2004). In a recent study, Landi et al.
(Landi et al., 2007) have evidenced that PUs are asso-
ciated with increased mortality rates, and Redelings
et al. (Redelings et al., 2005) have reported PUs as a
cause of death among 114,380 persons in the United
States between 1990 and 2001.
Precise evaluation of PUs constitutes a crucial task
for diagnosing, monitoring the evolution, and decid-
ing on care intervention and pharmacological treat-
ment to be arranged for each particular case. Clini-
5
J. Veredas F., Mesa H., C. Morilla J. and Morente L. (2010).
PREDICTING THE EVOLUTION OF PRESSURE ULCERS.
In Proceedings of the Third International Conference on Health Informatics, pages 5-12
DOI: 10.5220/0002690700050012
Copyright
c
SciTePress

cians evaluate and register the state of each PU using
classification systems (Kottner et al., 2009) which are
mainly based on the subjective visual inspection of
the wound. These systems aim at providing consistent
and accurate PU assessment that facilitates accurate
communication, precise documentation and health-
care decisions. Nevertheless, PU classification alone
is not sufficient to decide on pharmacological treat-
ment or health-care to be provided, and more accu-
rate and sensitive monitoring of the PU healing evolu-
tion is therefore needed. One of the most widespread
tools being used to determine the healing status of
a PU is the PUSH (Pressure Ulcer Scale for Heal-
ing) tool (National Pressure Ulcer Advisory Panel
et al., 2001), which is based on the visual detection
of four main tissue types —i.e. epithelial, granula-
tion, slough or necrosis (Sussman and Bates-Jensen,
2001)— together with the manual “gross“ estimation
of the wound area and the subjective perception of
oozing from the ulcer. Recent prospective studies
evaluating the PUSH tool, conclude that it can ac-
curately differentiate between healed and non-healed
ulcers, but some critical modifications must be done
to improve its value and sensitivity to PU changes
(G¨unes, 2009).
Recently, new principles have emerged which pro-
vide a systematic approach to the management of
wounds. The International Advisory Board on Wound
Bed Preparation has proposed TIME (Dowsett, 2008)
as a new paradigm for wound management that is
based on intervention in four clinical parameters: tis-
sue (T) non-viable or deficient, infection or inflam-
mation (I), moisture (M) imbalance, and epidermal
(E) margin. Considering the histology and physiol-
ogy of wound healing (Edsberg, 2007), parameters T
and E of TIME framework could suffice to have an
approach to wound healing state, so that I and M vari-
ables can directly be derived from the observation of
T and E. Granulation tissue (a fibrous connectivered-
dish tissue) is an indicator of the growth of new tissue
during wound healing: as the PU heals, devitalized
tissue (a yellowish oozing tissue caused by infection,
or a blackish necrotic tissue) is progressively replaced
with granulation tissue growing from the wound-bed
center to the periphery so that, finally, granulation
tissue reaches the wound-bed border and therefore
fills the whole wound-bed; then, the PU starts clos-
ing (Sussman and Bates-Jensen, 2001). Thus, param-
eter T of TIME paradigm regards to the proportion of
devitalized areas with respect to granulation tissue in
the wound-bed, whereas parameter E becomes an es-
timator of the likelihood of epithelial cells to migrate
from the wound-bed perimeter to the wound-bed cen-
ter during the epitelization process: this migration re-
quires granulation tissue to cover the wound-bed and
reach the wound-bed border with a highly vascular-
ized layer. Therefore, proliferation of granulation tis-
sue from the wound-bed center to the periphery di-
rectly implies the reduction of infection, inflamma-
tion and oozing from the wound. Furthermore, as
other authors recently addressed, more accurate pres-
sure ulcer evaluation and monitoring of the healing
stage could be achieved by measuring and precisely
locating all tissue types present in the wound or in
its surrounding areas (Veredas et al., 2009). Suppose
these measurements are computed and the significant
tissues are located, new sensitive and precise indica-
tors for evaluating the wound state can be designed.
Based on those new principles for the manage-
ment of wounds above, in this study PU digital images
have been taken, preprocessed and segmented, and
computer assisted marking and tissue classification
have been done by expert clinicians. Our computer-
based image-processing strategy has been used to ob-
tain two new sensitive indicators of the wound heal-
ing state which are closely connected with parame-
ters T and E of TIME paradigm: 1) the ratio gran-
ulation/devitalized tissue, and 2) the proportion of
the wound-bed border consisting of granulation tis-
sue. Subsequently, we have used diverse machine-
learning (ML) approaches to design predictive sys-
tems to independently predict the sign of the evo-
lution, in one-week interval, of these two indicators
above. As histological and clinical studies shown,
increase of either the granulation/devitalized ratio or
the proportion of granulation tissue in the wound-bed
border reveals significant clinical improvement of the
PU global state (Sussman and Bates-Jensen, 2001;
Dowsett, 2008). Predicting the positive or negative
tendency of these changes in the proportion and lo-
cation of PU tissues helps the effective management
of health resources and planning of pharmacological
treatment and health-care decisions.
2 METHODOLOGY
Our methodology to predict the evolution of PUs is
based on local features obtained from PU digital color
images. These images had to be firstly acquired and
subsequently processed, segmented and labeled to ob-
tain precise area measurement of all significant tis-
sues and regions present in the wound. These features
are subsequently used to design predictive systems to
forecast the evolution of the PU for a time interval
of a week. Different ML approaches have been used
in this study to design these predictive systems, with
different performance rates obtained.
HEALTHINF 2010 - International Conference on Health Informatics
6

2.1 Image Acquisition and Processing
A sample of 69 sacrum and hip PUs (stages III and
IV) from patients with home-care assistance (mean
age 80.5 ± 12.3 years) was weekly photographed,
registered and assessed until healing, transfer, patient
death, or end of study for a maximum of 16 weeks.
These PUs were photographed in uncontrolled light-
ing conditions using a Sony Cybershot
R
W30 digital
camera. The images were taken with a flashlight to
obtain the best quality images possible, and at a dis-
tance of approximately 30 − 40cm from the wound
plane. To minimize the margin of error, the camera
lens is oriented in parallel to the plane of the wound.
Macro-focusing was used to ensure well-focused pic-
tures within these short distances. A 1cm
2
-sized nor-
malized white square paper patch was placed on the
right top corner of each picture, which is used to esti-
mate the dimensions of the wound and tissues. A total
743 photographs were finally obtained.
Our methodology for PU evaluation is based on
the detection and measurement of the area of the most
significant tissue types in the PU, i.e. skin, healing,
granulation, slough and necrosis. The PU images ac-
quired were automatically segmented using a segmen-
tation technique known as mean shift procedure (Co-
maniciu and Meer, 2002). The mean shift has demon-
strated to be a very reliable approach to image seg-
mentation and has shown its efficiency in many vision
tasks (Comaniciu and Meer, 2002) such us wound
image segmentation (Wannous et al., 2007; Veredas
et al., 2009). PU images show very heterogeneous
colorations, imprecise and vague boundaries, which
make most image segmentation techniques fail. For
this reason, PU segmentation benefits from the main
characteristic of the mean shift approach: the preser-
vation of the borders of the regions resulting from the
segmentation process. In our study, a mean of 150
regions per image were obtained from the application
of the mean shift segmentation approach to the set of
743 PU images.
For this work, an ad hoc graphical user inter-
face (called PULAB, Pressure Ulcer LABoratory) was
specifically developed to deal with the wearisome
task of “manually” labeling the whole set of regions
from the segmented wound images (Veredas et al.,
2009). PULAB software resulted from a previous
phase of this same research project, and internally
consists of a computational intelligence core based on
a ML hybrid-learning approach to automatically rec-
ognize PU tissues in segmented PU images, with high
accuracy rates. PULAB has been used to have an ini-
tial approach to tissue classification in the 743 images
of this study. Subsequently, a collaborative group of
5 expert clinicians from the Health Service of M
´
alaga
Province supervised that classification and assigned
the definitive label —i.e. skin, healing, granulation,
slough and necrosis— to each one of the segmented
regions in the images. For each segmented region,
its final label was assigned by a voting process, so
that the tissue class with the largest number of votes
was assigned to that segmented region. For some un-
clear or ambiguous regions, some later discussion was
required to achieve a final agreement on the tissue
type those regions consisted of. This way, precise tis-
sue classification for PU evaluation is achieved. The
1cm
2
square marker is also detected in each image
and labeled by the experts, and it is subsequently used
to convert the tissue area measures from pixel units
to standard measurement units (mm
2
). PULAB soft-
ware dramatically reduced the time consumed during
the wearisome process of marking and classifying the
segmented regions in the images. Figure 1 shows an
example of a PU ulcer image of our study which has
been automatically segmented and manually labeled
by the group of expert clinicians.
From these labeled regions in the images, the area
of each of the PU tissue types is measured and ex-
pressed in standard units by using the normalized
square marker. This way, the area of skin, healing
tissue, necrosis, slough, granulation and wound-bed
(i.e. granulation + slough + necrosis) can be calcu-
lated. These area measures and their combinations
(see next section) are the variables used in the design
of the predictive systems for PU evolution based on
ML approaches.
2.2 Pressure Ulcer Local Features
The initial set of local PU features consists of 46 fea-
tures and includes three different types of character-
istics obtained from the analysis of the distribution of
the tissue types in the ulcer: absolute, relative, and
differential descriptors.
Absolute features are the areas of the different tis-
sue types and significant regions in the image: healing
tissue (A
heal
), granulation (A
gran
), slough (A
slough
),
necrosis (A
nec
), wound-bed (A
wound
), i.e. granula-
tion + slough + necrosis, and the entire PU (A
pu
),
i.e. wound-bed + healing tissue, in squared millime-
ters, calculated by approximating the area of the tis-
sues from the measurement of the reference area of
the 1cm
2
-sized square marker.
Relative descriptors are obtained by considering
the relative distribution of the tissues in the wound-
bed and the perimeter of the wound-bed:
• Proportion of granulation (P
gran
= A
gran
/A
wound
),
slough (P
slough
= A
slough
/A
wound
), necrosis (P
nec
=
PREDICTING THE EVOLUTION OF PRESSURE ULCERS
7

skin
necrosis
A
CB
healing
slough
granulation
marker
Figure 1: Example of region segmentation (figure B) and labeling (figure C) for a PU image (the original unprocessed image
is shown in A). In figure C, all the regions with the same label (i.e. the same tissue type) are given a similar pseudo-color that
is calculated as an average of the colors from these regions in the image.
A
nec
/A
wound
) and devitalized tissues (P
dev
=
A
dev
/A
wound
), i.e. slough and necrosis, in the
wound-bed.
• Percentage of the wound-bed perimeter consisted
of granulation tissue (P
gran per
). This is an impor-
tant feature, because it is used as one of the indica-
tors of the wound state. This feature is computed
as follows:
1. Once the tissues in the image have been labeled
by the experts, a binary image is obtained by
distinguishing between wound-bed (i.e. granu-
lation, slough and necrosis) and periulcer (i.e.
healing tissue and skin).
2. The contour of the wound-bed area is com-
puted.
3. The number of pixels in the contour is calcu-
lated.
4. The percentage of pixels in the wound-bed con-
tour which are labeled as granulation gives us
the descriptor P
gran per
.
• Ratio between granulation and devitalized tissues
(R
gran−dev
= (1 + A
gran
)/(1 + A
dev
)) (1 is added
to both terms in the division to avoid indetermi-
nation). In this paper, it is considered as another
indicator of the wound state.
• Ratio between wound-bed tissues and the
whole PU (i.e. wound-bed + healing tissue)
(R
wound− pu
= (1+ A
wound
)/(1+ A
pu
)) (1 is again
added to both terms in the division to avoid
indetermination).
Finally, differential descriptors compute the vari-
ation between the same parameter in two one-week
separated measures (t and t − 1):
• One-week difference for all the absolute and rel-
ative features above, such as the areas of the dif-
ferent tissues (∆A
gran
(t) = A
gran
(t) −A
gran
(t − 1),
∆A
slough
(t) = .. ., etc.) or the relative propor-
tion of the tissues in the wound-bed (∆P
gran
(t) =
P
gran
(t) − P
gran
(t − 1), ∆P
slough
(t) = . .., etc.).
• Ratios between the one-week differences above
and the absolute areas of reference for each tissue
type (R
∆A
gran
(t) = ∆A
gran
(t)/(1 + A
gran
(t − 1)),
R
∆A
slough
= ..., etc.). (1 is added to the denomi-
nator to avoid indetermination).
• Ratios between the one-week differ-
ences above and the wound-bed area
(R
∆P
gran
(t) = ∆A
gran
(t)/(1 + A
wound
(t − 1)),
R
∆P
slough
= .. ., etc.). (1 is added to the denomina-
tor to avoid indetermination).
• Two specially important descriptors are: 1)
the difference of proportion of granulation
in the wound-bed perimeter, ∆P
gran per
(t) =
P
gran per
(t) − P
gran per
(t − 1), and 2) the differ-
ence of ratio of granulation and devitalized tis-
sues: ∆R
gran−dev
(t) = R
gran−dev
(t)−R
gran−dev
(t−
1). The signs of these two features are the vari-
ables to be predicted (see next subsection).
• One-week difference of the ratio between
wound-bed area and PU area (∆R
wound− pu
(t) =
R
wound− pu
(t) − R
wound− pu
(t − 1)).
2.3 Predicting the Wound State
Starting from the 46 features above, measured at two
time instants, t (i.e. “this current week”) and t − 1
(i.e. “the week before”), giving a total 92 features,
the predictivesystems are designed to predict the sign,
i.e. the positive (improvement) or negative (worsen-
ing) change, of these two differential parameters for
PU evaluation, ∆P
gran per
(·) and ∆R
gran−dev
(·), at time
t + 1 (i.e. “next week”).
To predict the sign of the change of wound-bed
perimeter consisting of granulation tissue, the follow-
ing binary function S
1
(t) is defined:
HEALTHINF 2010 - International Conference on Health Informatics
8

S
1
(t) =
1 if ∆P
gran per
(t) > 0
∨(∆P
gran per
(t) = 0
∧∆P
gran per
(t − 1) < 0),
−1 otherwise
(1)
In our database of 743 weekly-acquired PU im-
ages, 54% gave -1 and 46% gave 1 for this S
1
(t) func-
tion.
On the other hand, to predict the sign of the
change of the granulation/devitalized ratio in the
wound-bed, a similar binary function is used:
S
2
(t) =
1 if ∆R
gran−dev
(t) > 0
∨(∆R
gran−dev
(t) = 0
∧∆R
gran−dev
(t − 1) < 0),
−1 otherwise
(2)
In our database of 743 weekly-acquired PU im-
ages, 61% gave -1 and 39% gave 1 for this S
2
(t) func-
tion.
2.4 Machine Learning Approaches
Different supervised ML approaches have been used
in this study to compare their performance for pre-
dicting the evolution of PUs. These approaches
include support vector machines (SVM), adaptive
boosting (AdaBoost), linear discriminant analysis,
naive Bayes classifiers, neural networks (multi-layer
perceptrons) and decision trees, but only a group of
these approaches —SVMs, MLPs, Bayes classifiers
and decision trees— gave us high performance re-
sults (accuracy ∼ 70%) when applied to our predic-
tive problem.
On one hand, SVMs are a set of supervised-
learning methods which have been successfully used
in classification and regression problems. In classifi-
cation tasks, such as tissue recognition on wound im-
ages, the SVMs work by building separation hyper-
planes in the space, so that the margin between the
different data classes is maximized (Drucker et al.,
1997). On the other hand, naive Bayes classi-
fiers are probabilistic classifiers based on the appli-
cation of Bayes’ theorem with strong independence
assumptions, and have recently demonstrated their
high efficiency rates in solving classification prob-
lems (Zhang, 2004). Multilayer perceptrons (MLP)
are feed-forward networks with a set of sensory units
(input neurons), one or more hidden layers of compu-
tation nodes and an output layer, which have been ap-
plied successfully to solve some difficult and diverse
problem, such us pattern recognition, classification,
regression or prediction, by training them with the
back-propagation algorithm (Haykin, 1999). In the
interests of this study, MLPs with one hidden layer
and a different number of neurons in this hidden layer
have been used and tested. The results from the ar-
chitectures which did the best for prediction are pre-
sented in next section (tables 1 and 2). Finally, a de-
cision tree can be defined as a tree in which each in-
ternal node represents a choice between a number of
alternatives, and each terminal node is marked by a
classification. Decision trees are potentially powerful
predictors and provide an explicit concept description
for a dataset. Standard decision tree learners such as
C4.5 (Quinlan, 1993) expand nodes in depth-first or-
der, while in best-first decision tree (BFT) learners the
“best” node is expanded first (Shi, 2007). On the other
hand, alternating decision trees (ADT) are a gener-
alization of decision trees, voted decision trees and
voted decision stumps, and use a learning algorithm
that is based on boosting (Freund and Mason, 1999).
In this work, RapidMiner (Mierswa et al., 2006)
has been used to do feature selection for each one of
the ML approaches tested for prediction. The Fea-
tureSelection operator of RapidMiner uses the two de-
terministic greedy feature selection algorithms, for-
ward selection and backward elimination, but adds
some enhancements to these standard algorithms.
Moreover, k(=10)-folds stratified cross-validation has
been used for this feature selection process.
3 RESULTS
In this section, performance results are presented
from the machine-learning approaches which gave
the best efficiency rates in predicting S
1
(t + 1) and
S
2
(t + 1) (see equations 1 and 2), i.e. the sign of the
change in one-week interval (t + 1) of our two de-
scriptors designed for PU evaluation. Starting from
46 different input features (see section 2.2) at time t
(“the current week”) and t − 1 (“a week ago”), i.e.
92 total input descriptors, feature selection (Mierswa
et al., 2006) has been applied on each specific ML
approach which has been implemented and tested as
a predictive system of the future tendency (i.e. the
sign) of our two variables that assess the wound state:
1) the proportion of wound-bed perimeter consisting
of granulation tissue ∆P
gran per
(t + 1) (see equation
1) and 2) the ratio between granulation and devital-
ized tissue ∆R
gran−dev
(t + 1) (see equation 2). Fea-
ture selection significantly reduces the number of in-
put descriptors for each one of the ML predictive sys-
tems designed. All these ML approaches were trained
using both 10-fold and leave-one-out cross-validation
strategies. The results from the leave-one-out cross-
validation are shown in tables 1 and 2. (Training with
10-fold cross-validation gave us slightly higher per-
PREDICTING THE EVOLUTION OF PRESSURE ULCERS
9
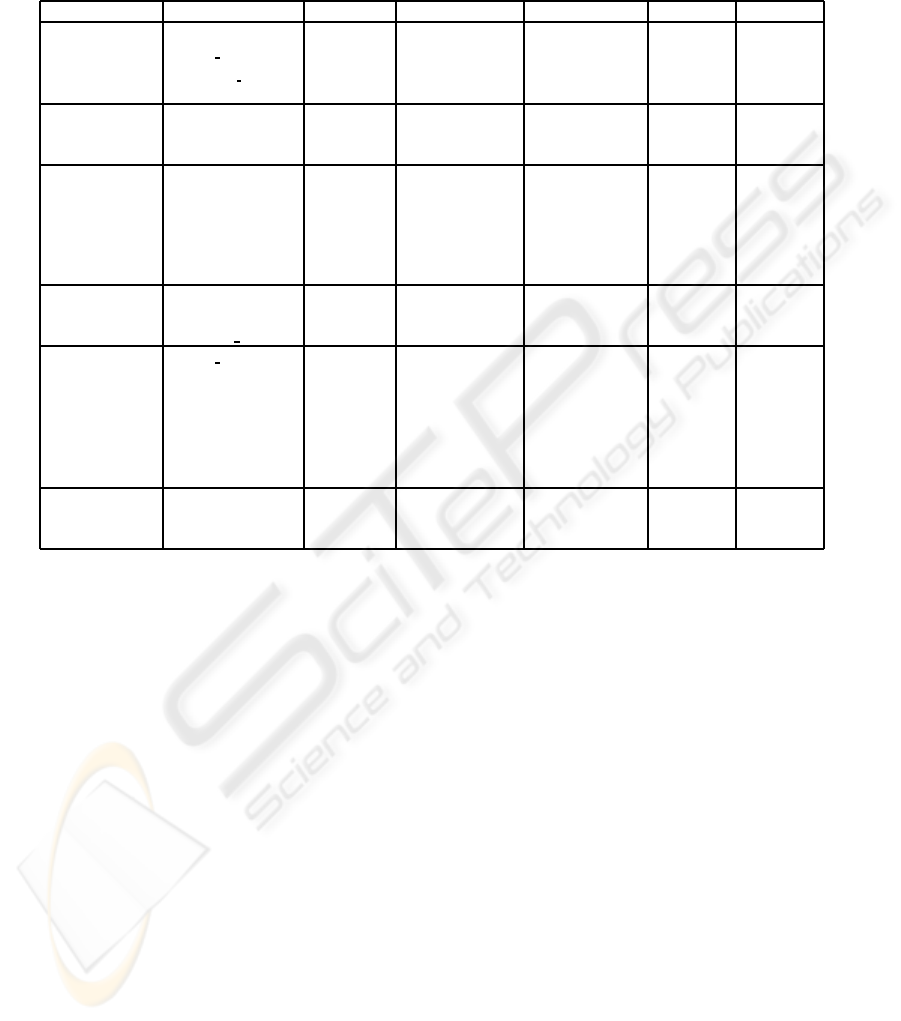
Table 1: Performance results from ML approaches with leave-one-out crossvalidation —Naive Bayes classifier, SVM, MLP
with 2 neurons (h=2) in the hidden layer, and decision tree based algorithms (ADT, BFT and C4.5)— for predicting S
1
(t+ 1)
(equation 1). The features resulting from the Feature Selection (FS) process are shown. Performance results shown are
accuracy, sensitivity and positive predictive value (PPV) for both the two likely predicted signs of change (-1 and 1). See
section 2.2 for notation.
ML Approach FS Accuracy Sensitivity (-1) Sensitivity (1) PPV (-1) PPV (-1)
Naive Bayes A
wound
(t − 1) 68.38% 76.81% 58.48% 68.47% 68.23%
P
gran per
(t − 1)
R
∆P
gran per
(t)
∆R
gran−dev
(t)
SVM P
dev
(t − 1) 68.38% 68.82% 67.86% 71.54% 64.96%
R
gran−dev
(t − 1)
R
gran−dev
(t)
MLP (h=2) R
gran−dev
(t − 1) 72.07% 72.62% 71.43% 74.90% 68.97%
R
gran−dev
(t)
A
gran
(t)
P
dev
(t)
∆P
dev
(t)
R
∆A
dev
(t)
ADT A
dev
(t) 68.38% 62.36% 75.89% 76.82% 66.93%
∆R
wound−pu
(t)
∆P
gran per
(t)
BFT P
gran per
(t − 1) 74.13% 61.98% 88.39% 86.24% 66.44%
A
wound
(t)
A
heal
(t)
P
gran
(t)
R
∆A
gran
(t)
∆R
gran−dev
(t)
R
∆P
nec
(t)
C4.5 R
gran−dev
(t − 1) 72.69% 64.64% 82.14% 80.95% 66.43%
A
wound
(t)
P
dev
(t)
formance results than the ones in these tables, but they
are not shown here because k-fold cross-validation
suffers from bias derived from the dataset split.)
3.1 Predicting Granulation in Perimeter
In table 1, the performance results from the ML ap-
proaches to predict S
1
(t + 1) (see equation 1), i.e.
the one-week increase or decrease in the proportion
of granulation tissue in the wound-bed perimeter, are
shown. The highest accuracy rate has been obtained
with the BFT algorithm, but it needs the largest num-
ber of input parameters. As it is shown in table 1, C4.5
algorithm also achieves a high accuracy rate (∼ 73%)
with a reduced set of 3 input features. ADT is the
only method which has not required any features at
time t − 1 in this experiment.
3.2 Predicting Granulation-Devitalized
Ratio
In table 2, the performance results from the machine-
learning approaches to predict S
2
(t + 1) (see equation
2), i.e. the one-week increase or decrease in the ratio
between granulation and devitalized tissue are shown.
Decision trees with the C4.5 algorithm gave the best
accuracy results (80.9%), with also very high sensi-
tivity and positive predictive value rates obtained. It
also uses a reduced number of 5 input parameters at
t (i.e. features at t − 1 are not needed in this case) to
obtain these performance results of table 2. As in the
case of predicting S
1
(t + 1), ADT achieves good per-
formance results with the most reduced input feature
set.
4 CONCLUSIONS
Machine learning approaches to predict the evolution
of PU have been designed and presented in this pa-
per. These predictive systems have been based on
the local characteristics extracted from digital PU im-
ages, which consisted of location and tissue area mea-
surements. Images of a group of patients with hip or
sacrum PUs were weekly taken in uncontrolled light-
ing conditions. These images were automatically seg-
HEALTHINF 2010 - International Conference on Health Informatics
10
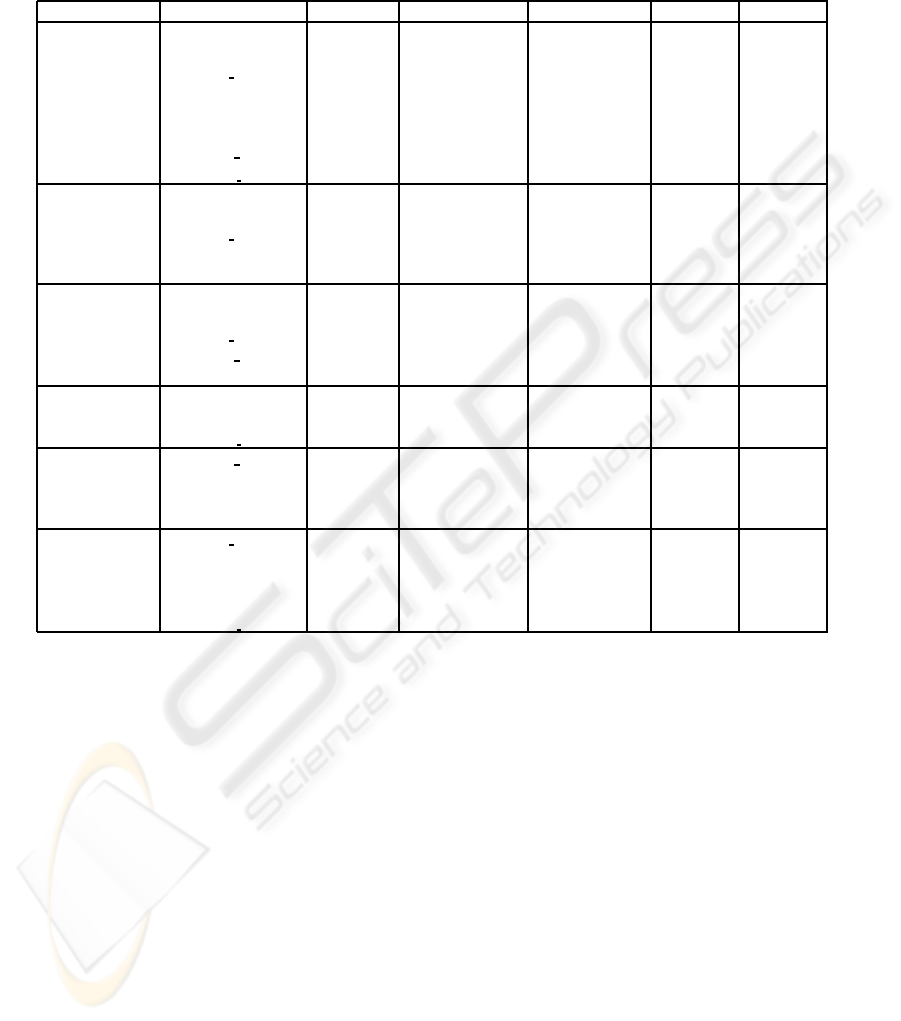
Table 2: Performance results from ML approaches with leave-one-out crossvalidation —Naive Bayes, SVM, MLP with
4 neurons (h=4) in the hidden layer, and decision tree based algorithms (ADT, BFT and C4.5)— for predicting S
2
(t + 1)
(equation 2). The features resulting from the Feature Selection (FS) process are shown. Performance results shown are
accuracy, sensitivity and positive predictive value (PPV) for both the two likely predicted signs of change (-1 and 1). See
section 2.2 for notation.
ML Approach FS Accuracy Sensitivity (-1) Sensitivity (1) PPV (-1) PPV (-1)
Naive Bayes R
wound−pu
(t − 1) 74.95% 87.29% 55.32% 75.65% 73.24%
A
heal
(t)
P
gran per
(t)
R
∆A
wound
(t)
R
∆P
nec
(t)
R
wound−pu
(t)
∆P
gran per
(t)
R
∆P
gran per
(t)
SVM P
dev
(t − 1) 75.98% 79.26% 70.74% 81.16% 68.21%
R
gran−dev
(t − 1)
P
gran per
(t)
∆A
nec
(t)
R
∆P
nec
(t)
MLP (h=4) P
gran
(t) 77.82% 74.92% 82.45% 87.16% 67.39%
P
nec
(t)
P
gran per
(t)
∆P
gran per
(t)
R
∆P
slough
(t)
ADT A
dev
(t) 75.15% 81.94% 64.36% 78.53% 69.14%
A
nec
(t − 1)
R
∆P
gran per
(t)
BFT ∆P
gran per
(t) 76.39% 81.27% 68.62% 80.46% 69.73%
R
∆A
dev
(t)
R
∆P
dev
(t)
∆A
slough
(t)
C4.5 P
gran per
(t) 80.90% 77.56% 86.17% 89.92% 70.74%
R
gran−dev
(t)
R
∆P
gran
(t)
R
∆P
nec
(t)
R
∆P
gran per
(t)
mented by the mean shift procedure and manually la-
beled by a group of expert clinicians with the help of
an ad-hoc intelligent graphical user interface for PU
tissue classification. The after-one-week tendency of
two different indicators for pressure ulcer evaluation
is predicted: the ratio between granulation and devi-
talized tissue, and the percentage of wound-bed bor-
der consisting of granulation tissue.
Of the tens of machine learning approaches and
architectures tested in this study, support vector ma-
chines, naive Bayes classifiers, neural networks and
decision trees achieved the highest accuracy rates in
the prediction of those two PU-state indicators, giv-
ing also acceptable sensitivity and positive predic-
tive value rates. Feature selection significantly re-
duced the number of input features needed for pre-
diction. Decision trees gave the best performance re-
sults, as the C4.5 algorithm achieved the highest ac-
curacy rate (∼ 81%) in the prediction of the granu-
lation/devitalized ratio from a small number of input
features. Finally, multi-layer perceptrons also showed
their appropriateness for these prediction tasks and
gave performance rates similar to the ones obtained
with decision trees.
These results show that predicting the positive or
negative tendency of the changes in the proportion or
location of wound tissues can be reliably achieved by
machine learning approaches such as decision trees or
neural networks. Clinicians are now supplied with a
predictive tool which can be used to estimate the evo-
lution of pressure ulcers and helps the effective man-
agement of health resources and planning of pharma-
cological treatment and health-care decisions.
ACKNOWLEDGEMENTS
This research has been funded by the Spanish Plan
Nacional de Investigaci
´
on Cient
´
ıfica, Desarrollo e
Innovaci
´
on Tecnol
´
ogica (I+D+I), Instituto de Salud
PREDICTING THE EVOLUTION OF PRESSURE ULCERS
11

Carlos III-Subdirecci
´
on General de Evaluaci
´
on y Fo-
mento de la Investigaci
´
on, project id. PIO60131, and
Consejera de Salud, Servicio Andaluz de Salud, Junta
de Andaluc
´
ıa, project id. PI-0197/2007.
REFERENCES
Comaniciu, D. and Meer, P. (2002). Mean shift: A robust
approach toward feature space analysis. IEEE Trans.
Pattern Analysis Machine Intell., 24(5):603–619.
Dowsett, C. (2008). Using the TIME framework in wound
bed preparation. Br J Community Nurs, 13(6):S15–6,
S18, S20 passim.
Drucker, H., Burges, C. J., Kaufman, L., Smola, A., and
Vapnik, V. (1997). Support vector regression ma-
chines. Advances in Neural Information Processing
Systems, 9:155–161.
Edsberg, L. E. (2007). Pressure ulcer tissue histology: An
appraisal of current knowledge. Ostomy/Wound Man-
agement, 53(10):40–49.
European Pressure Ulcer Advisory Panel (EPUAP) (1999).
Guidelines on treatment of pressure ulcers. EPUAP
Review, 1:31–33.
Freund, Y. and Mason, L. (1999). The alternating decision
tree algorithm. In Proceedings of the 16th Interna-
tional Conference on Machine Learning.
Gawlitta, D., Li, W., Oomens, C. W. J., Baaijens, F. P. T.,
Bader, D. L., and Bouten, C. V. C. (2007). The rela-
tive contributions of compression and hypoxia to de-
velopment of muscle tissue damage: An in vitro study.
Annals of Biomedical Engineering, 35(2):273–284.
G¨unes, U. Y. (2009). A prospective study evaluating the
Pressure Ulcer Scale for Healing to assess stage II,
stage III, and stage IV pressure ulcers. Ostomy Wound
Management, 55(5):48–52.
Gunningberg, L. (2004). Risk, prevalence and prevention
of pressure ulcers in three swedish healthcare settings.
Journal of Wound Care, 13(7):286–290.
Haykin, S. (1999). Neural networks a comprehesive foun-
dation. Prentice Hall, New Jersey, USA, second edi-
tion.
Horn, S. D., Bender, S. A., Bergstrom, N., Cook, A. S.,
Ferguson, M. L., Rimmasch, H. L., Sharkey, S. S.,
Smout, R. J., Taler, G. A., and Voss, A. C. (2002).
Description of the national pressure ulcer long-term
care study. Journal of the American Geriatrics Soci-
ety, 50(11):1816–1825.
Kottner, J., Raeder, K., Halfens, R., and Dassen, T. (2009).
A systematic review of interrater reliability of pres-
sure ulcer classification systems. Journal of Clinical
Nursing, 18(3):315–336.
Landi, F., Onder, G., Russo, A., and Bernabei, R. (2007).
Pressure ulcer and mortality in frail elderly people liv-
ing in community. Archives of Gerontology and Geri-
atrics, 44(Supplement 1):217 – 223.
Mierswa, I., Wurst, M., Klinkenberg, R., Scholz, M., and
Euler, T. (2006). Yale: Rapid prototyping for com-
plex data mining tasks. In Ungar, L., Craven, M.,
Gunopulos, D., and Eliassi-Rad, T., editors, KDD ’06:
Proceedings of the 12th ACM SIGKDD International
Conference on Knowledge Discovery and Data Min-
ing, pages 935–940, New York, NY, USA. ACM.
National Pressure Ulcer Advisory Panel, Cuddigan, J.,
Ayello, E., and Sussman, C., editors (2001). Pressure
ulcers in America: Prevalence, incidence, and impli-
cations for the future. Reston, VA: NPUAP.
Quinlan, R. (1993). C4.5: Programs for Machine Learning.
Morgan Kaufmann Publishers.
Redelings, M. D., Lee, N. E., and Sorvillo, F. (2005). Pres-
sure ulcers: More lethal than we thought? Advances
in Skin & Wound Care, 18(7):367–372.
Shi, H. (2007). Best-first decision tree learning. PhD thesis,
University of Waikato, Hamilton, NZ. COMP594.
Stratton, R., Green, C., and Elia, M. (2003). Disease-
related Malnutrition: An evidence-based approach
to treatment. CABI Publishing, Wallingford, United
Kingdom.
Sussman, C. and Bates-Jensen, B., editors (2001). Wound
Care: A Collaborative Practice Manual for Physi-
cal Therapists and Nurses. Lippincott Williams &
Wilkins.
Tannen, A., Dassen, T., Bours, G., and Halfens, R. (2004).
A comparison of pressure ulcer prevalence: concerted
data collection in the netherlands and germany. Inter-
national Journal of Nursing Studies, 41(6):607–612.
Veredas, F. J., Mesa, H., and Morente, L. (2009). A hybrid
learning approach to tissue recognition in wound im-
ages. International Journal of Intelligent Computing
and Cybernetics, 2(2):327–347.
Wannous, H., Treuillet, S., and Lucas, Y. (2007). Su-
pervised tissue classification from color images for a
complete wound assessment tool. In Proceedings of
the 29th Annual International Conference of the IEEE
EMBS, pages 6031–6034, Cit Internationale, Lyon,
France.
Woodbury, M. and Houghton, P. (2004). Prevalence of pres-
sure ulcers in canadian healthcare settings. Ostomy
Wound Management, 50(10):22–38.
Zhang, H. (2004). The optimality of Nave Bayes. In Proc.
17th Internat. FLAIRS Conf., pages 562–567, Florida,
USA.
Zulkowski, K. (1999). MDS+ items not contained in the
pressure ulcer RAP associated with pressure ulcer
prevalence in newly institutionalized elderly. Ostomy
Wound Management, 45(1):24–33.
HEALTHINF 2010 - International Conference on Health Informatics
12
