
SYNTHESIZED CARDIAC WAVEFORM IN THE EVALUATION
OF AUGMENTATION INDEX ALGORITHMS
Case Study for a New Wavelet based Algorithm
Vânia Almeida, Tânia Pereira, Elisabeth Borges, Edite Figueiras, João Cardoso, Carlos Correia
Instrumentation Center, Physics Department, University of Coimbra, R Larga, Coimbra, Portugal
Helena Catarina Pereira, José Luís Malaquias, J. Basílio Simões
ISA – Inteligent Sensing Anywhere and Instrumentation Center, Physics Department
University of Coimbra, R Larga, Coimbra, Portugal
Keywords: Augmentation index, Arterial blood pressure, Wavelets, Probability density function.
Abstract: We developed and tested the performance of a new wavelet based algorithm for Augmentation Index (AIx)
determination. The evaluation method relies on reference cardiac-like pulses that are synthesized using a
weighted combination of exponentially shaped sub-pulses that represent the three main components of real
pulses: the systolic stroke, its reflected replica and the carotid reservoir or windkessel effect. The pulses are
parameterized so as to reproduce the main types of cardiac waveforms. The values of AIx yielded by the
new algorithm are compared with the ones computed directly from the synthesized waveform and with the
values produced by standard Probability Density Function (PDF) analysis.
1 INTRODUCTION
It has become commonly recognized that, in
addition to the the traditional systolic/diastolic
pressure values, the morphology arterial pressure
waveform (APW) bears a great deal of clinically
relevant information.
As a consequence, a trend has emerged inside the
hemodynamics research community to extract this
information using non-invasive techniques that can
circunvent catheterization. Along the years, this
quest opened new fields of investigation in sensoring
techniques and algorithms capable of faithfuly
rendering the APW from signals collected at the
major artery sites (carotid, brachial, femural and
radial, mainly) .
On the algorithm side, major areas of interest are
under developement to extract information from the
APW, reflecting the relevance of the clinical
parameters they address. Focus on themes such as
wave intensity analysis, wave separation,
augmentation index, cardiac output have been
studied by several authors over the last few years.
Interfacing between signal acquisition and
algorithm development, the search for efficient
transfer functions capable of rendering the central
APW from peripheral data (Hope et al., 2004)
remains an important theme of debate with some
authors advocating its accuracy (Chen et al., 1997
and McConnel et al., 2004) while others show some
caution (Hope et al., 2002; Hope et al., 2004).
In addition to these two major areas – APW
acquisition and algorithm development – new areas
of interest have also emerged collaterally along the
last few years.
Bench testing is an examle. It plays a
fundamental role in reproducing one or more
features of the arterial system (Khir and Parker,
2002; Feng and Khir 2007; Hermeling et al., 2007)
with high enough repeatibility, for testing both,
sensoring devices and algorithm performance.
Arterial modeling, as another example, has also
developed in a multitude of forms. From blood flow
and pressure in arteries (Olufsen, 1999) to pulse
synthesis (Rubins,
2008), modeling always shows the
possibility of bringing new insights to the problems
in study.
385
Almeida V., Pereira T., Borges E., Figueiras E., Cardoso J., Correia C., Catarina Pereira H., Luís Malaquias J. and Basílio Simões J. (2010).
SYNTHESIZED CARDIAC WAVEFORM IN THE EVALUATION OF AUGMENTATION INDEX ALGORITHMS - Case Study for a New Wavelet based
Algorithm.
In Proceedings of the Third International Conference on Bio-inspired Systems and Signal Processing, pages 385-388
DOI: 10.5220/0002691703850388
Copyright
c
SciTePress
The use of the wavelet transform in extracting
information from the APW has emerged as a
preferred tool due to its decomposition properties
(De Melis et al., 2007). Following this trend, this
work focus on studying the performance of a new
wavelet based algorithm developed for determining
AIx and explores the virtues of modeling APW with
a simple mathematical expression using filtered
exponential functions.
2 CARDIAC PULSE SYNTHESIS
The usefulness of synthesizing cardiac-like
waveforms is associated to their adquacy in playing
the role of reference signal for the algorithms under
test.
We synthesize the cardiac-like pulse, c(t), by
summing three exponentially shaped sub-pulses that
represent the components of the cardiac waveform
with a physiological meaning: the systolic stroke, its
reflected replica and the aortic reservoir or
windkessel effect. Each sub-pulse is build up with
two exponentials that account for the rising and
falling edges, respectively.
The general expression of the synthesized pulse
is
(1)
(1)where A
k
is the amplitude D
Rk
and D
Fk
are the delays of exponential rising and exponential
falling, respectively ,τ
Rk
and
τ
Fk
are the rising and
falling exponential time constants for systole (k=1),
reflection (k=2) and windkessel effect (k=3).
Prior to summing, the sub-pulses are submitted
to a moving average filtering process in order to
smooth the corners that, otherwise, would show up
in c(t) .
3 AUGMENTATION INDEX
The index evaluated along this work, AIx, carries an
important and very intuitive physiological meaning
as an index of arterial condition in general, and of
arterial stiffness in particular.
3.1 Definition
The main purpose of AIx is to quantify the
augmentation of the systolic pressure peak (SPP)
imparted to the APW by the reflected, or backward
propagating, wave.
The commonly accepted definition of AIx is
given by the quotient
, where P
S
is the
APW peak pressure, P
i
its pressure at the inflection
and P
D
is the diastolic blood pressure.
The definition is extended by arbitrarily
considering as negative the values of AIx obtained
when the reflected wave arrives after the systolic
peak (Murgo et al., 1980). For computational
purposes, these values of AIx are given by
.
3.1.1 Misleading Situations
The prognostic value of AIx in clinical practice has
not yet reached its full potential (Swillens and
Segers, 2008). This can be a consequence of the
compounding nature of its definition.
For one, the physiological meaning of AIx would
be better served by the formula
,
where P is the increment in pressure imparted to P
D
by the systolic stroke alone, making it clear that P is
the one that can be augmented. Only the fact that P
is unknown (or, at least, very hard to come by)
justifies the adopted simplification of taking P
i
instead.
Secondly, the signal convention mentioned
above can be misleading. In fact, when the reflected
wave arrives shortly after the SPP, the formula
yields a negative AIx but, nevertheless, physical
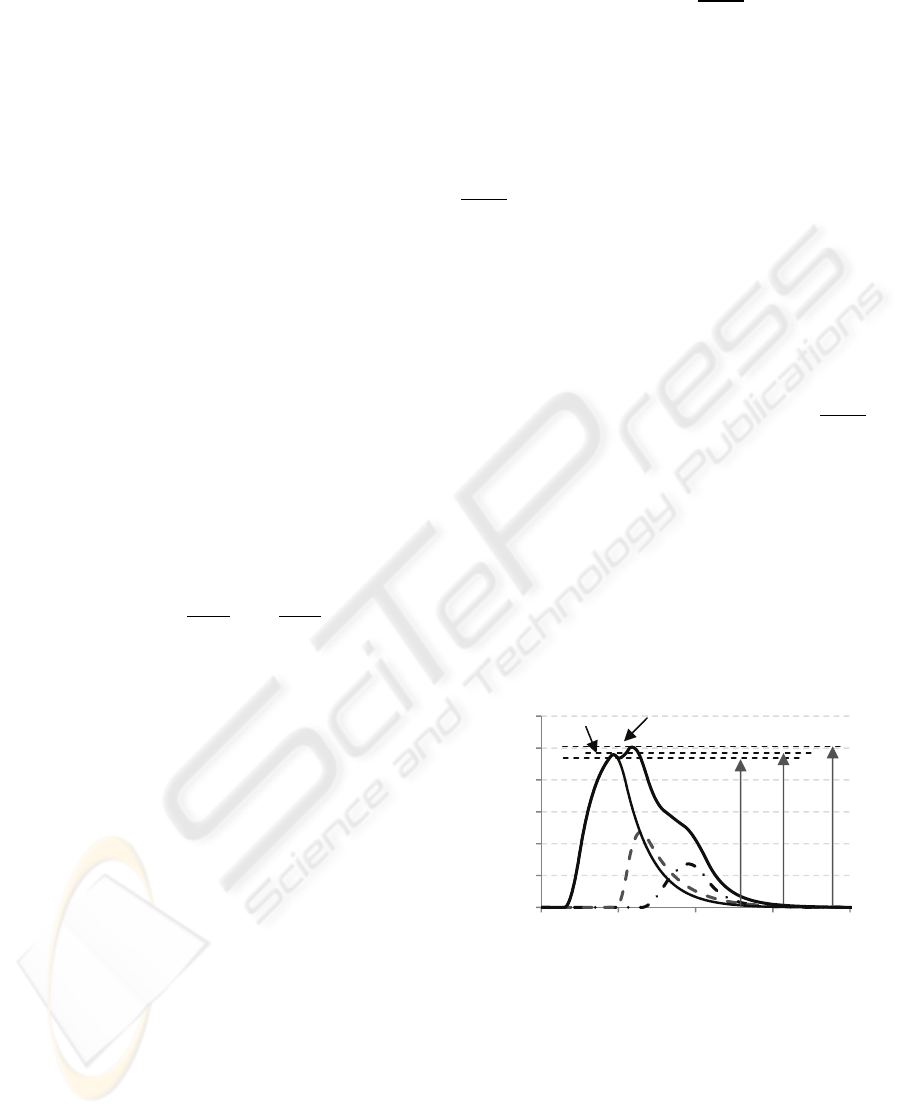
augmentation still occurs, as represented in figure 1.
Figure 1: Example of a cardiac waveform where the time
of arrival of the reflected wave occurs shortly after
systolic peak.
Thin solid line – systolic pressure wave, Dashed line –
reflected wave, Dash-point line – windkessel effect, Thick
solid line – APW, P
S
- APW peak pressure, P
i
- pressure at
inflection, P
D
- diastolic pressure and P- increment in
pressure imparted to P
D
by the systolic stroke alone.
0,0
0,2
0,4
0,6
0,8
1,0
1,2
0,0 0,2 0,4 0,6 0,8
Ammplitude (a.u.)
Time (s)
BIOSIGNALS 2010 - International Conference on Bio-inspired Systems and Signal Processing
386
4 ALGORITHM EVALUATION
The key feature of any algorithm for determining
AIx is its ability to precisely identify the inflection
point associated to the arrival of the reflected wave.
Evaluation is made by building up a set of
waveforms, obtained by gradually varying one of its
parameters, in such a way that a range of interesting
conditions are swept. In practice, this range of
“interesting conditions” must include the limit case
where the time of arrival of the reflected wave
coincides with the systolic peak. This critical
transition from positive to negative values of AIx,
the so called type A to type C (Murgo et al., 1980)
waveforms, unavoidably yields a discontinuity in the
output of any of the algorithms.
The values of AIx derived from the synthesized
waveforms are taken as a reference in all
measurements, since these values are not impaired
by any identification error. We use this methodology
to evaluate the performance of two intrinsically
different algorithms: the PDF algorithm and the
WBior1.3 algorithm, as represented in the flowchart
of the figure 2.
Behaviour under noisy conditions is also an
important feature that is studied in WBior1.3
algorithm.
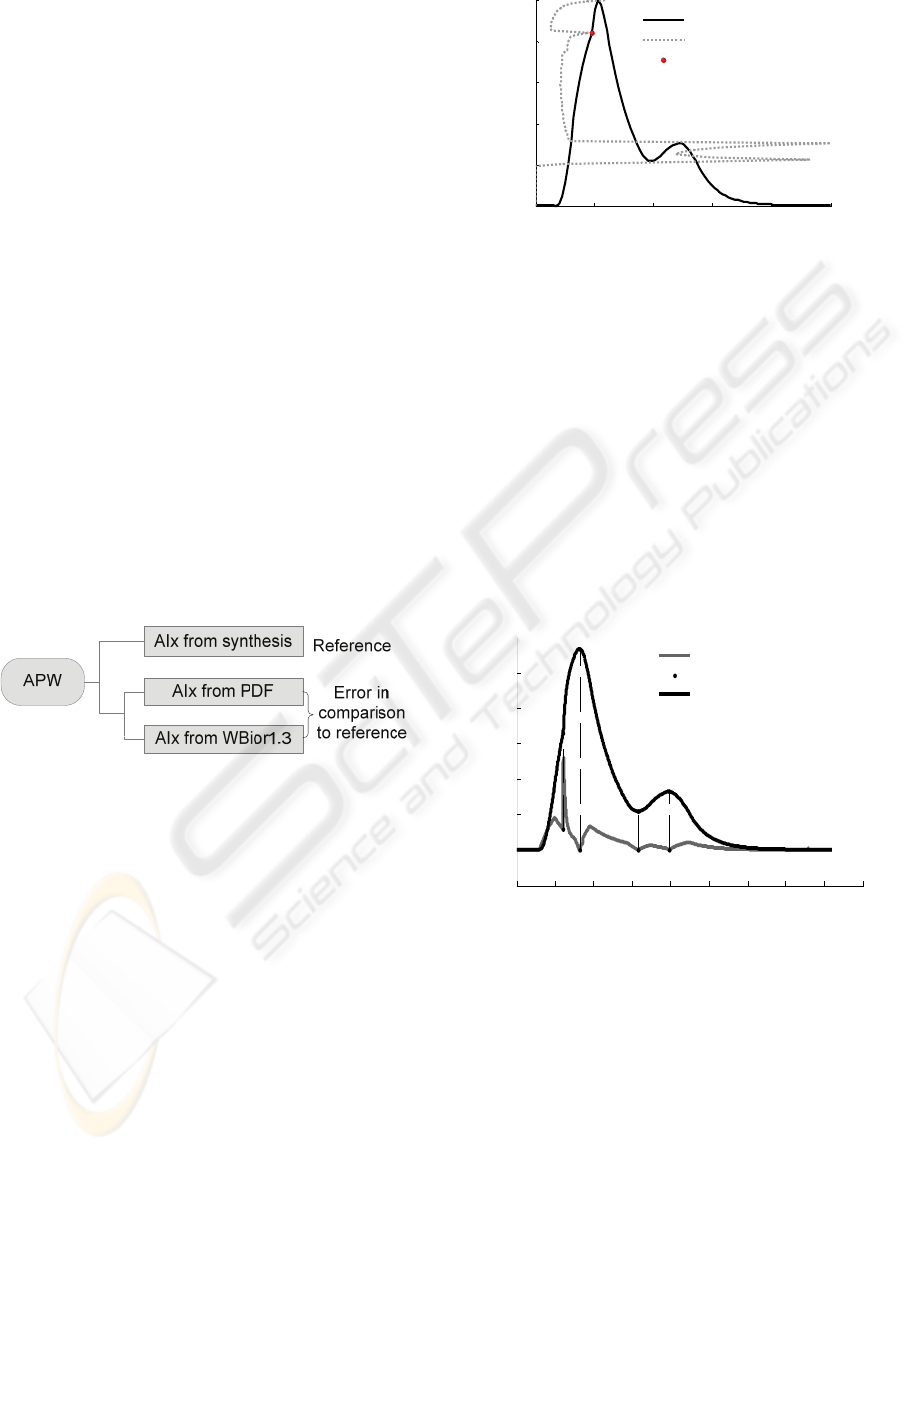
Figure 2: Flowchart diagram depicting the test
methodology.
4.1 Probability Density Function
The working principle of this algorithm was
described by other authors (Tsui et al., 2007), relies
on the PDF property of creating a local maximum
for the amplitudes close to the inflection point that
defines AIx.
Unfortunately, other maxima are also created
whenever the signal amplitude is slow varying, as
happens close to its peaks. To make things worse,
these confounding peaks can occur for amplitudes of
the same order of magnitude of the inflection point,
making the algorithmic identification task very hard
to accomplish. To avoid biasing the results with the
error of such an algorithm, we adopted to determine
the inflection point using a cursor based interaction.
Figure 3 plots a typical result of this procedure.
Figure 3: APW and its associated PDF.
4.2 Bior 1.3 Mother Wavelet
The Bior 1.3 mother wavelet (WB1.3) was selected
among a few candidates for its ability in identifying
the inflection point, when used in a scale of 20
(roughly equivalent to a 1.3 ms period).
Figure 4 illustrates a typical detection event
characterized by its distinctive narrow peak located
in coincidence (vertically aligned) with the
inflection point. The abscissa of the peak is the key
to the computation of AIx. Any loss of contrast in
the peak definition or any eventual uncertainty in its
location (jitter), as happens when noise is present,
will reflect in the error magnitude.
Figure 4: Cardiac pulse and its WB1.3 (scale 20) wavelet
decomposition (gray curve). Vertical dashed lines show
local peaks detected by the WB1.3.
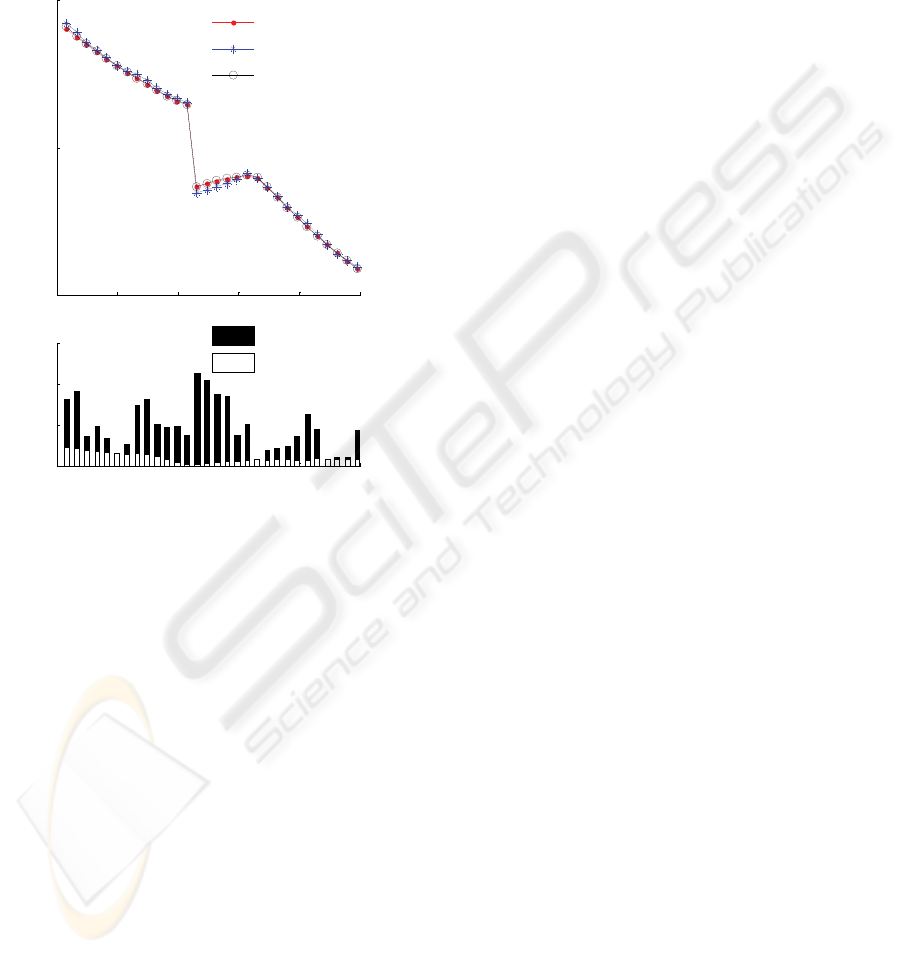
4.3 Results
Figure 5 depicts results for a family of cardiac
pulses, where D
R
sweeps the interesting area that
crosses the systolic peak, showing the discontinuity
that results from the definition. Notice the
magnitude of the errors shown in the lower panels,
where the superior performance of the WB1.3
algorithm shows up: less than 0.5% for the WB1.3
and greater than 2% in the PDF case.
0 0.2 0.4 0.6 0.8 1
0
0.2
0.4
0.6
0.8
1
AIx=15.9004 Time(s)
Amplitude (a.u)
Pulse pressure
Probability distribution
Inflection Point
0 0.1 0.2 0.3 0.4 0.5 0.6 0.7 0.8 0.9
-0.2
0
0.2
0.4
0.6
0.8
1
Time (s)
Amplitude (a.u)
Wavelet coefficients (scale 20)
Local minimum
Pulse Pressure
Arrival the systolic peak
SYNTHESIZED CARDIAC WAVEFORM IN THE EVALUATION OF AUGMENTATION INDEX ALGORITHMS -
Case Study for a New Wavelet based Algorithm
387
The performance of the WB1.3 algorithm was
also tested with noise added to the cardiac pulses.
The results obtained for a 36 dB limit (where the
discrimination capability of the algorithm is lost)
demonstrate that in presence of noise the
characteristic discontinuity of the AIx curve
vanishes away and the values of AIx scatters and
rise.
Figure 5: AIx results yielded by the three methods (upper
panel) and plot of errors of PDF and WB1.3 algorithms
(lower panel).Time scale is referred to the delay rising of
reflected wave.
5 CONCLUSIONS
The developed algorithm WBior1.3 in comparison
with the algorithm based in the PDF function
provides an efficient tool to determine AIx.
One possible pitfall of the definition of AI lays
in the fact that the lawful association of negative
values of AIx to a generally favourable arterial
condition can configure a misinterpretation of the
true physiological situation in some situations.
ACKNOWLEDGEMENTS
We acknowledge support from Fundação para a
Ciência e Tecnologia and from ISA – Intelligent
Sensing Anywhere.
REFERENCES
Chen, C.H., Nevo, E. Fetics, B., Pak, P.H., Yin, F.C,.
Maughan, W.L., Kass D.A. (1997). Estimation of
Central Aortic Pressure Waveform by Mathematical
Transformation of Radial Tonometry Pressure,
Circulation, 95, 1827-1836
De Melis, M., Morbiducci, U., Rietzschel E.R.,
De Buyzere, M., Qasem, A., Van Bortel L., Claessens
T., Montevecchi F.M., Avolio A., Segers P. (2009).
Blood pressure waveform analysis by means of
wavelet transform, Med Biol Eng Comp, 47, 165–173.
Feng J., Khir, A.W. (2007). Determination of wave
intensity in flexible tubes using measured diameter
and velocity Proceedings of the 29th Annual
International Conference of the IEEE EMBS, 15, 985-
988
Hermeling E., Reesink K.D., Reneman R.S., Hoeks A.P.
(2007), Measurement of local pulse wave velocity:
effects of signal processing on precision, Ultrasound
in Med. & Biol., 33(5), 774-781
Hope, S., Tay, D.B., Meredith, I.T., Cameron, J.D. (2002),
Comparison of generalized and gender-specific
transfer functions for the derivation of aortic
waveforms, Am J Physiol Heart Circ Physiol, 283,
H1150–H1156.
Hope, S., Tay, D.B., Meredith, I.T., Cameron, J.D. (2004).
Use of Arterial Transfer Functions for the Derivation
of Central Aortic Waveform Characteristics in
Subjects With Type 2 Diabetes and Cardiovascular
Disease, Diabetes Care, 27 (3), 746-751
Khir, A.W., Parker, K.H. (2002), Measurements of wave
speed and reflected waves in elastic tubes and
bifurcations, Journal of Biomechanics, 35, 775–783.
McConnell, K.B., Wagner M., Urbina, E., Daniels, S.,
Helmicki, A., Hunt, V., Amin, R.S., (2004). Central
Aortic Pressure Wave Changes with Sleep Stage and
Disordered Breathing in Children Estimated by
Application of an Arterial Transfer Function to
Peripheral Blood Pressure, Proceedings of the 26th
Annual International Conference of the IEEE EMBS,
3864-3866
Murgo, J.P.,Westerhof, N.,Giolma J.P., Altobelli, S.A.
(1980), Aortic input impedance in normal man:
relationship to pressure wave forms. Circulation, 62,
105-116
Olufsen, M. (1999). Structured tree outflow condition for
blood flow in larger systemic arteries. Am J Physiol
Heart Circ Physiol , 276, 257-268.
Swillens, A., Segers, P. (2008). Assessment of arterial
pressure wave reflection: Methodological
considerations. Artery Research, 2 (4), 122-131
Rubins, U. 2008. Finger and ear photoplethysmogram
waveform analysis by fitting with Gaussians, Med Biol
Eng Comput, 46, 1271–1276.
Tsui, P.H., Lin, L.Y., Chan, C.C., Hwang, J.J, Lin, J.J.,
Chu, C.C, Chen, C.N., Chang, K.J., Chang, C.C.
(2007). Arterial pulse waveform analysis by the
probability distribution of amplitude. Physiol.Means,
28, 803-812.
0.12 0.14 0.16 0.18 0.2 0.22
-50
0
50
AI(%)
AI
synthesized
AI
PDF
AI
WBior1.3
0.12 0.14 0.16 0.18 0.2 0.22
0
1
2
3
Time - D
R
2
(s)
error (%)
|AI
synth-AI
PDF|
|AI
synth-AI
WBior1.3|
BIOSIGNALS 2010 - International Conference on Bio-inspired Systems and Signal Processing
388
