
CELLMICROCOSMOS 4.1
An Interactive Approach to Integrating Spatially Localized
Metabolic Networks into a Virtual 3D Cell Environment
Björn Sommer*, Jörn Künsemöller, Norbert Sand, Arne Husemann, Madis Rumming
and Benjamin Kormeier
Bio-/Medical Informatics Department, University of Bielefeld, Germany
Keywords: Cell visualization, Pathway visualization in 3D, KEGG, BRENDA, UniProt.
Abstract: The high potential of Bioinformatics research concerning quantitative and qualitative data acquisition such
as data warehouses, spatial structure prediction and 3D microscopy conveys the vision of generating a
computational virtual cell. This paper discusses an approach which allows the creation and exploration of an
abstract compartmented cell environment, which can be used for (semi-)automatic, species- and organelle-
specific mapping and the comparison of metabolic data.
1 INTRODUCTION
During the last few years initial alternatives to the
well-established 2D view of networks have been
developed. The growing amount of data led to the
idea of introducing techniques to extend the two
visual dimensions widely used in the scientific
community by a third one: Biological pathways are
now visualized with different layout algorithms to
give a better understanding of the biological data
structure. On the other hand there is the cell
visualization and simulation area which already
partially deals with three dimensional cell models,
but none of these approaches tries to visualize
compartmental interrelationships cell internally in 3D.
CELLmicrocosmos 4.1 PathwayIntegration
(CmPI) introduces a novel approach of interactively
combining abstract or 3D Microscopy based cell
components with metabolic networks. To take full
advantage of 3D visualization, different comparing
methods and layouts, a user-optimized navigation
and 3D Stereoscopy have been integrated. To
support the correlation of organelle internal
localization levels with the involved enzymes,
information provided in the databases BRENDA
(Chang et al., 2009) and UniProt (The UniProt
Consortium, 2008) are obtained.
The CELLmicrocosmos (Cm) project is intended
to develop tools to provide the creation and
exploration of synthetic cell environments for
different purposes. It is intended to be applied to
scientific as well as educational purposes in the future.
2 RELATED WORKS
The scope of the application introduced here is
defined by two main areas: the pathway visualization
in 3D and the cell visualization and simulation.
2.1 Pathway Visualization in 3D
One of the initial approaches to visualize metabolic
pathways in 3D was already aimed at the avoidance
of unaesthetic aspects known from 2D visualizations
like line crossing and the reduction of topological
constraints (Rojdestvenski, 2003). Additionally, it
provided an opportunity to export the results to
VRML (Virtual Reality Modeling Language) and
followed the Focus+Context paradigm (Robinson &
Flores, 1997): The user can focus on a point of
interest (POI) while still able to keep track of the
complex network structure. The mentioned features
are also implemented in CmPI.
Another approach lies in the 2.5D Visualization
of metabolic networks (Fung et al., 2008), which
offers comparison methods for two different
biological networks: On the first 2D layer a
metabolic pathway is presented, on layer two a
protein interaction network and on the third layer,
located in the middle of the 3D space, the
overlapping nodes are shown. In other 2.5D
90
Sommer B., Künsemöller J., Sand N., Husemann A., Rumming M. and Kormeier B. (2010).
CELLMICROCOSMOS 4.1 - An Interactive Approach to Integrating Spatially Localized Metabolic Networks into a Virtual 3D Cell Environment.
In Proceedings of the First International Conference on Bioinformatics, pages 90-95
DOI: 10.5220/0002692500900095
Copyright
c
SciTePress

visualization approaches the layer concept is used
for the inter-organismic (Brandes, Dwyer &
Schreiber, 2004) or inter-domain large-scale
(Pavlopoulos et al., 2008) comparison of related
metabolic networks. CmPI distributes pathways of
different organisms in three dimensional space and
also integrates a layer paradigm, but focused on the
spatial segmentation of cellular components.
Another analogy with those 2.5D approaches is the
use of KEGG (Kanehisa et al., 2008) as the
metabolic data source.
MetNetVR introduced a possibility of visualizing
complex large-scale, hierarchical networks
interactively by implementing different 3D layout
algorithms (Yang et al., 2006). Virtual Reality
techniques are used to extend displays into the third
dimension. For CmPI, 3D Stereoscopy has been
integrated which is compatible with workstation as
well as professional back-projection concepts. In
addition, the network layouts of MetNetVR may
follow the cellular compartimentation. But in
comparison to the CmPI approach, it is not possible
to distinguish between different cell component
layers or to integrate different cell component
models and localizations interactively.
BioCichlid is another tool which visualizes and
animates time-dependent gene expression data,
correlated with protein interaction, signalling and
regulatory networks in 3D (Ishiwata et al., 2009).
CmPI does not implement time-related data so far.
2.2 Cell Visualization and Simulation
Cell simulation environments have been extended
from 2D to 3D during the last few years:
CompuCell3D is a software framework to
simulate the development of multicellular organisms
with stochastic rules and differential equations
(Merks & Glazier, 2005). E-Cell3D is implementing
meta-algorithms also based on differential equations
to simulate nonlinear interactions between functional
modules. In addition, parallelization of complex
mathematical analysis is provided (Sugimoto et al.,
2005). The Virtual Cell simulation environment
(VCell) allows the formulation and simulation of cell
biological models in 3D (Loew & Schaff, 2001).
The cell models of the mentioned approaches are
based on a very high grade of simplification,
because the effort for the computation increases with
the model complexity. In contrast, CmPI focuses on a
single cell at a structurally higher detail level, taking
cell components and their layers into account, but it
is not intended as a simulation environment so far.
Meta!Blast is a pedagogic entertainment
software in development. The aim is to create a
gaming experience for students, which links the
molecular and anatomic level (Call et al., 2006).
3 IMPLEMENTATION
3.1 The 3D Cell Environment
For many visualization applications it is sufficient to
integrate abstractly designed cell components which
are based on 2D electron and/or confocal laser
microscopy scans, supporting a clear data
arrangement and high-performance rendering.
Because the results of 3D microscopy are improving
and partly made freely available to the community
(Martone et al., 2002), we exemplarily integrated a
mitochondria model based on 3D electron
tomography (Figure 2) to create a linkage between
abstract/functional and realistic/structural data.
The cell components are imported as VRML97
models and provide different layers. For instance,
the mitochondrion consists of five shapes featuring
capability to map data to the matrices, the
inner/outer membranes, the intermembrane spaces
and clouds (Table 3).
3.2 Data Integration
The system should be open to make use of a wide
range of data sources: It connects to a data
warehouse integrating a number of life-science-
relevant databases: BioDWH (Töpel et al., 2008).
Metabolic data and their relations are visualized
as networks that are generated by an integrated
version of KEGG (Kanehisa et al., 2008). The 3D
cell environment contains enzymes and compounds
(products and substrates) which are involved in
different metabolic pathways. The connecting lines
show the reactions including the direction.
The localization information needed for the
spatial placement of enzymes is retrieved from
BRENDA (Chang et al., 2009) and UniProt (The
UniProt Consortium, 2008).
3.3 Data Mapping
3.3.1 Cell Component Related Mapping
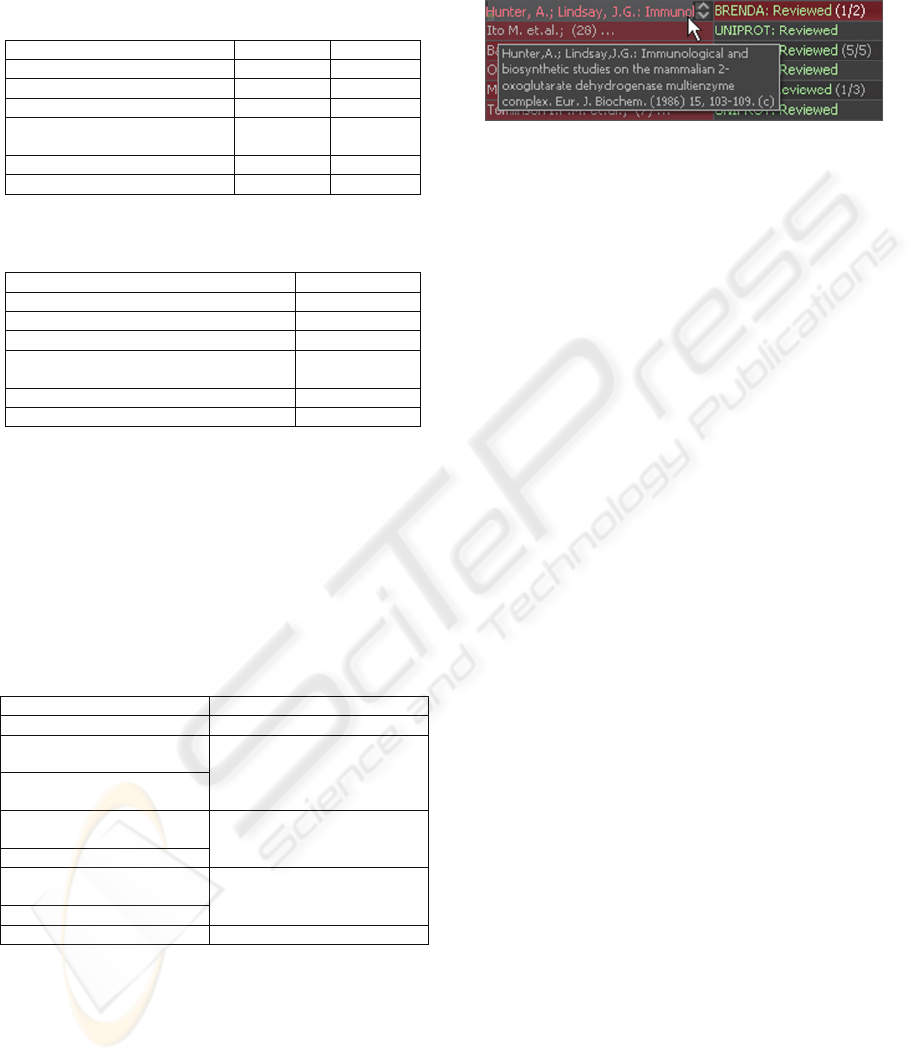
Table 1 shows an overview of automatic localization
results coming exclusively from BRENDA or UniProt.
Best results are achieved by combining the data for
the Citrate Cycle: All enzymes are localized (Table 2).
Focussing exemplary on mitochondria, UniProt
contains more than 50, BRENDA more than 20
CELLMICROCOSMOS 4.1 - An Interactive Approach to Integrating Spatially Localized Metabolic Networks into a
Virtual 3D Cell Environment
91
different localization definitions; Table 3 shows in
the left column an aperture.
Table 1: A comparison between the results achieved
exclusively from BRENDA or UnitProt for homo sapiens.
Pathway BRENDA UniProt
Glycolysis 62% 70%
Citrate Cycle 70% 82%
Fatty Acid Biosynthesis 33% 16%
Fatty Acid Elongation in
Mitochondria
100% 80%
Fatty Acid Metabolism 91% 71%
Pyruvate Metabolism 70% 70%
Table 2: An overview of combined localization results
coming from BRENDA and UnitProt for homo sapiens.
Pathway (KEGG identifier) Localization
Glycolysis (hsa00010) 22/24 (91%)
Citrate Cycle (hsa00020) 17/17 (100%)
Fatty Acid Biosynthesis (hsa00061) 2/6 (33%)
Fatty Acid Elongation in Mitochondria
(hsa00062)
5/5 (100%)
Fatty Acid Metabolism (hsa00071) 12/12 (100%)
Pyruvate Metabolism (hsa00620) 19/20 (95%)
Investigating definitions, the problem evolves
that different terms belong to the same localization.
The mapping information for CmPI is stored in a
HashMap. For example ‘mitochondrial inter-
membrane space’ and ‘mitochondrial lumen’ are
both mapped onto the 3
rd
mitochondrial layers
(Table 3, right column).
Table 3: An exemplary comparison of the mitochondrial
localizations found in BRENDA and the mapping to cell
components in CmPI.
BRENDA Localization CmPI Localization
mitochondrial matrix 1. Matrix
mitochondrial inner
membrane
2. Inner Membrane
mitochondrial respiratory
chain complex I
mitochondrial
intermembrane space
3. Intermembrane Space
mitochondrial lumen
mitochondrial outer
membrane
4. Outer Membrane
mitochondria
mitochondrial cloud 5. Cloud
3.3.2 Localizing an Enzyme
An interactive localization table offers opportunities
to compare and inspect corresponding references
and, if necessary, to adjust the automatic localization
settings. Loading the Citrate Cycle for Homo
Sapiens from KEGG, the enzyme 1.2.4.2
(Oxoglutarate dehydrogenase) will appear in the
table in addition to other enzymes. CmPI provides
all organism- and enzyme-specific localizations
derived from BRENDA and UniPro and also allows
the user to predict manually the localization.
Figure 1: Using BRENDA for the localization of EC
1.2.4.2, the term ‘mitochondrial inner membrane’ was
extracted from the publication shown in the Pop-up frame
and in the left column. The number in brackets indicates
the different publications pointing to the same localization.
In the right column the number of different localizations is
shown. For the selected enzyme, two localizations have
been found and the first one is selected.
The user can choose onto which cell component
the enzyme should be placed. There are three
qualitative mapping options:
Reviewed Localization (BRENDA and
UnitProt): The database entry has been
reviewed by a curator.
Unreviewed Localization (UnitProt): The
database entry has not been reviewed.
Predicted Localization: No database entry has
been found, the user has to localize manually.
In addition the user can decide onto which cell
component layer the enzyme should be mapped. If
the localization term is imprecise, there are two
options for the user to check the localization: He
may read the commentaries which are sometimes
provided by the database and shown in the
localization table or he may review the publications
(Figure 1), which are additionally often directly
linked to the abstracts of the PubMed webpage.
If the database entry contains only
‘mitochondria’ and there are no additional
comments coming from the database or the
publication, the user has to predict the layer. In case
of the mitochondrion, CmPI automatically maps an
enzyme with the term ‘mitochondria’ onto the outer
membrane (Table 3).
Even if there is a precise localization term, it
may be reasonable to read the corresponding
publications found in the localization table: For
enzyme 1.2.4.2 Hunter and Lindsay (1986) (Figure
1) mentioned, that it might be localized at the
mitochondrial inner membrane as well as the matrix.
If there are too few localization results for some
organism/pathway combinations, the user can
download the localization for all organisms and try
to search for comparable results.
BIOINFORMATICS 2010 - International Conference on Bioinformatics
92
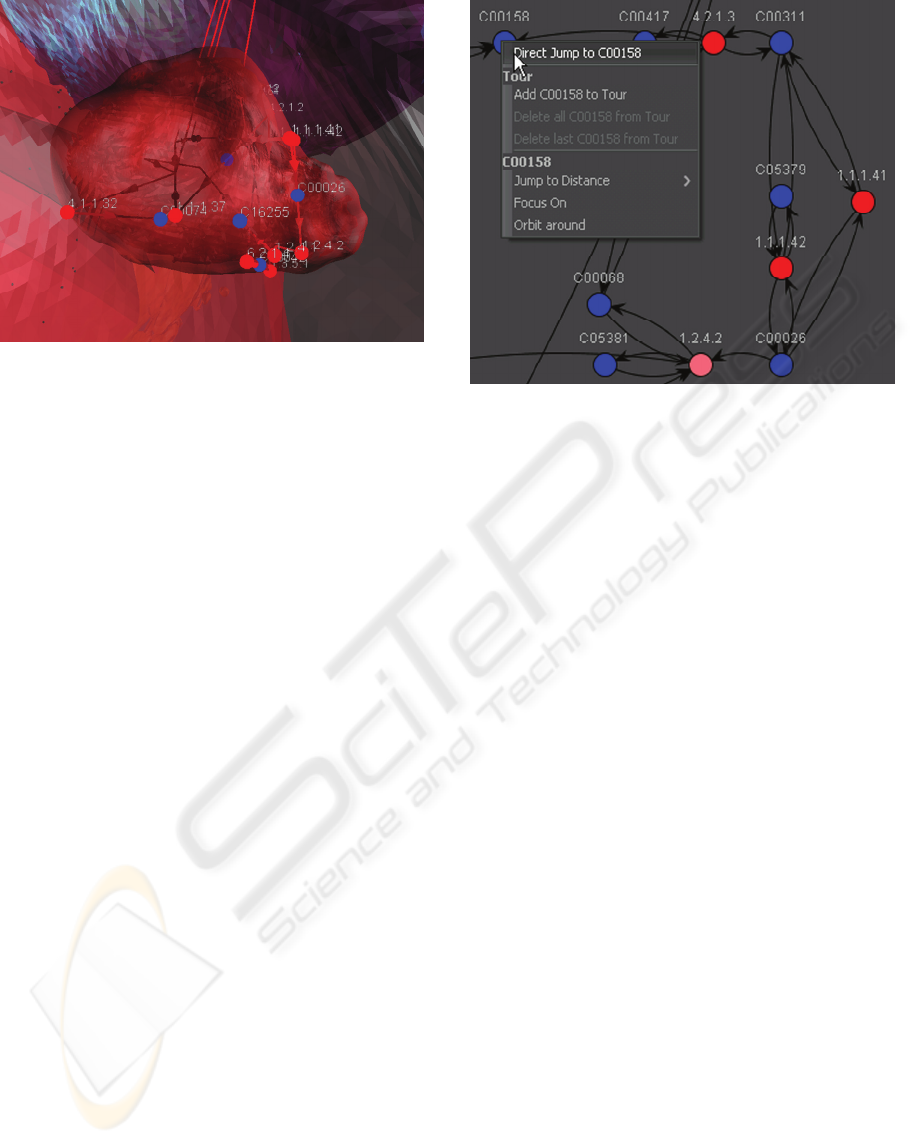
Figure 2: A mitochondria model manually segmented and
modelled from a tomographic reconstruction of isolated
liver mitochondria from Yamaguchi et al. (2008),
correlated with the citrate cycle of homo sapiens. The
importance of a well-defined navigation is shown by the
spatial complexity: It dissolves when navigating in 3D,
especially if 3D Stereoscopy is used. Figure 3 shows the
same network in 2D.
3.3.3 Placing Nodes in 3D Space
For the mapping of enzyme nodes in 3D space the
Inverted Self-Organizing Graphs (ISOM) layout
algorithm was adapted, distributing nodes onto Unit
Hypersphere (Meyer, B., 1998). This ensures that
connected nodes are placed in proximity to each
other. Because these nodes need to be mapped onto
partially complex-shaped cell components, they are
placed first on a surrounding sphere. Then they are
moved to the location lying on the shape between
the original computed ISOM point and the center of
the cell component. The compound nodes are placed
dependent on the position(s) of the connected
enzyme(s). For the placement of cell components as
well as the nodes we utilized a seed-based random
number generator, ensuring a consistent spatial
placement.
3.4 Spatial Data Browsing
3.4.1 3D View and Navigation
An easy-to-use and powerful six degrees of freedom
(6DoF) navigation offers three different modes:
The Floating Mode provides keyboard-based
movement in the 3D view and a free mouse cursor
for cell component and node interaction, e.g.
selecting and jumping to an object. Enabling the
Flight Mode locks the mouse cursor in a centered
position. Vessel-like behaviour allows an intuitive
Figure 3: The 2D Visualization of the pathway based on
the KEGG layout. The Pop-up menu shows options for the
clicked node. The active node is EC 1.2.4.2.
navigation through the cell. Mouse buttons
accelerate and mouse movement rotates the view. To
provide exploration of single cell components and
nodes, the Object-Bound Mode allows binding the
navigation to such an element. The view orbits
around the bound object. The mouse cursor is free
for interaction and provides movement via click and
drag. Another implemented features is a tour editor.
To take full advantage of the 3D perspective, 3D
Stereoscopy is implemented, compatible to e.g.
nVidia® Quadro® FX cards.
3.4.2 2D View and GUI Correlation
Additionally, a 2D view has been created by using
the JUNG library (O'Madadhain, 2009). In order to
give biologists a well-known alternative interface,
the KEGG map layout can be used to navigate
through 3D space (Figure 3).
Following the Focus+Context paradigm
(Robinson & Flores, 1997), Pop-up menus are
integrated in the 2D and 3D view as well as in the
localization table. The program provides a well-
defined correlation between GUI and the 3D
environment. Clicking on a 3D node triggers a panel
showing related information, e.g. alternative names,
references for the localization, links to open a
browser with corresponding websites and to
neighbor nodes. These links can also be used to
navigate in the 3D view. The localization table also
marks the active enzyme and pathway.
CELLMICROCOSMOS 4.1 - An Interactive Approach to Integrating Spatially Localized Metabolic Networks into a
Virtual 3D Cell Environment
93
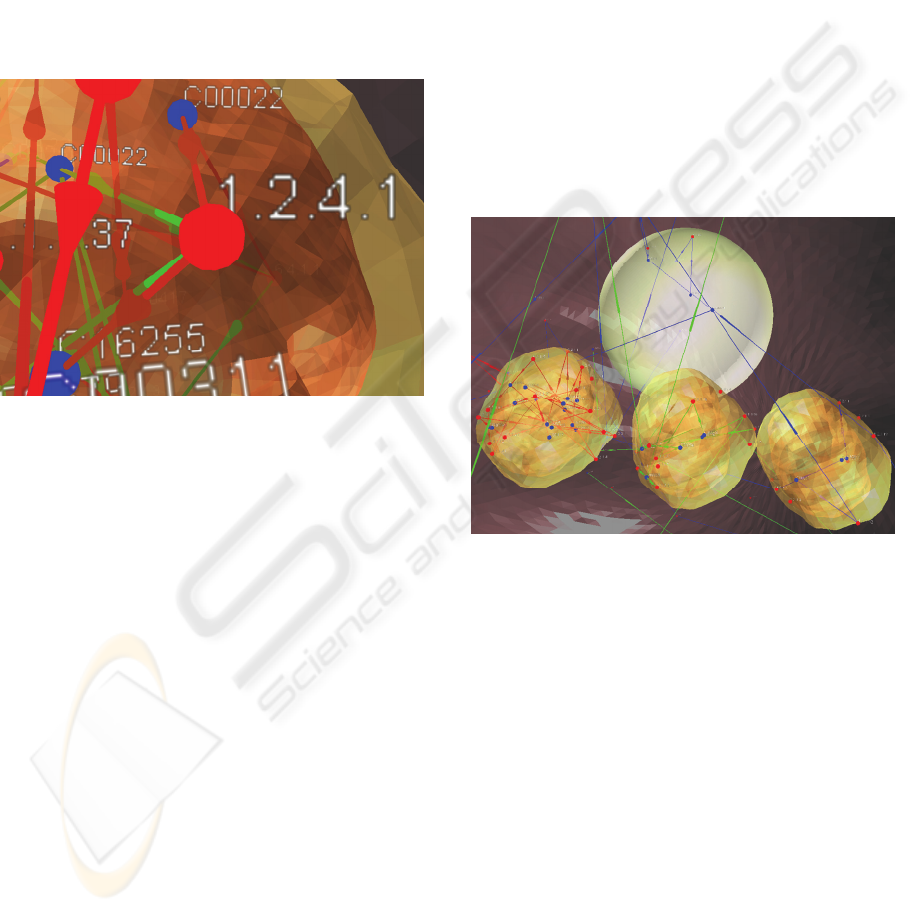
3.5 Comparing Methods
To compare the localization of enzymes involved in
different pathways, it is possible to load different
pathways into one cell environment. The edges of
those pathways are drawn in different colors (Figure
4). Type-identical Enzymes at the same cell
component have the same position (Section 2.3.3). If
the user does not want different pathways to be
placed on the same cell component, he may build a
cell environment containing multiple copies of a
specific cell component which are lying parallel to
each other (Figure 5).
Figure 4: EC 1.2.4.1 (Pyruvate Dehydrogenase) involved
in the Citrate Cycle (green) and the Pyruvate Metabolism
(red) correlated with a more abstract mitochondria model.
3.6 Data Exchange
Import and export capabilities are provided for cell
compositions by packaging a native XML format
with linked VRML cell component models (suffix:
.Cm3) as well as for metabolic pathways including
all localization settings (suffix: .Cm4). The whole
model can be exported in VRML97 in order to be
used by other 3D visualization programs.
3.7 Implementation Details
The webstart compatible project is implemented in
Java 6/Java3D. It needs only Java preinstalled and
an internet connection for the initial downloading
and optional updating process. The CmPI module is
integrated into the Cm 1 CellExplorer application,
also includes the Cm 3 CellEditor module providing
capabilities to create abstract cell environments by
using different cell component VRML models.
The Webstart application is located at:
http://Cm4.CELLmicrocosmos.org
4 RESULTS
We combined two substantial areas of
Bioinformatics: Cell and Network Visualization. For
this purpose we developed a framework which
enables researchers to localize, visualize and explore
organism- and organelle-specific enzymes in 3D space.
The data integration of KEGG ensures a broad
application area. The localization of enzymes using
BRENDA and UniProt achieved good results for the
organelle specific mapping. Because the database
entries are often imprecise, the automatic mapping at
the organelle internal layer is still problematic. To
dissolve the spatial complexity of networks in 3D,
the ISOM layout algorithm and a 6DoF navigation
has been implemented. Additionally, we showed the
potential of linking abstract/functional and
realistic/structural data by correlating pathways with
3D models derived from 3D microscopy.
Figure 5: Left mitochondrion: Citrate Cycle, Center:
Pyruvate Metabolism, Right: Glycolysis; Some nodes are
localized at the cell membrane (red), the cytosol
(transparent) and those not localized with the white
sphere.
5 OUTLOOK
To improve the qualitative and quantitative amount
of localization data, alternative databases should be
integrated, providing data of different organisms and
reliability or even different types of networks, for
example signalling and/or protein-protein interaction
data. The network visualization will be improved by
adding applied layout algorithms.
Another exciting challenge to take is the
simplification of the import process of 3D cell
component models or whole cells extracted from 3D
Microscopy (Section 2.2).
BIOINFORMATICS 2010 - International Conference on Bioinformatics
94

The export and import capabilities will be
expanded to support SBML in the future. The
advantage of the implemented 2D View (Section
2.4.2) is that networks and layouts created by other
applications may be imported into CmPI and
localized and explored in 3D space.
The cell environment will be extended in
different directions: The CellEditor will provide the
possibility of building cell models of different
species to be used in other applications as well,
while the CellExplorer will be advanced to an
interactive learning environment which will offer a
way to give students a spatial idea of the cell.
Another advantage of 3D visualizations is the
ability to show the realistic 3D structure of
components. Therefore, the integration of the
molecular level is intended, correlated with
organelles as well as networks. Combined with
capabilities to simulate these networks, this
framework would be another interesting contribution
to Synthetic Biology.
ACKNOWLEDGEMENTS
This work has been funded by the DFG (German
Research Foundation): The Graduate College
Bioinformatics (GK635). Our thanks go to all people
supporting or participating in this project and to the
Bio-/Medical Informatics Group of Bielefeld
University, where this work has been realized:
http://team.CELLmicrocosmos.org
REFERENCES
Brandes, U., Dwyer, T., Schreiber, F., 2004: Visual
Understanding of Metabolic Pathways Across Orga-
nisms using Layout in Two and a Half Dimensions. In
Journal of Integrative Bioinformatics - JIB, 1(1).
Call, A. B., Herrnstadt, S., Wurtele, E. S., Bassham, D.,
2006: Virtual Cell: A Pedagogical Convergence be-
tween Game Design and Science Education. In Jour-
nal of Systematics, Cybernetics and Informatics, 5(5):27-
31.
Chang, A., Scheer, M., Grote, A., Schomburg, I.,
Schomburg, D., 2009: BRENDA, AMENDA and
FRENDA the enzyme information system: new
content and tools in 2009. In Nucleic Acids Res.
37:D588-D592.
Merks, R. M. H., Glazier, J. A., 2005: A Cell-Centered
Approach to Developmental Biology. In Physica A:
Statistical Mechanics and its Applications 352:113-130.
Fung, D. C. Y., Hong, S.H., Koschützki, D., Schreiber, F.,
Xu, K., 2008: 2.5D Visualisation of Overlapping
Biological Networks. In Journal of Integrative
Bioinformatics - JIB, 5(1):1-17.
Hunter, A., Lindsay J. G., 1986: Immunological and
biosynthetic studies on the mammalian 2-oxoglutarate
dehydrogenase multienzyme complex. In J Biochem.,
155(1):103-109.
Ishiwata, R. R., Morioka, M. S., Ogishima, S. and Tanaka,
H., 2009: BioCichlid: central dogma-based 3D
visualization system of time-course microarray data on
a hierarchical biological network. In Bioinformatics,
25(4):543-544.
O'Madadhain, J., Fisher, D., Nelson, T., White, S., Boey,
Y.B.: JUNG - Java Universal Network/Graph
Framework, 2009: http://jung.sourceforge.net.
Kanehisa, M., Araki, M., Goto, S., Hattori, M., Hirakawa,
M., Itoh, M., Katayama, T., Kawashima, S., Okuda,
S., Tokimatsu, T., Yamanishi, Y., 2008: KEGG for
linking genomes to life and the environment. In
Nucleic Acids Res. 36:D480-D484.
Loew, L. M., Schaff, J. C., 2001: The Virtual Cell: A
Software Environment for computational Cell
Biology. In Trends in biotechnology 19(10):401-6.
Meyer, B., 1998: Self-Organizing Graphs — A Neural
Network Perspective of Graph Layout. In Lecture Notes
in Computer Science: 1547, Springer Berlin / Heidelberg.
Martone, M. E., Gupta, A., Wong, M., Qian, X., Sosinsky,
G., Ludäscher B., Ellisman, M. H., 2002: A cell
centered database for electron tomographic data. In J.
Struct. Biology 138:145-155.
Pavlopoulos, G. A., O'Donoghue, S. I., Satagopam, V. P.,
Soldatos, T. G., Pafilis, E., Schneider, R., 2008:
Arena3D: visualization of biological networks in 3D.
In BMC Systems Biology 2008, 2:104.
Robinson, A. J., Flores, T. P., 1997: Novel Techniques for
Visualizing Biological Information. In ISMB-97
Proceedings, 241-249.
Rojdestvenski, I., 2003: Metabolic pathways in three
dimensions. Bioinformatics, 19(18):2436-2441.
Sugimoto, M., Takahashi, K., Kitayama, T., Ito, D.,
Tomita, M., 2005: Distributed Cell Biology
Simulations with E-Cell System. In Lecture Notes in
Computer Science, Springer.
Töpel, T., Kormeier, B., Klassen A., Hofestädt, R., 2008:
BioDWH: A Data Warehouse Kit for Life Science Data
Integration. Journal of Integrative Bioinformatics,
5(2):93.
The UniProt Consortium, 2008: The Universal Protein Re-
source (UniProt). In Nucleic Acids Res. 36:D190-D195.
Yamaguchi, R., Lartigue, L., Perkins, G., Scott, R.T.,
Dixit, A., Ellisman, M.H., Kuwana, T. and Newmeyer,
D.D., 2008: Proapoptotic BH3-only proteins induce
Bax/Bak-dependent mitochondrial cristae remodeling
independent of cytochrome c release and Bak
oligomerization. In Mol. Cell, 31:557-569.
Yang, Y., Wurtele, E. S., Cruz-Neira, C. and Dickerson, J.
A., 2006: Hierarchical Visualization of Metabolic
Networks Using Virtual Reality. In Proc. ACM Intl.
Conf. on Virtual Reality Continuum and Its
Applications (Hong Kong, China). VRCIA '06. ACM
Press, New York, NY, 377-381.
CELLMICROCOSMOS 4.1 - An Interactive Approach to Integrating Spatially Localized Metabolic Networks into a
Virtual 3D Cell Environment
95
