
FINGERPRINT IDENTIFICATION
A Support Vector Machine Approach
Terje Kristensen
Departement of Computer Engineering, Bergen University College
Nygårdsgaten 112, N-5020 Bergen, Norway
Keywords: AFIS, SVM, Classification rate.
Abstract: In this work a hybrid technique for classification of fingerprint identification has been developed to decrease
the matching time. For classification a Support Vector Machine is described and used. Automatic
Fingerprint Identification Systems are widely used today, and it is therefore necessary to find a
classification system that is less time-consuming. The given fingerprint database is decomposed into four
different subclasses and a SVM algorithm is used to train the system to do correct classification. The
classification rate has been estimated to about 87.0 % of unseen fingerprints. The average matching time is
decreased with a factor of about 3.5 compared to brute force search applied.
1 INTRODUCTION
Fingerprints have been used for identification for
hundreds of years. The first years, the matching of
fingerprints was done by human experts. 40 years
ago, researchers started to load digital fingerprint
data onto computers. The first Automatic Fingerprint
Identification System (AFIS) was developed in
1991, and since then, there has been an enormous
progress in the field. Due to the ever-growing
capabilities of computers and great achievements in
research, the recognition rate has improved
significantly. There is nevertheless a huge amount of
work to be done.
The current work in this field concentrates on
reducing the computation time for feature extraction
and matching. Embedded fingerprint systems
supporting instant identification or verification are
increasingly used, and the computation time for
these processes is thus an important research field.
One way to decrease this time is to divide the
fingerprint database into different subclasses based
on specific properties, such that only a part of the
fingerprints needs to be considered for matching.
The uniqueness of fingerprints has been widely
tested, and two identical fingerprints have still not
been found (Pankanti et al., 2002). However, current
finger print identification systems do not uses all the
discriminating information present in a fingerprint,
and the probability of finding two identical
fingerprints using the systems therefore increases. A
lot of work is being done today to decide which
information in fingerprints should be used to keep
the uniqueness. In addition to this work, the current
work in this field concentrates on reducing the
computation time for feature extraction and
matching.
Various methods have been used for
classification, and some of the most successful ones
use artificial neural networks as a classifier. In this
paper, however, a Support Vector Machine has been
used for classification. The SVM network is given a
feature vector as input, based on computation of the
Poincare index. This method was first proposed by
Jain, Prabhakar and Hong (Jain et al., 1999).
Among all the biometric techniques fingerprint
identification is today the most widely used
biometric identification form. It has been used in
numerous applications. Everyone is supposed to
have a unique, immutable fingerprint. It is also the
one that is scoring highest overall compared to other
forms as iris, signature, voice, etc. In 2002
fingerprint based biometric systems had a market of
52.1 % (Maltoni et al., 2005).
The problem is to develop algorithms which are
robust to noise in the fingerprints and are able to
deliver accuracy in real time.
Fingerprint matching algorithms vary greatly in
terms of false positive and false negative errors.
They may also vary with respect to features such as
451
Kristensen T. (2010).
FINGERPRINT IDENTIFICATION - A Support Vector Machine Approach.
In Proceedings of the 2nd International Conference on Agents and Artificial Intelligence - Artificial Intelligence, pages 451-458
DOI: 10.5220/0002694104510458
Copyright
c
SciTePress
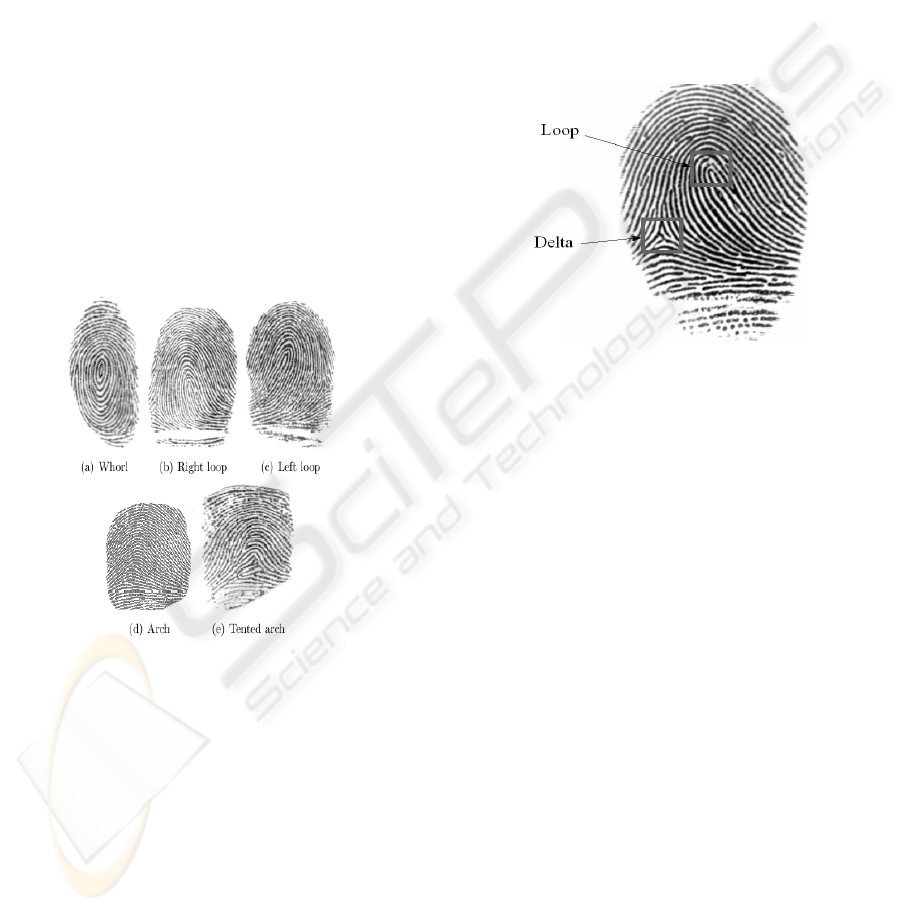
image rotation invariance and independence from a
reference point, given as the centre or the core of the
fingerprint pattern.
2 BACKGROUND
In an automatic fingerprint identification system
(AFIS), the fingerprint database can be huge, often
tens of thousands of fingerprints. If you were
supposed to check for similarity between the query
fingerprint and every other fingerprint in the
database, it would take an enormous amount of time.
With this in mind, fingerprint classification is an
important step that has to be implemented in every
fingerprint identification system. The classification
criteria most widely used are the modification or
extension of the standard Galton-Henrys
classification system (Henry, 1990). Here,
fingerprints are divided into 5 subclasses: whorl
(W), right loop (RL), left loop (LL), arch (A) and
tented arch (TA).
Figure 1: Five major fingerprint classes.
2.1 Singularities
Three singularities can be found in the fingerprint to
more easily distinguish between the classes. These
three singularities are the loop, the delta and the
whorl. A whorl fingerprint contains one or more
ridges that make a complete 360-degree path around
the centre of the fingerprint. Two loops (or one
whorl) and two deltas are present. The deltas are
placed under the whorl, one at the right and one at
the left side. A loop fingerprint has one or more
ridges that enter from one side, curves back and
exits at the same side as they entered. In a left and
right loop, the ridges enter from the left side and the
right side, respectively. A loop and a delta
singularity are present, with the delta under the loop,
at the left in a right loop fingerprint and at the right
in a left loop fingerprint. An arch fingerprint has
ridges that enter from one side, rises to a small bump
and exits at the opposite side.
When no singularities are present, this will make
the classification of the class rather difficult. A
tented arch fingerprint contains one or more ridges
that enter from one side, loops in a high curvature
and exit at the opposite site. When one loop and one
delta singularity are present, the delta is typically
placed right under the loop as shown in figure 2.
Figure 2: A loop and a delta singularity in a right loop
fingerprint.
It is possible to further subdivide each class into
more subclasses, but this is hardly of any practical
importance. In poor quality fingerprints it is really
difficult to even classify it to the five main classes,
and further classification would probably increase
the rejection rate. In addition, the complexity in the
end renders the classification incapable of improving
the identification time anymore.
2.2 Different Methods
Many fingerprint classification methods have been
proposed in literature. In general, these methods can
be categorised into five approaches (Maltoni, et al.,
2005):
• rule-based
• syntactic-based
• structure-based
• statistical-based
• neural-network based
In this work we have concentrated on the statistical-
based approach and want to see how the
performance of an AFIS comes out, based on SVM
as a classifier.
ICAART 2010 - 2nd International Conference on Agents and Artificial Intelligence
452
The current work in this field concentrates on
reducing the computation time for feature extraction
and matching. Embedded fingerprint systems
supporting instant identification or verification are
increasingly used, and the computation time for
these processes is thus an important research field.
One way to decrease this time is to divide the
fingerprint database into different subclasses based
on specific properties, such that only a part of the
fingerprints needs to be considered for matching.
3 EXTRACTING FEATURES
3.1 Extracting Classification Features
The SVM network needs an input vector to be able
to classify the fingerprints. This vector can be made
by extracting features of the fingerprint, and then
represent these features in a suitable way. We have
chosen to create this vector based on a technique
proposed by (Maltoni et al., 2005). Here, the authors
present a feature vector called FingerCode, which is
a vector consisting of 640 feature values.
First, a reference point in the fingerprint is to be
found. We set the core of the fingerprint as the
reference point. Then, the image is filtered in eight
different directions using different Gabor filters,
each enhancing ridges oriented in different angles.
Each of these eight images are divided into 80
sectors according to specific rules. The standard
deviation of each sector is finally calculated, and
these values represent the feature values. The total
number of feature values is 640 (8 x 80), and a
vector containing these values is used as input vector
to the SVM network.
3.2 Reference Point Detection
We have chosen to use the core point as the
reference point. This core point is defined as the
most northern loop singularity in a fingerprint. A
loop singularity can be detected by a method based
on the Poincare index proposed in (Jain et al., 1999).
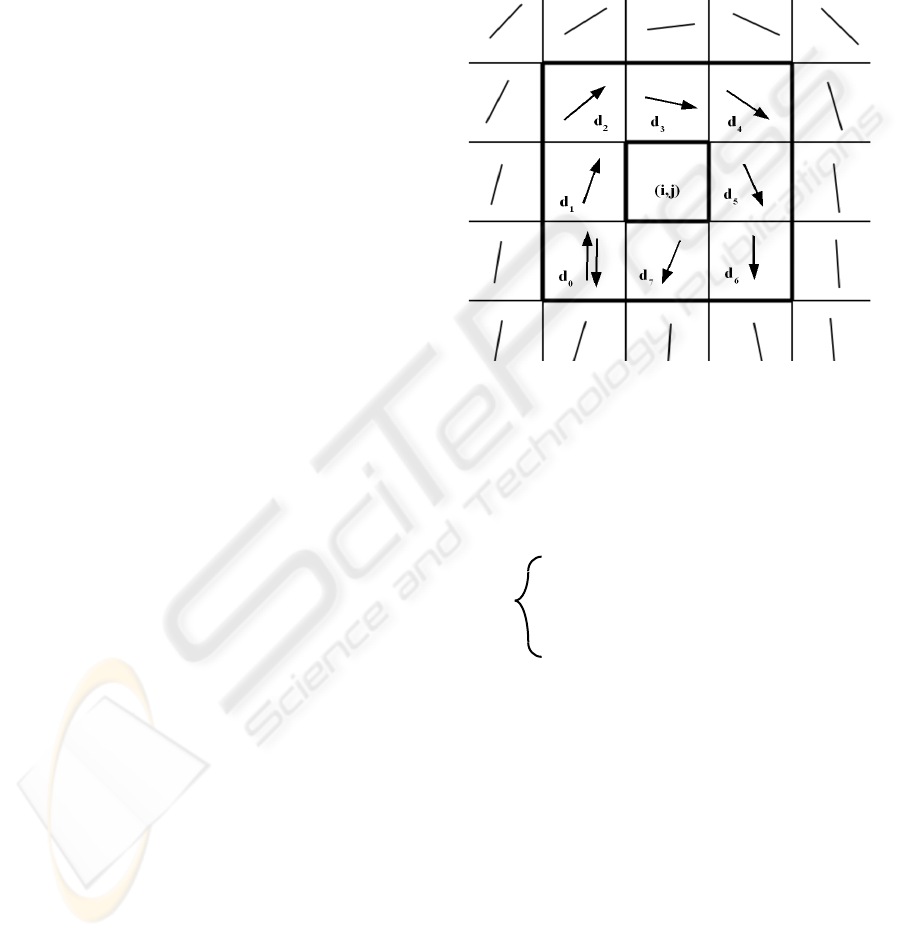
Let G be a vector field and C be a curve immersed
in G. Then, the Poincare index is defined as the total
rotation of the vectors of G along C. Here, G is the
vector field associated with an orientation image of
the fingerprint. The curve C is a closed path defined
as an ordered sequence of the neighbour elements d
k
of position (i,j) in the orientation image. Then, the
Poincare index at position (i,j) is defined as the sum
of the orientation differences between adjacent
elements of C:
P
G,C =
7
(1)mod8)
1
(,( )kk
K
angle d d +
=
∑
(1)
where d
k is the neighbouring elements as shown in
Figure 3. This figure shows a typical loop
singularity, and the sum of angles will here be 180
degrees. Because the left neighbour of d
7 is d0,
d((k+1) mod 8) is used instead of dk+1.
Figure 3: Computation of the Poincare index in the eight-
neighbourhood of pixel (i, j).
It is shown that the sum of Poincare indexes must be
either -360, -180, 0, 180 or 360. These indexes
thereby give a clear indication of which singular
region (SR) a pixel (i,j) belongs to, see (Kawagoe,
Tojo, 1984):
0 deg. if (i,j) does not belong to any SR
360 deg. if (i,j) belongs to a whorl type SR
180 deg. if (i,j) belongs to a loop type SR
-180 deg. if (i,j) belongs to a delta type SR
(2)
As mentioned, the core point is the northern most
loop. We assume that the fingerprints are captured
with the finger in an approximately normal position,
but tolerate a rotation of up to 45 degrees either
clockwise or counter clockwise. The core point is
used as reference point in the extraction of
classification features.
3.3 Gabor Filtering
After the reference point is detected, the image is
filtered using eight different Gabor filters. The
image needs to be divided into 80 sectors, as
illustrated in Figure 4. Here, the reference point is
marked with a cross. Note that the innermost band is
not divided into sectors, as it contains very few
P
G,C
=
FINGERPRINT IDENTIFICATION - A Support Vector Machine Approach
453
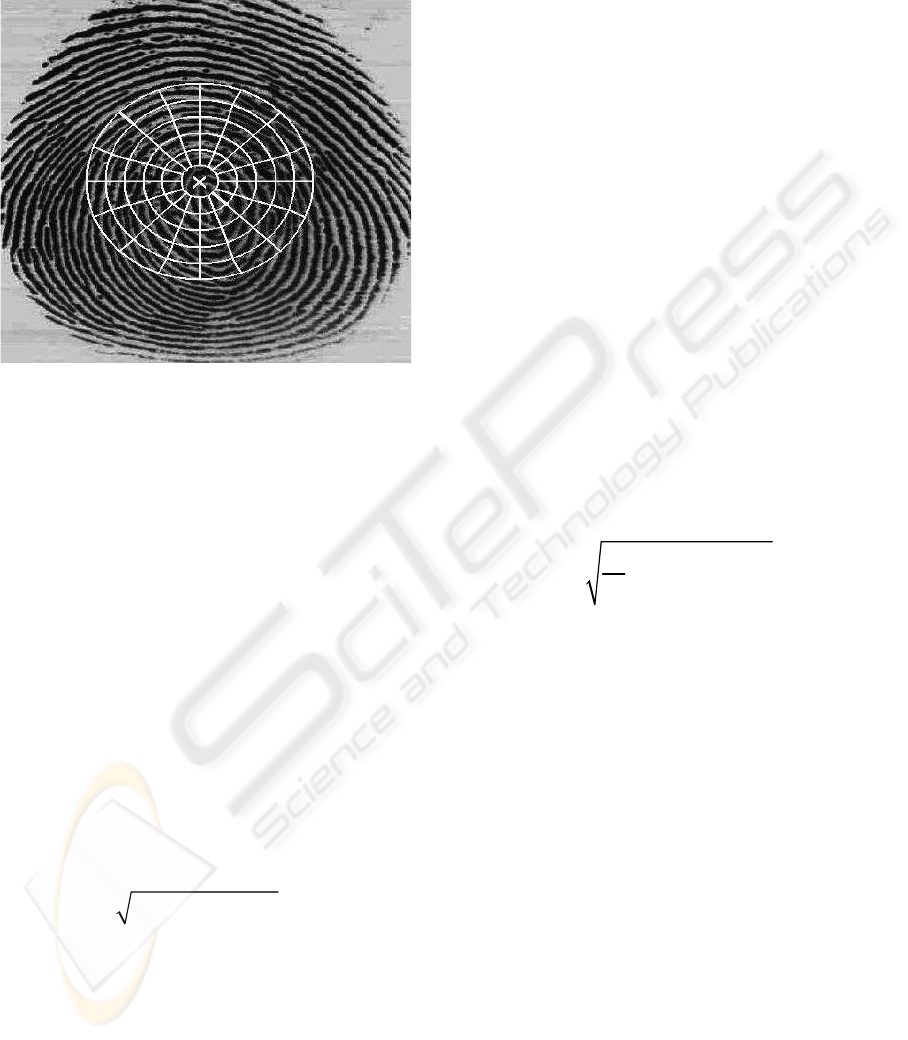
pixels, and the standard deviation will then become
very unreliable. Before filtering, each of the 80
sectors has to be normalized, setting the mean and
variance to desired values.
Figure 4: Computation of the Poincare index in the eight-
neighbourhood of pixel (i, j).
Each sector is normalized locally, so the mean and
variance have to be calculated for each sector. The
desired mean and variance value for each sector are
both set to 100, as recommended by the authors in
(Delima, Yen, 2003).
Let I(i, j) denote the gray level at pixel (i, j) in a
fingerprint image of size m x n and let (i
c,
j
c
) denote
the reference point or core point. The region of
interest is defined by a collection of sectors Sp,
where the sector Sp is computed in terms of
parameters (r,θ) defined by (Burges, 1998):
Sp = {i,j)|b(T
p
+ 1)
≤
r ≤ b(T
p
+2)}
1 ≤i ≤ n, 1≤j≤m,
θ
p
≤ θ < θ
p
+1
,
(3)
where
Tp = p div k,
(4)
θ
p
= (p mod k)(
2Π
/k)
(5)
r =
2 2
()( )ccii j j−+−
(6)
θ = tan
-1
((j-j
c
)/(i - i
c
))
(7)
b is the width of each band and k is the number of
sectors considered in each band. The Gabor filters
use eight fixed angle values; θ ε {0 degrees, 22.5
degrees, 45 degrees, . . . , 157.5 degrees}. The
frequency is fixed, to limit computation, and set as
the average ridge frequency in the region of interest.
The region of interest is here the union of all the
sectors defined above. The Gabor filtering results in
eight images that each enhance the ridges in a
specific direction and also remove noise, thereby
emphasising the relevant information.
3.4 The Feature Vector
The feature vector is, as earlier mentioned, a vector
consisting of 80 values for each of the eight Gabor
filtered images. In each of these images, a section of
the fingerprint containing ridges that are parallel to
the corresponding filter direction, exhibits a higher
variation. A section containing ridges that are not
parallel to the corresponding filter tends to be
smoothed by the filter, which results in a lower
variation. The spatial distribution of the variations in
the different sectors of the component images can
thereby be a good characterisation of the global
ridge structure. With this in mind, the feature vector
is defined as a vector containing the standard
deviation of all 80 sectors in the filtered image for
all angles θ [8].
Let F
pθ
(i,j) be the θ-direction filtered image for
section Sp. For p ε { 0,1,. . . ,79} and θ ε {0
degrees, 22.5 degrees, . . , 157.5 degrees}, the
feature value is the standard deviation Vp
θ
, defined
as:
V
pθ
=
1
((,) )
pp
p
Kp
F
ij P
K
θθ
−
∑
(8)
where K
p is the number of pixels in Sp and Ppθ is the
mean value of pixels in S
p in image Fpθ (i, j). Now,
we have a 640- dimensional feature vector that can
be used as input vector to the SVM network.
3.5 Scaling
To improve the classification rate, all feature vectors
are scaled before training. The main advantage of
scaling is to avoid attributes with big values which
dominate those with small values.
Another advantage is to avoid numerical
difficulties during the calculation. Because the
kernel values in a Support Vector Machines depend
on the inner products of the feature vectors, large
attribute values may cause numerical problems.
Scaling also makes the training run faster, and
decreases the chance of getting stuck in local
optima. The feature vectors are linearly scaled to the
range [-1, +1]. Each value j in a feature vector i is
scaled individually:
ICAART 2010 - 2nd International Conference on Agents and Artificial Intelligence
454
S
i,j
= -1 + 2*
(, ) min
max min
F
Vij i
jj
−
−
(9)
where FV(i,j) and S
i,j are the feature value and scaled
feature value at position j for feature vector i,
respectively.
min j and max j are the minimum and
maximum feature value at position
j for all feature
vectors, respectively. The table must appear inside
the designated margins or it may span the two
columns.
4 SUPPORT VECTOR
MACHINES
Support Vector Machines is a computationally
efficient learning technique that is now being widely
used in pattern recognition and classification
problems (Burges, 1998). This approach has been
derived from some of the ideas of the statistical
learning theory regarding controlling the
generalization abilities of a learning machine
(Vapnik, 1998, Vapnik, 1999).
In this approach the machine learns an optimum
hyper plane that classifies the given pattern. By use
of kernel functions, the input feature space by
applications of a non-linear function can be
transformed into a higher dimensional space where
the optimum hyper plane can be learnt. This gives a
flexibility of using one of many learning models by
changing the kernel functions.
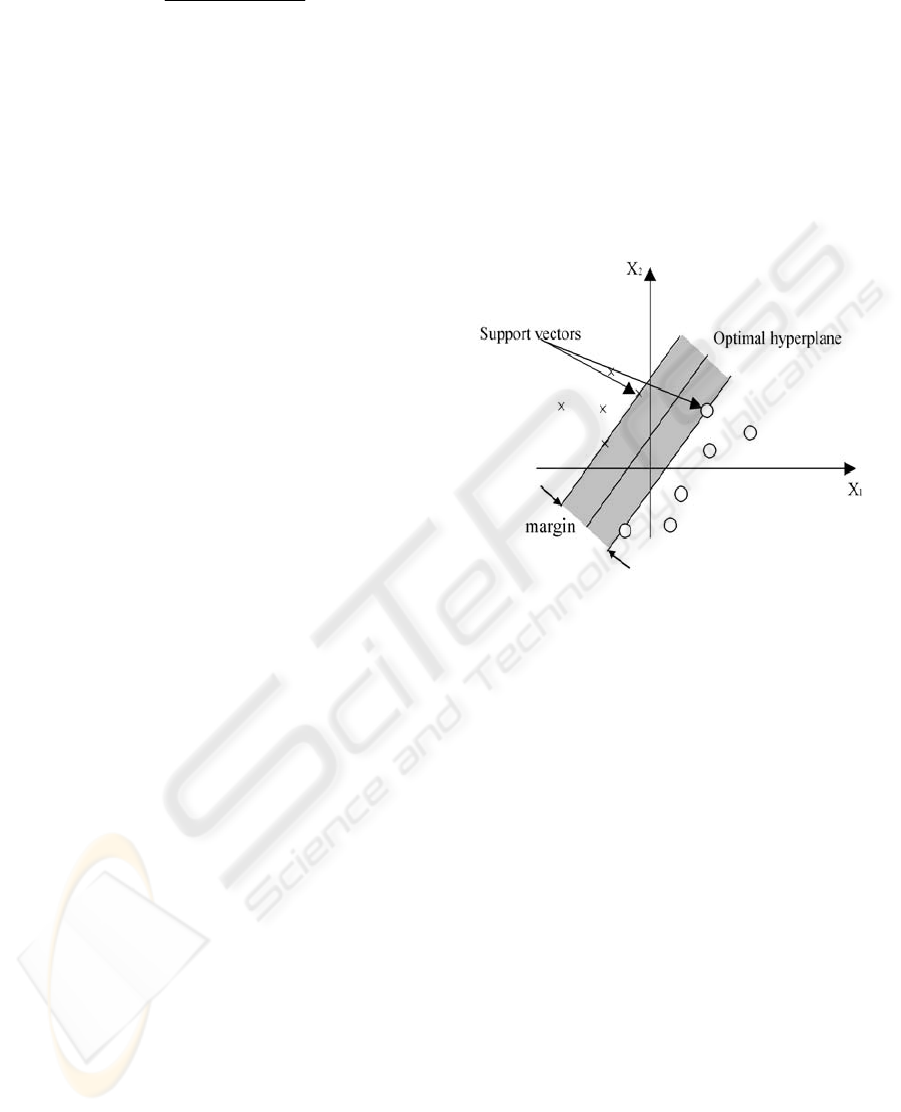
4.1 The SVM Classifier
The basic idea of an SVM classifier is illustrated in
Figure 5. This figure shows the simplest case in
which the data vectors (marked by 'X' s and 'O' s)
can be separated by a hyper plane. In such a case
there may exist many separating hyper planes.
Among them, the SVM classifier seeks the
separating hyper plane that produces the largest
separation margin.
In the more general case in which the data points
are not linearly separable in the input space, a non-
linear transformation is used to map the data vectors
into a high-dimensional space (called feature space)
prior to applying the linear maximum margin
classifier. To avoid the potential pitfall of over-
fitting in this higher dimensional space, an SVM
uses a kernel function in which the non-linear
mapping is implicitly embedded. A function
qualifies as a kernel function if it satisfies the
Mercer's condition (Vapnik, 1998).
With the use of a kernel function, the
discriminant function in an SVM classifier has the
following form
f(x) =
1
N
i=
∑
α
i
y
i
K(x
i,
x) + α
0
(10)
where K(-,-) is the kernel function, x
i
are the support
vectors determined from the training data, y
i
is the
class indicator e.g. +1 and -1 for a two class problem
associated with each x
i
, N
is the number of
supporting vectors
determined during training.
Figure 5: A support vector machine classification defined
by a linear hyper plane that maximizes the separating
margins between the classes.
Support vectors are elements of the training set
that lie either exactly on or inside the decision
boundaries of the classifier. In essence, they consist
of those training examples that are most difficult to
classify. The SVM classifier uses these borderline
examples to define its decision boundary between
the two classes.
4.2 SVM Kernel Functions
The kernel function plays a central role of implicitly
mapping the input vectors into a high dimensional
feature space, in which linear separability is
achieved. The most commonly used kernel functions
are the polynomial kernel given by :
K(x,y) = (
x
T
y + 1)
p
(11)
where p > 0 is a constant, and the Gaussian radial
basis function (RBF) kernel given by
K(
x,y) = exp ( -||x-y||/2σ
2
)
(12)
where σ > 0 is a constant that defines the kernel
width. Both of these kernels satisfy the Mercer
condition mentioned earlier.
FINGERPRINT IDENTIFICATION - A Support Vector Machine Approach
455
4.3 SVM Training
The fingerprints are classified by a Support Vector
Machine (SVM). The feature vector created is used
as an input pattern to the classifier. The SVM
network needs to be trained well to be able to
classify unknown patterns correctly.
We have manually labelled the fingerprint
images according to the Henry classification to
create a training set. Each classifier is trained using
the feature vector extracted from these labelled
images. The SVM classifier has been tested by
presenting it to an unknown set of fingerprints to see
how SVM is able to classify unknown patterns
correctly. Fingerprint images with no core point or a
core point too lose to an edge or segmented area is
not used for training, due to false feature values. If
such an image occurs in the classification stage, the
images cannot be classified and must be matched
against every other fingerprint in the final matching
stage.
5 EXPERIMENTS AND RESULTS
A Support Vector Machine is trained according to
the numbers specified in Table 1. Arch images have
no singularities present, and a reference point of
these fingerprints are thereby not possible by our
methods. However, loops constitute about 65
percent of the total fingerprint patterns, whorls about
30 percent, and arches and tented arches together
account for the other 5 percent (Karu, Jain, 1996).
This makes the problem of not being able to classify
arches less important.
Table 1: The number of training and testing instances for
each fingerprint.
Training Testing
LL 127 63
RL 123 59
TA 10 6
W 83 41
Total 343 169
We have used the LIBSVM library for SVM-
classification (Chang, Lin, 2001). The SVM is
trained using a Radial Basis Function kernel, as
given in equation 13.
K(x
i
, x
j
) = e
-
γ
||xi - xj||
, γ > 0
(13)
Before training, the parameters C and γ
above have
to be set to correct values.
C is the penalty
parameter of the error term and γ is a kernel
parameter. By cross-validation, the best C- and γ-
values are found to be 8.0 and 0.001953125,
respectively. We have used a one-vs-one approach to
a multi-class problem. This splits our classification
problem into six separate problems, that in the end
are combined into one final set of support vectors. In
total, this set, which is used for classification of the
unknown fingerprints, contains 232 support vectors.
The classification results using SVM as a classifier
are shown in Table 2.
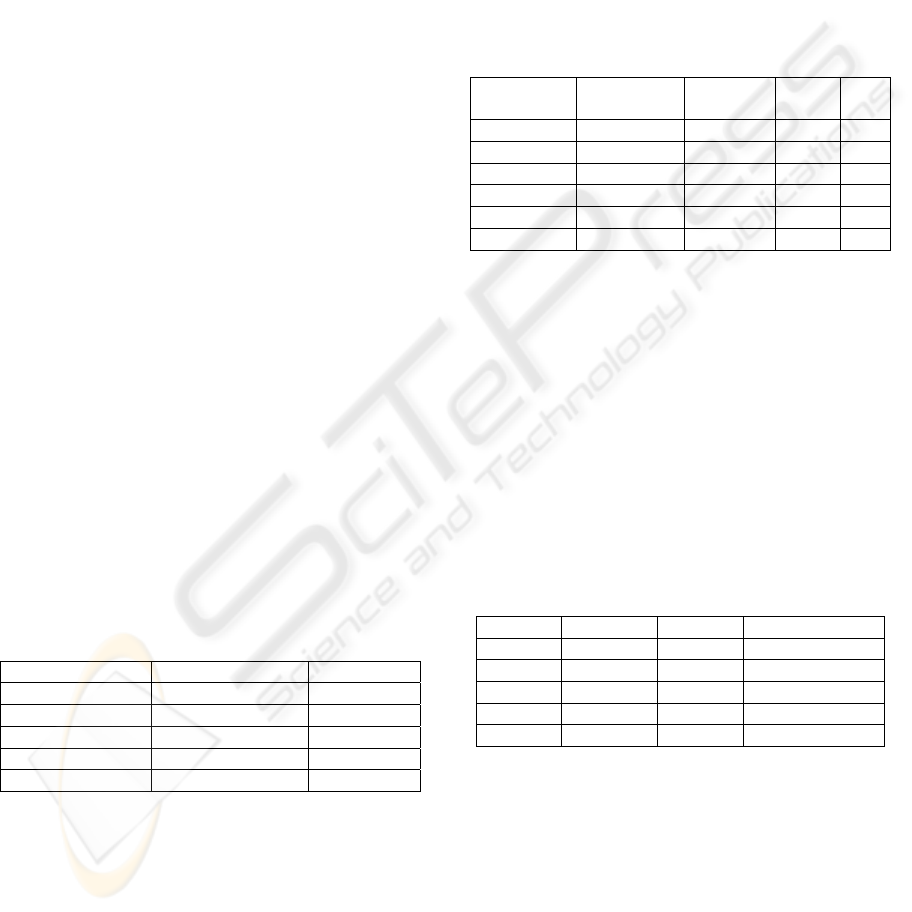
Table 2: Classification results of each class using a SVM
network.
True
Classes
Produced
Classes
LL RL TA W
LL 59 1 0 3
RL 1 55 0 3
TA 2 2 2 0
W 6 4 0 31
Best 96.8 97.6 98.1
From table 3 we see that the SVM classifier is able
to classify the loops very well (93.7% and 93.2%),
but is not able to classify the whorls and tented
arches at the same rate.
A benchmark test was carried out on the whole
set of fingerprints available to measure the average
matching time of a fingerprint query by using a brute
force search through the whole finger database
compared to a regime with a classification stage.
The benchmark test showed that the matching time
was reduced with a factor of about 3.5 by
introducing a classification in the AFIS regime.
Table 3: Classification rate for each class using a SVM
network.
Correct Wrong Percent Correct
LL 59 4 93.7
RL 55 4 93.2
TA 2 4 33.3
W 31 10 75.6
Total 147 22 87.0
6 DISCUSSION
The performance rate of the SVM network has been
estimated to about 87.0%. The SVM classifier
failed in classifying most of the tented arch
fingerprints, but this is because we believe there are
too few training instances belonging to the tented
arch class. SVM also performed better in
classification of left loops and right loops than
ICAART 2010 - 2nd International Conference on Agents and Artificial Intelligence
456

classification of whorls. We believe that this is
caused by the limited region-of-interest used to
calculate the feature vector, causing many whorls to
be wrongly classified as loops.
There are two main classes of whorls, classic
whorl and double loop, and the double loop causes
the classification problem. This is because the
region-of interest centred in the core looks quite
similar in double loops and normal loops. Thereby,
they can easily be misclassified as loops. A solution
could be to increase the region-of-interest, but this
would also increase the rejection rate, as more
sectors would be outside the fingerprint area or even
outside the entire image.
The experiments have shown that a SVM
network is able to do a correct classification with a
rate of about 87.0% on a four-class classification
problem. To see how well such a classification rate
is, it is compared with results obtained from
literature. In [10], a classification algorithm based on
the number of cores and deltas, and their relative
positions, is presented. The authors achieved a
correct classification rate of 85.4% on a five-class
classification task.
In (Cappelli et al., 1999) one partitioned the
directional image into connected regions according
to the fingerprint topology, thus giving a synthetic
representation which can be exploited as a basis for
the classification. This method achieved a correct
classification rate of 92.1% on a five-class
classification task.
The authors in (Jain et al., 1999) used an
approach similar to the one used in this paper, with
the FingerCode as feature vector. The classification
was done by a Multi Layered Perceptron (MLP)
neural network. The network was able to achieve a
correct classification rate of 86.4% on a five-class
classification task and 92.1% on a four class
classification problem.
In this paper a SVM network has been used in
the classification stage. We observe that using a
SVM network as a classifier gives nearly similar
results as those found in the literature. From our
experience with SVM network we believe that a
larger database than was available would probably
increase the performance rate, since a SVM network
is capable to handle higher dimensional input spaces
often in a better way than a MLP network and also
generalize better. Such a classifier will then be more
able to distinguish between more subtle differences
of the fingerprint classes.
A benchmark test of a trained SVM network has
been carried out on the total set of fingerprints to
measure the average matching time of a query
fingerprint compared to the query fingerprint using a
subclass regime. The matching time of the last
regime was also reduced by the factor of 3.5
compared to the brute force search regime.
7 CONCLUSIONS
One way to decrease the identification time of an
AFIS is to divide a finger database into different
subclasses so that that a query fingerprint does not
have to be tested against every fingerprint in the
database. To solve such a problem we have
implemented a classification stage in the AFIS by
using a SVM classifier.
The SVM classifier is able to classify different
unseen fingerprints with a performance rate of
approximately 87.0%. However, by using a
classification stage one is also able to reduce the
average matching time compared to a total search
which may be important when the fingerprint
database is becoming huge.
However, the main objection by the method used
in this paper is that the number of training examples
are too small compared to the number of features in
the FingerCode vector. By training the SVM with an
extended training database we believe that the
performance rate will greatly improve. Other types
of neural networks may also be used to do the
classification instead of the SVM network. This
belongs to our future research.
REFERENCES
Burges, C.J., 1998. A Tutorial on Support vector
Machines for Pattern Recognition. The book
Knowledge Discovery and Data Mining 2.
Cappelli, R., Lumini, A., Maio, D., Maltoni, D., 1999.
Fingerprint Classification by Directional Image
Partitioning In IEEE Trans. Pattern Anal. Mach.
Intell., vol. 21, nr.5, pp.402-421. IEEE Computer
Society.
Chang, C.C., Lin,C.J., 2001. The book LIBSVM : a
library for Support Vector Machines. Software
available online at http://www.csie.ntu.edu.tw/
cjlin/libsvm.
DeLima, P.G., Yen, G.G., 2003. Multiple model fault
tolerant control using globalized dual heuristic
programming. In IEEE Proceedings International
Symposium on Intelligent Control, Houston, TX, pp.
523–528.
Henry, E.R., 1990. Classification and Uses of Finger
prints, The book Pattern Recognition, George
Routledge and sons: London.
FINGERPRINT IDENTIFICATION - A Support Vector Machine Approach
457

Jain, A.K., Prabhakar, S., Hong, L., 1999. A Multichannel
Approach to Fingerprint Classification. In IEEE
Transactions on Pattern Analysis and Machine
Intelligence, vol. 21, pp. 348–359.
Jain, A.K., Farrokhnia,F., 1999. Unsupervised texture
segmentation using Gabor filters, The book Pattern
Recognition, vol. 24, nr. 12, pp.1167-1186. Elsevier
Science Inc.
Jain, A.K., Prabhakar, S., Hong, L., Pankanti, S., 1999.
FingerCode: A Filterbank for Fingerprint
Representation and Matching. In Proc. IEEE
Conference on CVPR, Colorado vol.2, pp. 187-195
Kawagoe, M., Tojo A., 1984. Fingerprint pattern
classification. In the book Pattern Recognition, vol.
17(3), pp. 295-303.
Karu, K., Jain, A.K., 1996. Fingerprint Classification. The
book Pattern Recognition, vol.29, nr. 3, pp. 389-404.
Maltoni,D. Maio,D, Jain,A.J., Prabhakar,S., 2005. The
handbook of Fingerprint Recognition, Springer.
Pankanti,S., Prabhakar,S., Jain A., 2002 On the
Individuality of fingerprints. In IEEE Transactions on
Pattern Analysis and Machine Intelligence, 24 (8), pp.
1010-1025.
VapnikV.N., 1999. An overview of statistical learning
theory. In IEEE transactions on Neural Networks, 10
sept.
Vapnik,V.N., 1998. The book Statistical Learning Theory,
Wiley, New York.
ICAART 2010 - 2nd International Conference on Agents and Artificial Intelligence
458
