
A SIMPLE ANALYTIC APPROACH FOR TRACKING RETINAL
VESSELS AND MEASURING THEIR DIAMETERS
Zafer Yavuz, Cevat Ikibas and Cemal Kose
Dept. of Computer Engineering, Karadeniz Technical University, Trabzon, Turkey
Keywords: Retinal image processing, Vessel diameter, Retinal vessel tracking, Automatic measurement and tracking,
Thinning algorithm.
Abstract: Retinal image processing provides tools for automatic diagnosis and monitoring of retinal diseases such as
diabetic retinopathy (DR), age related macular degeneration (ARMD), glucoma and such. The properties of
vessel structures on the other hand are widely utilized in locating morphologic structures such as optic disc
and macula and in automatic diagnosis of the retinal diseases. Due to the importance of retinal vessels, we
propose a simple approach for vessel tracking and measuring vessel diameter in retinal fundus images.
Images having manually segmented retinal vasculatures are obtained from STARE database and used in this
study. Our method first finds the midlines of the vessel network on the segmented images by employing
Zhang-Suen thinning algorithm and then tracks the vessel branches through those midlines. Lastly, the
diameters of the vessel segments in different parts of the vasculature are calculated along with the tracking
operation. The performed test results show that the proposed automatic method is quite successfully tracks
the vessel network and measure the diameter.
1 INTRODUCTION
Along with the advancements in technology, the
number and capability of techniques used in medical
fields are increased. For example, automated image
analysis and processing is one of the most promising
areas of computer vision used in medical diagnosis
and treatment. In this context, retinal fundus images
offering very high resolutions that are sufficient for
most of the clinical cases provide many indications
that could be exploited in diagnosing and screening
retinal degenerations or diseases (Köse, 2006),
(Köse and İkibaş, 2008). As a matter of fact, using
modern image processing techniques in
ophthalmology gained significant interest especially
in the last 15 years. The developments include
automated diagnosing and monitoring systems for
conditions such as degenerations, DR, ARMD etc,
and detection of retinal landmarks such as optic disc,
vascular network, macula and such (Köse et al.,
2009), (Köse et al., 2008). The automated tools in
ophthalmology have significant contributions in that
they offer a great potential to be used in operations
on large data set, which requires a substantial trained
human effort when they are manually processed.
Using these tools could indeed save a lot of
resources, and they are free from environmental
effects, graders’ bias and fatigue, and image quality.
Therefore, the increasing demand for these kinds of
tools and techniques will sure continue in the future.
Since retinal vessels are usually affected by the
existing diseases in retina (American Academy of
Ophthalmology, 1991), the diseases can be analyzed
and diagnosed by measuring parameters such as
vessel diameters, branch angles and lengths (Stanton
et al., 1995), (Hutchins et al., 1976). On the other
hand measuring vessel diameter is not an easy task
because of variation in vessel morphology and the
quality of retinal images.
Even though quite number of methods proposed
for measurement of vessel diameters, those methods
mostly deal with not the direct measurement of the
diameter but improving the accuracy of edge
location. On the other hand, the measurement of
parameters varies depending on the type of
instruments used to record the vessel profile and the
experience of the professional. The process is also
very laborious and time consuming. Even though
some improvement are done in estimating the vessel
diameter by single Gaussian function modelling the
vessel intensity profile (Newsom et al. 1992), the
13
Yavuz Z., Ikibas C. and Kose C. (2010).
A SIMPLE ANALYTIC APPROACH FOR TRACKING RETINAL VESSELS AND MEASURING THEIR DIAMETERS.
In Proceedings of the First International Conference on Bioinformatics, pages 13-18
DOI: 10.5220/0002694200130018
Copyright
c
SciTePress
Gaussian model could fail in estimating diameter
since high resolution fundus photographs often
display a central light reflex (Gao et al., 2000).
Pappas et al. estimated the vessel diameter with
an elliptical vessel profile and used a second order
model for the background (Pappas and Lim, 1998).
A method is presented by Gao et al. to model the
intensity profiles over vessel cross-section using
twin Gaussian functions to acquire adequate
information for subsequent image characterization,
leading to the development of automatic
measurement system for retinal images. This method
develops simple relationships between vessel width
and the intensity distribution parameters, which
provides robust estimators of vessel width even in
the presence of image noise, and varying
background intensities (Gao et al., 2001). A method
of semi-automated image analysis for the
measurement of retinal vessel diameters is described
in (Newsom et al. 1992). The technique was
compared with an observer-driven method for
reproducibility and accuracy. A computerized
system is presented for the automatic quantification
of blood vessel topography. This system applies
strategies and algorithms for measuring vascular
trees and includes methods for locating the centre of
a bifurcation, detecting vessel branches, estimating
vessel diameter, and calculating angular geometry at
a bifurcation. But the system had difficulty dealing
with very noisy images and small or especially
tortuous blood vessels (Gao et al., 2000). Another
study presents an algorithm measuring the vessel
diameter based on a two-dimensional difference of
Gaussian model, which is optimized to fit a two-
dimensional intensity vessel segment (Lowell et al.,
2004). Although these methods work fine in healthy
images, they fail in some cases such as pathological
structure and low image quality. This study suggests
a simple alternative method contributing to the
automatic retinal image analysis. The developed
method successfully tracks the vessel network and
measure vessel diameters.
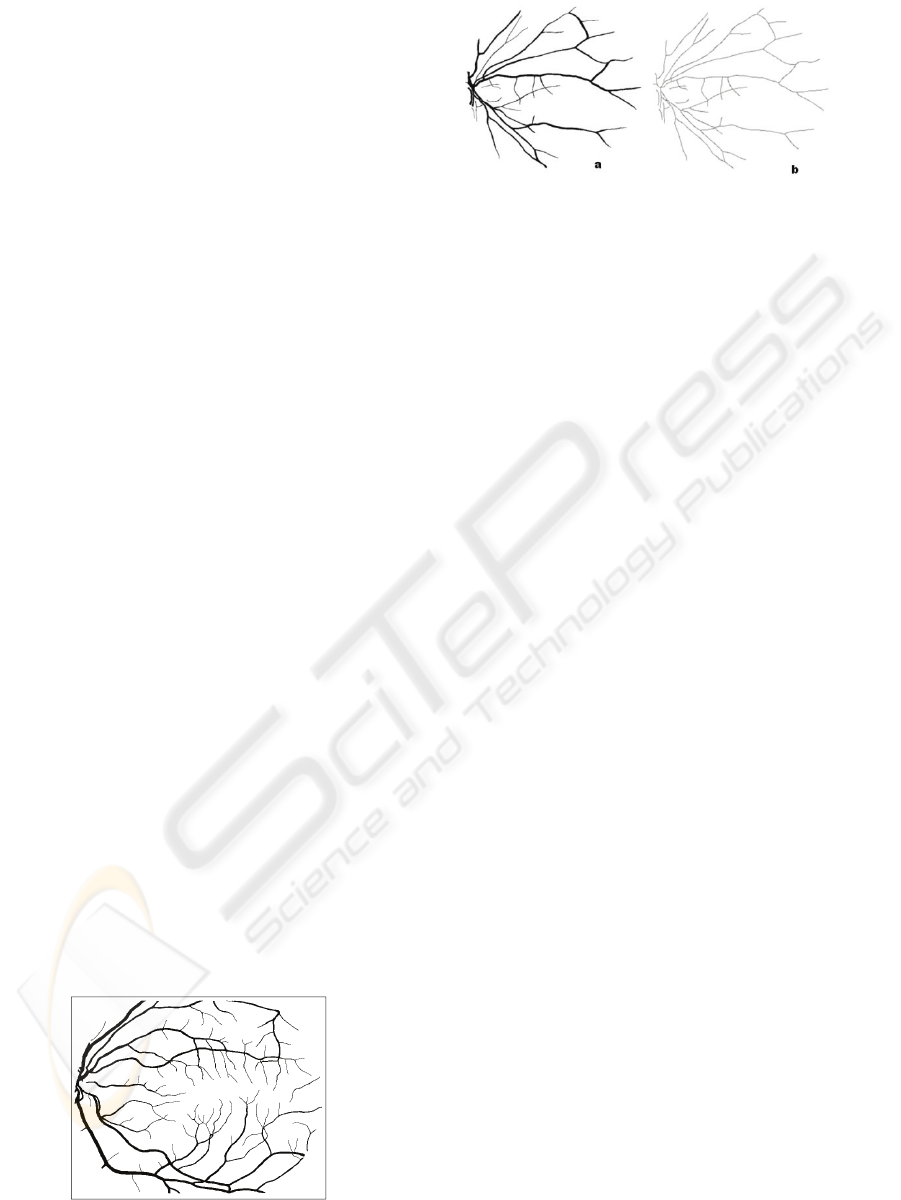
Figure 1: A sample manually segmented vessel network
taken from STARE project.
Figure 2: (a) Manually segmented retinal vessel network,
(b) Skeleton of (a) generated using Zhang-Suen thinning
algorithm
The rest of the paper is organized as the
following. In Section 2, we will give the algorithm
development for vessel tracking and measuring the
vessel diameter. Section 3 explains the test results
on manually segmented retinal images obtained
from STARE project. Conclusions and future works
are given in Section 4.
2 ALGORITHM DEVELOPMENT
This study introduces an algorithm for tracking
vessels and measuring their diameters. The
suggested method is applied on manually segmented
images obtained from STARE project website. The
STARE project includes detailed measurements of
the anatomical structures and lesions visible in the
retinal images. Here, our method first applies a
thinning algorithm on those images to get midlines
of the vessels, and then the vessels are tracked and
their diameters are measured.
2.1 Vessel Segmentation
Vessel segmentation is the first phase to track the
vessel network. Since our method does not have any
tool for segmentation, we directly used the retinal
images with manually segmented retinal vessels
obtained from STARE project web site
(http://www.parl.clemson.edu/stare/, 20.03.2009).
An example of segmented binary vessel network
image is given in Figure 1.
2.2 Skeletonization and Thinning
Skeletonization is a way of describing the global
properties of objects and representing the original
images more compactly. The skeleton, constructed
with the width of one pixel, shows the structural
connectivity of the main components of an object.
Skeletonization techniques are applied in quite
number of different areas such as character
BIOINFORMATICS 2010 - International Conference on Bioinformatics
14
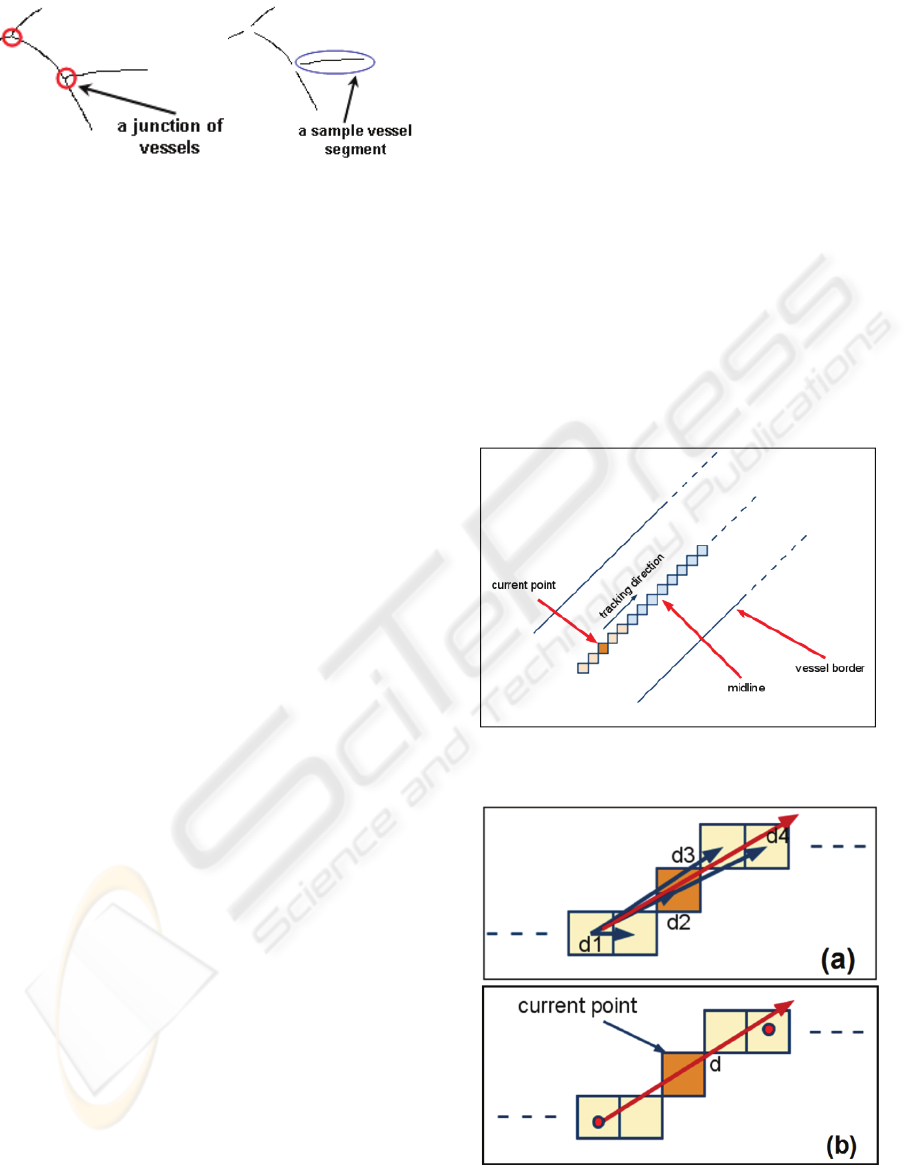
Figure 3: Removed junctions and generated sample vessel
segments.
recognition problems and extracting vessel topology
in retinal images.
Thinning is one of the basic methods for
skeletonization. As a result of this iterative
technique, the skeleton of vessel network is
extracted. According to this technique, the edge
pixels having at least one adjacent background point
are removed from the vessel in every iteration. All
of these kinds of pixels can be deleted, if their
removal doesn't affect the topology of the vessel
network. Here, the generated skeleton represents the
shape of the vessel network with fewer pixels as in
Figure 2.b (Ritter and Wilson, 1996).
The Zhang-Suen Thinning Algorithm is
employed in this study (Ritter and Wilson, 1996),
(Russ, 1992). In this skeletonization algorithm, the
new value is obtained based on the previous iteration
in a parallel manner.
The algorithm is finalized if no more change is
needed at the end of either sub iteration. Figure 2
shows an example of the thinning process produced
by using Zhang-Suen Algorithm.
2.3 Obtaining Vessel Segments
After the thinning operation, the crossing points of
all vessel networks are obtained. According to
crossing points, the vessel network is divided into
segments and each segment is labelled with different
numbers. A small part of sample retinal vessel
network separated in to segments is shown in Figure
3.
Relatively small vessel segments are omitted if
their length is less than 8 pixels. At the end of these
operations, vessel segments are ready for tracking
and measuring their diameters, which is explained in
the following section in detail.
2.4 The Vessel Tracking Method
Vessel tracking method is an important phase of
measurement of vessel diameter since our algorithm
tracks the vessel midline points while measuring the
thickness of the vessel segments in different parts of
the network.
According to our algorithm, consecutive points
on vessel midlines are considered in tracking. In
each step of tracking, based on the location of
current point, direction vector is determined to be
the vector connecting P
c-2
and P
c+2.
Even though the
direction vector could have been simply defined
based on the difference of the first and last point of
currently processed points, the average of the
vectors in Figure 5.a and b better represent the
direction of current point. Here, the direction vector
is calculated considering five points, two of which
are located before the current point and the other two
are located after the current point. Totally five points
are processed in determination of vessel direction for
the current point, which is explained in Section 2.5
in details. The tracking method goes on until the end
point is reached as shown in Figure 4.
Figure 4: The midlines of vessel network utilized in
tracking and measuring the vessel diameters.
Figure 5: Graphical representation of (a) difference
vectors and (b) the calculated direction vector based on
difference vectors.
A SIMPLE ANALYTIC APPROACH FOR TRACKING RETINAL VESSELS AND MEASURING THEIR
DIAMETERS
15
2.5 Measuring the Vessel Diameter
So far, the operations to obtain points on midlines of
the whole vessel network are performed. The next
steps include calculation of the direction vectors and
measuring the vessel diameters.
In order to track the vessel branches, we first
calculate the direction vector for each point on the
midline produced using thinning algorithm. Here the
direction vector is calculated as the average of five
vectors. Relative to the current point P
c
, the five
points are P
c-2
, P
c-1
, P
c
, P
c+1
, P
c + 2
. Each point has
axis and ordinate called x and y. The differences
between the first point
and all other points
represent different vectors as shown in Figure 6.a.
The result vector representing the direction for the
current point is shown in Equation 1.
(1) α + β = χ. (1) (1)
where
,
,
,and
represent the vectors
based on the difference between each point P
c-1
, P
c
,
P
c+1
, P
c + 2
and the first point P
c-2
. The formula for
calculation of these vectors is given in Equation 2.
(2)
where is 1, 2, 3 and 4. This operation is conducted
for each point on the vessel midlines. The calculated
vector is then normalized and orthogonal vectors
used in measuring the vessel diameters are found for
the current point.
Given the direction vector
,
, the
orthogonal vectors
and
are calculated to be
,
and
,
. These
orthogonal vectors are shown in Figure 7.
Measuring the diameter of vessels is done
considering the direction vector. For each point
through the midlines, two orthogonal vectors to the
direction vector are calculated. The diameter for the
current point is calculated to be the addition of
distances starting from the current point and ending
in vessel edges through these orthogonal vectors in
both directions as depicted in Figure 6. Here, the
diameter is the total length of
and
,
which are
orthogonal vectors to the direction of the current
point. The vectors used in calculations are all
normalized vectors.
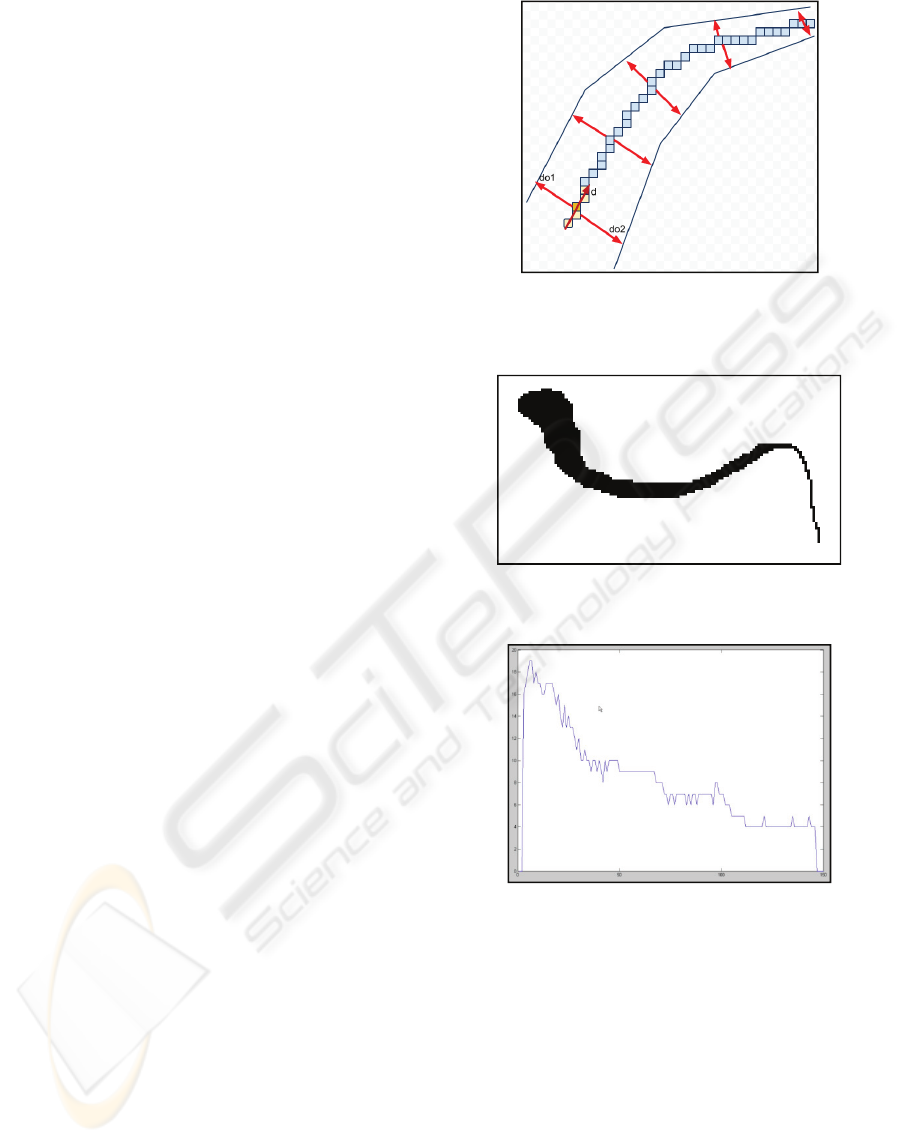
Figure 6: The orthogonal vectors calculated for each pixel
through the midlines of vessel network, and measuring the
vessel diameter.
Figure 7: An example of manually generated test vessel
segment.
Figure 8: The calculated diameter of different parts of test
vessel segment in Figure 7.
3 RESULTS
The proposed methods for tracking retinal vessels
and measuring their diameter are tested on the
images with manually segmented retinal vessels
obtained from STARE project web site
(http://www.parl.clemson.edu/stare/, 20.03.2009). It
is illustrated in Figure 7 and 8 that the proposed
methods successfully track the vessel network and
measure the diameter of vessels in retinal images.
The calculated diameters of a vessel segment are
BIOINFORMATICS 2010 - International Conference on Bioinformatics
16
also depicted in a graph in Figure 8. A real vessel
network is also processed to show the vessel
structure and calculate the diameters in different part
of vessel network. One example of this covering a
small part of the whole network is illustrated in
Figure 9. The diameter of real vessel segment
shown in Figure 9 is also graphically presented in
Figure 10. These figures show that the graphical
representation of the size of diameters is perfectly
understandable and give ideas about the gradual
change in diameters of vessels. The graphical
representation can be a visual tool for
ophthalmologists to see if there is any sudden
change in vessel diameter, which could be a sign of
different retinal diseases such as lesion and
haemorrhages, bleeding etc.
In Figure 8, the x axis shows in which part of the
vessel of Figure 7 the diameter is measured, and y
axis shows the calculated diameter on that point. As
seen in the figure, the diameter of vessel decreases
through the vessel segment which is correct for the
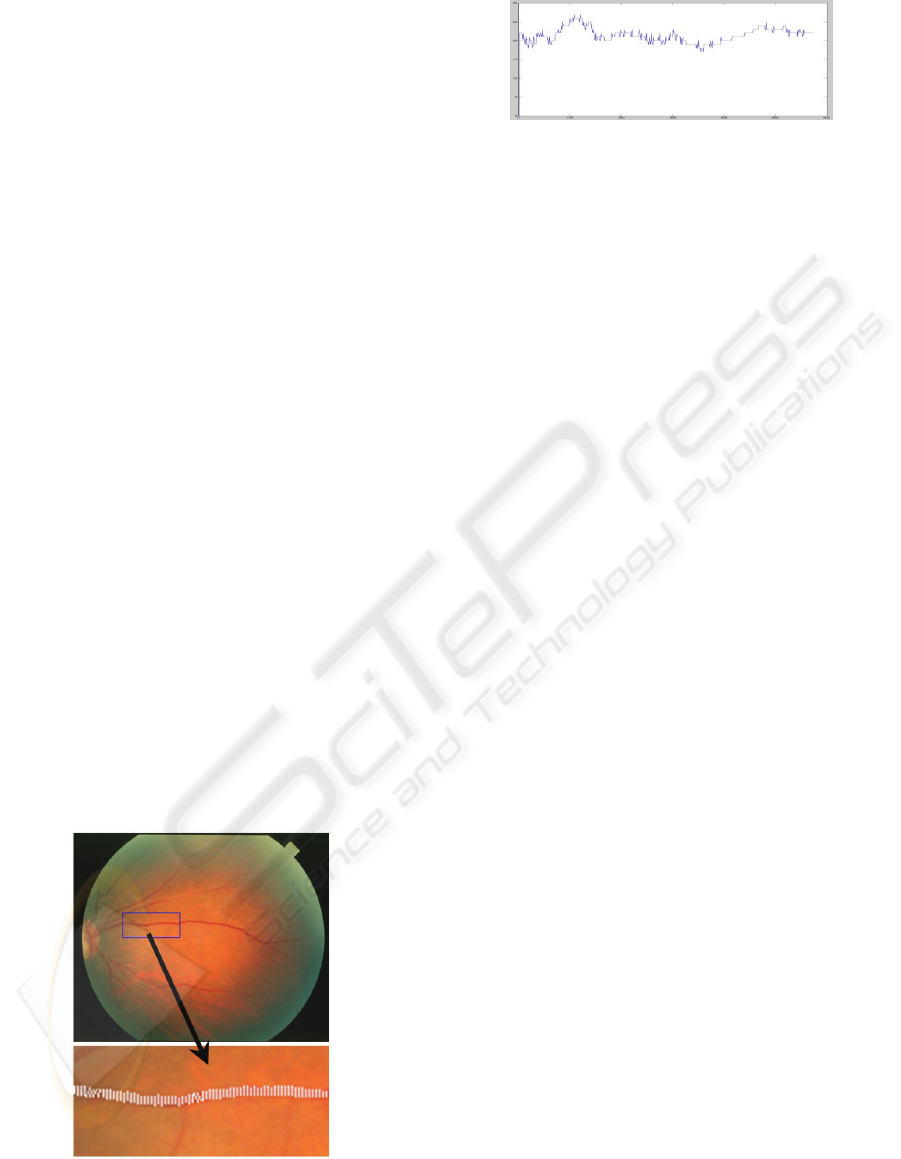
processed vessel. Figure 9 and 10 also shows an
original retinal image, the extracted vessel segment
from the image, and the diameter calculated on the
extracted vessel segment. y and x axis show the
calculated diameter and on which point of the vessel
segment the diameter is calculated. Manual
calculations of vessel diameters in some points also
show that automatic and manual measurements
throughout the processed vessel segment are very
close to each other.
Overall, the suggested method successfully
tracks the vessels and measures their diameters
through the vessel segment. Here it can be stated
that the method is successful in tracking and
measurement in all kinds of retinal vessels.
Figure 9: A retinal fundus image and a small part of the
real retinal vessel network.
Figure 10: Diameters of vessel shown in Figure 9.
4 CONCLUSIONS
Tracking vessels network in retinal images and
measuring the diameters are very important since the
morphological changes in vessel structures can be a
sign of different retinal diseases. For example
sudden diameter changes can be a sign of
haemorrhages or bleeding area. The vessel diameters
can also be utilized in verification of vessel
segmentation. Since the diameter of vessel structure
gradually decreases while moving away from optic
disc region, the sudden changes in diameters of
segmented vessels would be a sign of inaccurate
segmentation if the retinal image does not contain
any disease. The direction vector would also be
employed in the same way. The direction vectors of
branches in vessel structure are supposed to be in
similar direction with the main root vessel from
which the branches originate. Especially in junctions
of vessel networks, illogical direction vector of
branches would be a sign of erroneous segmentation.
In addition to graphical representation, vessel
colorization based on the diameter of vessels can be
done as a feature work of this study for a better
representation. This could also be a visual tool for
ophthalmologist to visually detect the retinal
diseases, the major sign of which is the changes in
diameters.
REFERENCES
American Academy of Ophthalmology, (1991).
Ophthalmic Pathology, (Section 11, pp 179), Basic
and Clinical Science Courses.
Gao, X. W., Bharath, A., Stanton, A., Hughes, A.,
Chapman, N., Thom, S., (2000). Quantification and
Characterisation of Arteries in Retinal Images. (Vol.
63, Num. 2, pp. 133-146(14)), Computer Methods and
Programs in Biomedicine.
Gao, X, Bharath, A, Stanton, A, Hughes, A, Chapman,
Thom, (2001). Measurement of Vessel Diameters on
Retinal Images for Cardiovascular Studies. On-line
Conference Proceedings: Medical Image
Understanding and Analysis.
Hutchins, G.M., Miner, M.M., Boitnott., J.K., (1976).
Vessel Calibre and Branch-Angle of Human Coronary
A SIMPLE ANALYTIC APPROACH FOR TRACKING RETINAL VESSELS AND MEASURING THEIR
DIAMETERS
17

Artery Branch-Points, (Vol. 38, pp 572), Circulation
Research.
Köse, C., (2006). Fully Automatic Segmentation of
Coronary Vessel Structures in Poor Quality X-ray
Angiograms Images, (Vol. LNCS 4109, pp. 72-82),
Springer: Lecture Notes in Compute Science.
Köse, C., and İkibaş, C., (2008). Segmentation of
Coronary Vessel Structures in X-ray Angiogram
Images by Using Spatial Pattern Matching Method,
(pp. 1-6), ISCIS2008.
Köse, C., Şevik, U., and Gençalioğlu, O., (2008).
Automatic segmentation of age-related macular
degeneration in retina fundus images, (Vol. 38, pp.
611-619), Computers in Biology and Medicine.
Köse, C., Şevik, U., Gençalioğlu, O., İkibaş, C., and
Kayıkçıoğlu, T., (2008). A Statistical Segmentation
Method for Measuring Age-Related Macular
Degeneration in Retinal Fundus Images, Journal of
Medical Systems. doi: 10.1007/s10916-008-9210-4.
Köse, C., Gençalioğlu, O., and Şevik, U., (2009). An
Automatic Diagnosis Method for the Knee Meniscus
Tears in MR Images, (Vol. 36, pp. 1208-1216), Expert
System With Applications.
Lowell, J, Hunter, A, Steel, D, Basu, A, Ryder, R,
Kennedy, (2004). Measurement of Retinal Vessel
Widths from Fundus Images Based on 2D Modeling,
Ieee Transactions On Medical Imaging.
Martin, A., Tosunoglu, S., (2000). Image Processing
Techniques for Machine Vision, Florida Conference
on Recent Advances in Robotics, Boca Raton, FL:
Florida Atlantic University.
Newsom, R. S. B., Sullivan, P. M., Rassam, S. M. B.,
Jagoe R., Kohner, E. M., (1992). Retinal Vessel
Measurement: Comparison between Observer and
Computer Driven Methods, (Vol. 230, pp. 221-225),
Graefe's archive for clinical and experimental
ophthalmology.
Pappas, T.N., and Lim, J.S., (1988). A New Method for
Estimation of Coronary Artery Dimensions in
hgiograms, (Vol. 36, pp. 1501-1512). IEEE Trans. On
Acoust. Sp. And Sign. Proc.
Parker, J., R., (1994). Practical Computer Vision using
C, Wiley Computer Publishing.
Ritter, G., X., Wilson, J., N., (1996). Handbook of
Computer Vision Algorithms in Image Algebra, CRC
Press.
Russ, J. C., (1992). The Image Processing Handbook,
CRC Press
.
Sonka, M., Hlavac, V., Boyle, R., (1998). Image
Processing, Analysis, and Machine Vision, 2nd
Edition, Pws. Pub. Co.
Stanton, A.V., Wasan, B., Cerutti, A., Ford, S., Marsh, R.,
Sever, P.P., Thom, S.A., Hughes, A.D., (1995).
Vascular Network Changes in the Retinal with Age
and Hypertension, (Vol.13, pp 1724), J. Hypertens.
STARE Project, Retrieved 20 March 2009 from
http://www.parl.clemson.edu/stare/.
BIOINFORMATICS 2010 - International Conference on Bioinformatics
18
