
A SUBSPACE METHOD FOR THE DETECTION OF
TRANSCRIPTION FACTOR BINDING SITES
Erola Pairo, Santiago Marco
Institut de Bioenginyeria de Catalunya, Baldiri i Reixac 13, 08028, Barcelona, Spain
Departament d’electronica, Universitat de Barcelona, Mart´ı i Franqu`es 1, 08028, Barcelona, Spain
Alexandre Perera
Centre de Recerca en Enginyeria Biom´edica
CIBER de Bioingenier´ıa, Materiales y Nanomedicina (CIBER-BBN), Spain
Keywords:
Transcription factors, Binding sites, Numerical DNA, Principal components analysis, Missing values, BPCA.
Abstract:
Transcription Factor binding sites are short and degenerate sequences, located mostly at the promoter of the
gene, where some proteins bind in order to regulate transcription. Locating these sequences is an impor-
tant issue, and many experimental and computational methods have been developed. Algorithms to search
binding sites are usually based on Position Specific Scoring Matrices (PSSM), where each position is treated
independently. Mapping symbolical DNA to numerical sequences, a detector has been built with a Principal
Component Analysis of the numerical sequences, taking into account covariances between positions. When
a treatment of missing values is incorporated the Q-residuals detector, based on PCA, performs better than
a PSSM algorithm. The performance on the detector depends on the estimation of missing values and the
percentage of missing values considered in the model.
1 INTRODUCTION
The Central dogma of molecular biology establishes
that information flows from DNA to RNA by means
of a process called transcription, and then RNA is
translated into proteins. Gene expression is highly
regulated by complex mechanisms that involve both
transcription and translation.
One of the most important mechanisms to regulate
transcription is the binding of some proteins, tran-
scription factors, to DNA specific sequences located
mostly near the gene start site. These transcription
factor binding sites (TFBS) are commonly short se-
quences (typically 5-20 bp), that show high variability
without loss of function, although they are evolution-
ary conserved. In order to unravel the mechanisms in-
volved in gene expression, finding and understanding
the function of these sequences is a major challenge
in biology.
In the last years there has been many computa-
tional and experimental advances in the discovery
of TFBS (Elnitski et al., 2006), and that, together
with the increasing availability of genome data, made
it possible to develop TFBS databases like JAS-
PAR (http://jaspar.binf.ku.dk)(Sandelin et al., 2004)
or TRANSFAC (http://www.gene-regulation.com)
(Wingender et al., 2000), and models to search for
TFBS within genome data.
Although evidences that interdependences between
nucleotides in TFBS exists (Bulyk et al., 2002), most
of the methods used to model or search for bind-
ing sites in databases, are based on Position Specific
Scoring Matrices (PSSM) methods (Stormo, 2000),
which assume that each position in the binding site
is independent. Some examples of algorithms using
PSSM, are MAST (Bailey and Gribskov, 1998), based
on the QFAST algorithm and available in Internet as
part of the MEME suite (Bailey and Elkan, 2006) and
MATCH (Kel et al., 2003), that uses information per
sequence, in order to construct a PSSM.
A large body of knowledge exists for specific event
detection in numerical sequences (signals). For this
reason it may be interesting to translate symboli-
cal DNA sequences into numerical sequences. This
translation has been advocated by different authors
with different methods, see for instance (Anastassiou,
102
Pairo E., Marco S. and Perera A. (2010).
A SUBSPACE METHOD FOR THE DETECTION OF TRANSCRIPTION FACTOR BINDING SITES.
In Proceedings of the First International Conference on Bioinformatics, pages 102-107
DOI: 10.5220/0002697301020107
Copyright
c
SciTePress

2001).
Last year we proposed a detector, based on a Princi-
pal Components Analysis of the numerical DNA se-
quences, using it to detect yeast and E. Coli TFBS
within synthetic and chromosomic data. The scope
of the project was to demonstrate that, even if the co-
variance is just a second order statistics, it can capture
information of position interdependencies in binding
sites, and, consequently, a detector can be built using
that information. In this paper we extent the analy-
sis of that detector and incorporate the treatment of
missing values, comparing the results of our detector
with a PSSM algorithm for real data using S. Cere-
visiae TFBS and with MAST algorithm for synthetic
data and D.Melanogaster TFBS.
2 MATERIALS AND METHODS
2.1 Data
In order to carry out models and subsequently search
for binding sites in chromosomes, Saccharomyces
cerevisiae and Drosophila Melanogaster TFBS have
been extracted from the TRANSFAC public database,
which contains data on transcription factors, their
binding sites and regulated genes.
In the case of yeast TFBS, the information on the
relative position to the gene has also been collected.
Chromosome sequences of all the yeast genome
and gene positions, belonging to genes regulated by
transcription factors modeled, have been taken from
the EMBL database (Baker et al., 2000).
For the analysis of Drosophila TFBS, 1923 promoter
sequences have been collected between -499 and
+100 relative to Transcription Start Site (TSS), from
the Eukaryotic Promoter Database (Schmid et al.,
2006) in order to build the background models used
to simulate Drosophila DNA. In table 1, information
on the TFBS used in this study is summed up,
showing the number of sequences and nucleotides for
each TF.
2.2 Preprocessing
2.2.1 Alignment
Sequences in TRANSFAC belonging to the same
binding site do not have the same length. In order to
analyze the TFBS is needed to align these sequences.
To construct models for yeast TFBS, two different
algorithms have been used, MUSCLE (Edgar, 2004)
and CLUSTALW (Thompson et al., 1994). The rea-
son to use different alignment methods is that they
producedifferent matrices with significant differences
in the detection of binding sites. The method giving
a better result has been used in each case. To study
D.Melanogaster TFBS, the sequences in TRANSFAC
have been used as an input for the MEME program,
which is a motif discovery that return motifs mod-
els. The aligned sequences of the MEME output have
been used as an input for MAST and Q-residuals, to
ensure that the comparison is done using the same se-
quences.
Due to the differences in length, when sequences are
aligned gaps must appear. In some positions there are
nucleotides present in some sequences but missing in
others. These gaps (missing values) are located at the
beginning and end of the sequences. Although inser-
tions or deletions in intermediate positions are the-
oretically possible, they are not frequent, and align-
ments producing them have been discarded.
2.2.2 Conversion to Numerical Sequences
Once the sequences have been aligned, in order to
perform a PCA, they must be converted to a rectan-
gular matrix of numerical sequences. Two processes
are needed. First translate symbolical DNA to numer-
ical sequences, and then a treatment of the missing
values.
The conversion from symbolical to numerical DNA
used is that proposed for Silverman and Linske (Sil-
verman and Linske, 1986), where each nucleotide is
placed at the vertex of a regular tetrahedron. It is a
conversion symmetric for all nucleotides, as it can be
seen in figure 1. Each sequence of length M becomes
a sequence of length 3× M, concatenating numerical
vectors corresponding to each nucleotide. Then, the
N sequences belonging to the same transcription fac-
tor where arranged in a matrix form.
−0.5
0
0.5
1
−1
0
1
−0.5
0
0.5
1
T=(2sqrt(2)/3, 0, −1/3)
A=(0, 0, 1)
G=(−sqrt(2)/3, −sqrt(6)/3, −1/3)
C=(−sqrt(2)/3, sqrt(6)/3, −1/3)
Figure 1: Schema to illustrate the numerical representation
of DNA. Each nucleotide is placed in a vertex of a regular
tetrahedron.
A SUBSPACE METHOD FOR THE DETECTION OF TRANSCRIPTION FACTOR BINDING SITES
103

Table 1: Information about TFBS used, the alignment method, and the results using the different methods.
TF Organism Alignment No M.V PSSM 50% all
ROX1 S. Cerevisiae MUSCLE 8.1520 7.1040 X X
ABF1 S. Cerevisiae MUSCLE 7.1972 7.8609 9.5956 8.1868
MCM1 S. Cerevisiae MUSCLE 3.5518 3.1236 4.7872 3.9900
Repr. CAR1 S. Cerevisiae CLUSTALW 6.0748 7.6009 7.8240 X
MIG1 S. Cerevisiae CLUSTALW 5.3507 4.7297 7.6454 4.4844
ADF1 D. Melanogaster MEME 7.5159 8.7789 10.2449 X
Bcd D. Melanogaster MEME 5.7499 5.8511 5.9865 X
2.2.3 Missing Values Estimation
Three different treatments have been studied for the
missing values. The first one is to omit missing val-
ues, taking into account only the positions where the
nucleotide is known for all sequences. That is the
common treatment when a construction of a DNA ma-
trix is needed, for example in PSSM algorithms.
The second treatment consists in the assumption that
missing values are nucleotides that do not affect the
binding of a TF to that particular sequence, but that
may be important in the sequences where the position
is present. To use the information in the sequences
where the nucleotide is present is need to estimate
these missing values. The approach taken is that,
using the nucleotides probability distribution in the
genome, and the numerical conversion, the nucleotide
can be located at the mean of the chromosome, as in
equation 1
−→
MV = P(A)
−→
A + P(C)
−→
C + P(G)
−→
G + P(T)
−→
T (1)
In order to do a more accurate estimation, a
Bayesian Principal Components Analysis (BPCA) is
performed. BPCA is a Bayesian estimation method
for a probabilistic reformulation of PCA. It was first
proposed by Bishop to choose automatically the num-
ber of principal components (Bishop, 1999), and later
used in micro-array experiments to estimate missing
values, showing a high accuracy (Oba et al., 2003).
To implement this method we use the R PcaMethods
package (Stacklies et al., 2007).
Using these techniques, different percentages of miss-
ing values can be estimated, keeping the number of
nucleotides equal in all sequences in order to have a
rectangular matrix.
2.3 Definition of the Subspace Method
2.3.1 Principal Components Analysis
Principal Components Analysis reduces the dimen-
sionality of TFBS dataset while retaining as much
as the variance present in the original data. This is
achieved projecting the intercorrelated data into the
subspace of eigenvectorsretaining the maximum vari-
ance giving new variables which are uncorrelated. In
equation 2, the PCA bilinear decomposition is de-
fined. X is the TFBS numerical matrix, A is the pro-
jected data, called scores, B is the loading matrix,
which define the subspace where data is projected and
E is the error obtained from reducing the dimension-
ality.
X = AB
T
+ E (2)
2.3.2 Q-residuals Detector
The detector has been built using the Q-residuals of
the Principal Components model, calculated as in
equation 3, where E is the error obtained modeling the
binding sites. Q-residuals are the Euclidean distance
from a given sequence to the subspace of principal
components.
Q = EE
T
(3)
Most of the variance must be explained by the
model. Q-residuals of sequences belonging to the
modeled TFBS should be smaller than Q-residuals of
random or other genomic sequences. Consequently,
defining a threshold should be sufficient to distinguish
between TFBS from other sequences.
2.4 Comparison
2.4.1 Comparison with MATCH within Real
Data
To compare our detector to existing PSSM meth-
ods, showing that calculating interdependencies can
lead to an improvement on the detection, we im-
plement the MATCH algorithm, but taking into ac-
count the probability distribution of nucleotides in
the yeast genome. The PSSM matrix is calculated
as in equation 4, where f
i,b
i
is the frequency of each
BIOINFORMATICS 2010 - International Conference on Bioinformatics
104

nucleotide in each position and I(i) is the informa-
tion vector. Then a Similarity Score for the se-
quence and the core (five first consecutive more con-
served positions), are used to discriminate between
TFBS as in the MATCH program (http://www.gene-
regulation.com/pub/programs.html)
Score =
L
∑
i=1
I(i) f
i,b
i
(4)
2.4.2 Comparison with MAST within Synthetic
Data
A comparison with TFBS of a more complex or-
ganism has been done using the TFBS of D.
Melanogaster. The background sequences of
Drosophila have been simulated with a fourth-order
Markov Model, constructed using the Drosophila pro-
moter regions from the EPD and the Cosmo R pack-
age (Bembom et al., 2007). Drosophila DNA se-
quences have been simulated and each 1000 nu-
cleotides a TFBS sequence has been inserted.
TFBS sequences (without alignment) have been used
as the MEME input, and the aligned sequences from
the MEME output have been the input for MAST and
the Q-residuals detector, to ensure that the compari-
son using the same sequences, aligned the same way.
2.4.3 Comparison Method
Receiver Operating Characteristic (ROC) curves have
been computed to compare the performance of the
detectors, using a leave-one-out cross validation
method. When comparison has been performed
within real data, the sequences located at the chro-
mosome have been omitted.
The Area Under Curve (AUC) has been calculated to
show the accuracy of the different detectors. In the
case of the MATCH algorithm, the Core Similarity
Score has been fixed in its maximum value, in order
to obtain the greatest AUC curve, varying just the Se-
quence Similarity Score threshold. In MAST com-
parison, different models have been constructed using
MEME, and the model with best AUC has been com-
pared to Q-residuals detector.
To have an accurate detector means to have an ex-
tremely small false positive rate, with an AUC near
than one. Differences between detector become al-
most zero, even if they are significant. To avoid this
problem, a new parameter has been defined in equa-
tion 5, which changes as the logarithm of AUC, mak-
ing differences in performance more visible.
α = −log(1 − AUC) (5)
Not only PSSM methods have been compared to
our detector, but AUC has also been used to com-
pare between detectors taking into account different
amounts of gaps and between the two methods to es-
timate missing values.
3 RESULTS
3.1 Comparison to PSSM Algorithms
3.1.1 Comparison with MATCH within Real
Data
Comparison to the MATCH algorithm has been done
in three different cases. First when missing values
have been omitted, then when only these positions
where the nucleotides are present at least in a 50% of
the sequences have been considered, and finally using
all the positions available. The estimation of the miss-
ing values in the last two cases, has been the assump-
tion that they are in the mean of the chromosome.
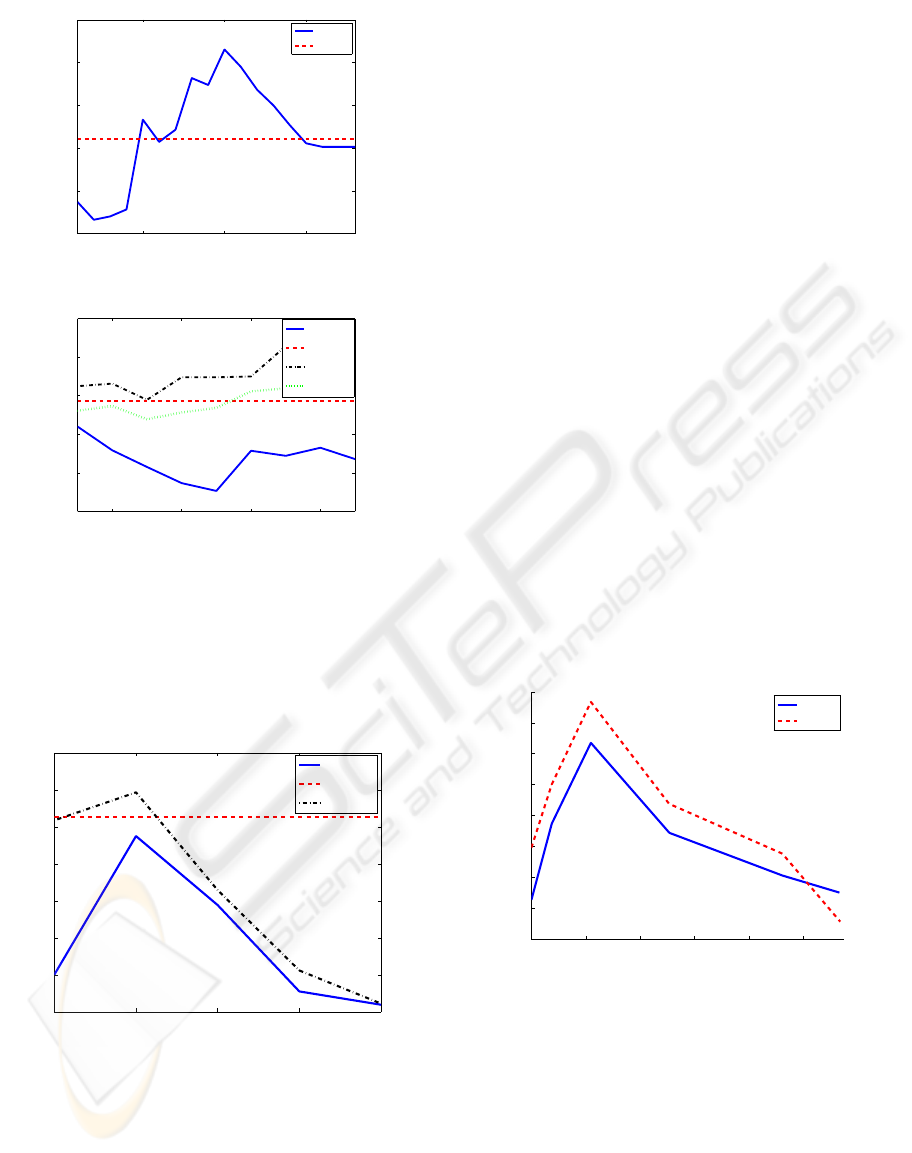
In figure 2, ROX1 and ABF1 binding sites have been
studied for different number of principal components.
ROX1 sequences have all the same length, no treat-
ment of missing values is needed, and it can be seen
in figure 2 a) that our detector has a better perfor-
mance than the PSSM algorithm. In ABF1 binding
sites, we need the treatment of missing values to out-
perform the PSSM algorithm. It can also be observed
that estimating all the missing values leads to a worse
detection than estimating just those present in at least
half of the sequences.
The same study has been done for different S.
Cerevisiae binding sites, table 1 summarizes the re-
sults, confirming that, in some cases PSSM algorithm
obtains better results when no missing values are con-
sidered but the treatment of missing values increases
leads to best AUC than PSSM. In all cases, the esti-
mation of all missing values, deteriorates the detector
performance when is compared to the estimation of a
percentage of M.V. A compromise between informa-
tion and uncertainty introduced must be reached.
3.1.2 Comparison with MAST within Synthetic
data
Comparison to MAST has been done for D.
Melanogaster TFBS detection, when missing values
are omitted and when a percentage of missing values
has been estimated with the mean of the chromosome
method. In figure 3 the results using MAST and Q-
residuals detector have been shown in Bcd binding
A SUBSPACE METHOD FOR THE DETECTION OF TRANSCRIPTION FACTOR BINDING SITES
105
5 10 15
6
6.5
7
7.5
8
8.5
nPCs
−log(1−AUC)
PCA
PSSM
(a) AUC ROX1
2 4 6 8
5
6
7
8
9
10
nPcs
−log(1−AUC)
No M.V.
Match
50%
All
(b) AUC ABF1
Figure 2: AUC vs the number of PCs in ROX1 and ABF1,
using different percentages of missing values.
sites and synthetic data. Q-residuals detector outper-
forms MAST algorithm when information available
in at least 50% of the sequences is taken into account.
1 2 3 4 5
5
5.2
5.4
5.6
5.8
6
6.2
nPCs
−log(1−AUC)
No M.V.
MAST
50%
Figure 3: Comparison between Q-residuals detector and
MAST algorithm for D.melanogaster TFBS and synthetic
data. Q-residuals outperforms MAST when missing values
are taken into account.
The same analysis has been done in Adf1 bind-
ing sites, and results are summarized in table 1, con-
firming that Q-residuals detector outperforms PSSM
methods when missing values are taken into account.
3.2 BPCA Missing Value Estimation
Comparison between BPCA and the first approxima-
tion of the missing values in ABF1 is shown in fig-
ure 4, where the number of missing values has been
increased from 0% to 12% just incorporating to the
model positions missing in an increasing number of
sequences. It can be first observed that the result
without missing values estimation of BPCA is not the
same as the result performing PCA, that is caused by
the fact that in BPCA estimation of missing values
vectors are not constrained to be orthogonal. Then it
can also be seen that BPCA estimation lead to better
results, for a small number of missing values consid-
ered, but then its results fall. Both BPCA and mean of
the chromosome have a maximum AUC in a percent-
age of missing values equal to 2.19%.
The percentage of missing values in TFBS matrices,
can be near 50% , and all of them are concentrated
at the beginning and end of the sequences. It leads
to positions where few nucleotides are present, and
more than ten must be estimated. BPCA method
needs information available in order to estimate miss-
ing values, when little information is available it be-
comes an unuseful method, leading to models where
all loadings are 0 vectors. In that cases, the mean-
of-the-chromosome method which needs no informa-
tion, performs better.
0 2 4 6 8 10
6.5
7
7.5
8
8.5
9
9.5
10
10.5
% M.V.
−log(1−AUC)
PCA
BPCA
Figure 4: AUC comparison between BPCA and mean of the
chromosome treatment of missing values in ABF1.
4 CONCLUSIONS
Performing a Principal Components Analysis of nu-
merical TFBS has been demonstrated to be an effec-
tive method to detect TFBS within real and synthetic
data, having always a better performance than PSSM
methods when missing values treatment is incorpo-
rated. This demonstrates that covariance, in spite of
BIOINFORMATICS 2010 - International Conference on Bioinformatics
106

being just a second order statistics can capture TFBS
information.
More information can be incorporated taken into ac-
count missing values of TFBS. When a treatment of
missing values is incorporated the detector perfor-
mance increases. When only that nucleotides present
in at least 50% of the sequences are taken into ac-
count, the AUC is greater than when all gaps are
present in the model. The reason is that gaps are
placed in the beginning and end of the sequences,
and in some positions we have almost no information
available to construct a model. An equilibrium be-
tween information and uncertainty incorporated must
be reached for each TFBS.
A more complex estimation of missing values, BPCA,
has been proved to perform better when the percent-
age of missing values is low, but to fall quickly to
worse results than the simple approximation to the
mean of the chromosome, when more missing val-
ues are considered. BPCA fails when no information
is available in a certain position because this method
tries to estimate a value using the existing informa-
tion.
ACKNOWLEDGEMENTS
This work has been partially supported by the Span-
ish Ministerio de Ciencia y Tecnologa through the CI-
CYT GRANT TEC2007-63637 and the Ramon y Ca-
jal program.CIBER-BBN is an initiative of the Span-
ish ISCIII. E.P. wants to thank IBEC for supporting
her PhD financially.
REFERENCES
Anastassiou, D. (2001). Genomic signal processing. Signal
Processing Magazine, IEEE, 18(4):8–20.
Bailey, T. and Elkan, C. (2006). Meme:discovering and
analizing dna and protein sequence motifs. Nucleic
acids research, 34:W369–W373.
Bailey, T. and Gribskov, M. (1998). Combining evidence
using p-values: Application to sequence homology
searches. Bioinformatics, 14:48–54.
Baker, W., van den Broek, A., Camon, E., Hingamp, P.,
Sterk, P., Stoesser, G., and Tuli, M. A. (2000). The
EMBL Nucleotide Sequence Database. Nucl. Acids
Res., 28(1):19–23.
Bembom, O., Kelez, S., and van der Laan, M. J. (2007). Su-
pervised Detection of Conserved Motifs in DNA Se-
quences with Cosmo. Statistical Applications in Ge-
netics and Molecular Biology, 6:article 8.
Bishop, C. (1999). Variational principal components. In Ar-
tificial Neural Networks, 1999. ICANN 99. Ninth In-
ternational Conference on (Conf. Publ. No. 470), vol-
ume 1, pages 509–514 vol.1.
Bulyk, M. L., Johnson, P. L. F., and Church, G. M. (2002).
Nucleotides of transcription factor binding sites exert
interdependent effects on the binding affinities of tran-
scription factors. Nucl. Acids Res., 30(5):1255–1261.
Edgar, R. (2004). Muscle: multiple sequence alignment
with high accuracy and high throughput. Nucleic
Acids Res, 32(5):1792–1797.
Elnitski, L., Jin, V. X., Farnham, P. J., and Jones, S. J.
(2006). Locating mammalian transcription factor
binding sites: A survey of computational and exper-
imental techniques. Genome Research, 16(12):1455–
1464.
Kel, A., Gossling, E., Reuter, I., Cheremushkin, E.,
Kel-Margoulis, O., and Wingender, E. (2003).
MATCHTM: a tool for searching transcription factor
binding sites in DNA sequences. Nucl. Acids Res.,
31(13):3576–3579.
Oba, S., Sato, M.-a., Takemasa, I., Monden, M., Matsub-
ara, K.-i., and Ishii, S. (2003). A Bayesian missing
value estimation method for gene expression profile
data. Bioinformatics, 19(16):2088–2096.
Sandelin, A., Alkema, W., Engstrom, P., Wasserman, W. W.,
and Lenhard, B. (2004). JASPAR: an open-access
database for eukaryotic transcription factor binding
profiles. Nucl. Acids Res., 32(suppl 1):D91–94.
Schmid, C. D., Perier, R., Praz, V., and Bucher, P. (2006).
EPD in its twentieth year: towards complete promoter
coverage of selected model organisms. Nucl. Acids
Res., 34:D82–85.
Silverman, B. and Linske, R. (1986). A measure of dna
periodicity. Journal of Theoretical Biology, 118:295–
300.
Stacklies, W., Redestig, H., Scholz, M., Walther, D., and
Selbig, J. (2007). pcaMethods a bioconductor package
providing PCA methods for incomplete data. Bioin-
formatics, 23(9):1164–1167.
Stormo, G. (2000). Dna binding sites: Representation and
discovery. Bioinformatics, 16:16–23.
Thompson, J. D., Higgins, D. G., and Gibson, T. J. (1994).
CLUSTAL W: improving the sensitivity of progres-
sive multiple sequence alignment through sequence
weighting, position-specific gap penalties and weight
matrix choice. Nucl. Acids Res., 22(22):4673–4680.
Wingender, E., Chen, X., Hehl, R., Karas, H., Liebich, I.,
Matys, V., Meinhardt, T., Prubeta, M., Reuter, I., and
Schacherer, F. (2000). TRANSFAC: an integrated sys-
tem for gene expression regulation. Nucl. Acids Res.,
28(1):316–319.
A SUBSPACE METHOD FOR THE DETECTION OF TRANSCRIPTION FACTOR BINDING SITES
107
